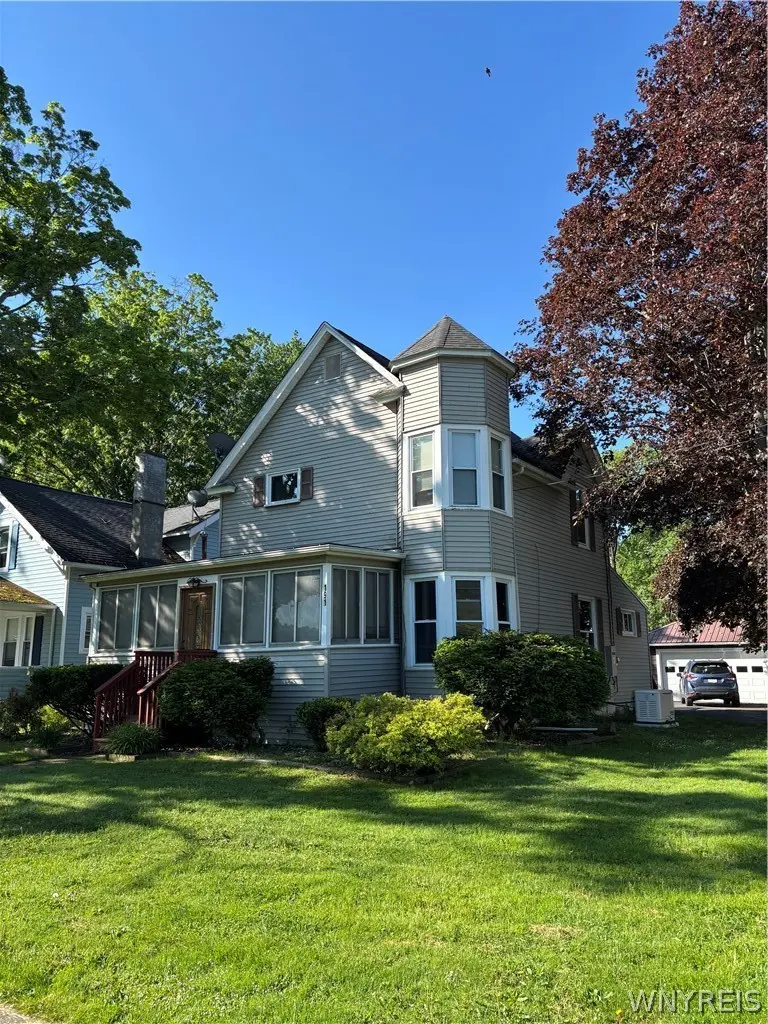
191 Front Ave · Salamanca, NY
Flood risk 1/10 · Minimal
- FEMA flood zone
- —
- Chance of flooding over 30 yrs
- 0.0%
- Est. flood insurance / yr
- —
Fire risk 2/10 · Minimal
- Est. fire insurance / yr
- $691 – $1,283
Heat risk 1/10 · Minimal
- Hot days now (above 90°F)
- 8 days/yr
- Hot days in 30 yrs
- 18 days/yr
Wind risk 1/10 · Minimal
- Chance of severe wind over 30 yrs
- —
Air-quality risk 1/10 · Minimal
- Unhealthy air days now
- 0 days/yr
- Unhealthy air days in 30 yrs
- 0 days/yr
Risk factors via First Street. Map © Google.
Why this score? — see what drove the B- grade
The composite is a weighted blend of 9 inputs, each scored 0–100. Each bar is that input's sub-score; the figure is the points it added to the 100-point composite (weight × sub-score).
- Cash flow +24.7/30.0
- ARV discount +9.5/15.0
- DSCR +8.0/10.0
- Appreciation +7.3/10.0
- 1% rule +6.4/10.0
- Livability +3.6/5.0
- Schools +3.0/10.0
- Rent growth +2.5/5.0
- Condition / age +2.5/5.0
$155,000
🖨 Deal sheet (PDF) 📄 Offer letter ✓ Due diligence
Listing remarks
This 3 bedroom/1 bath home has a beautiful location overlooking the Allegany River on Front Avenue. From the enclosed and heated spacious front porch you will take in the views of surrounding hillsides and the Allegany River. The partially fenced in yard adds privacy and includes 2 storage buildings, a 2-car garage and blacktop driveway. A Generac Generator has also been added in case of power outages. You can enjoy the backyard from the deck and a planting box, for additional landscaping, enhances the beauty of the backyard. From the enclosed porch you enter the foyer which includes a large closet. The very open living room has plenty of space for family and entertaining. Off the Foyer you
Key facts
- Generac generator
- Planting box
- Large closet
Tags
Property features AI
Exterior
- Parking: Detached garage with garage door opener; 2-car garage
- Utilities: Public water connected; Sewer connected; Cable available; Circuit breaker electrical service
- Home design: 2-story existing home; Block foundation; Vinyl siding; Has a view
- Construction: Built previously (existing); Vinyl siding; Block foundation
- Exterior features: Blacktop driveway; Deck; Enclosed porch; Porch; Partial fence; Shed(s)/storage; River access and stream frontage; Rectangular residential lot; City street frontage
Interior
- Kitchen: Electric cooktop; Microwave; Refrigerator; Eat-in kitchen
- Bedrooms: 9 total rooms (includes living spaces and entry foyer)
- Flooring: Carpet; Varied flooring
- Bathrooms: 1 full bathroom
- Heating & cooling: Electric baseboard heating
- Interior features: Ceiling fan(s); Separate/formal dining room; Entrance foyer; Eat-in kitchen; Separate/formal living room; Generator
- Laundry & utility: Washer; Dryer; Electric water heater
Neighborhood map
What this means for you Summary
Snapshot
- This is a 3-bed/1.5-bath single-family listed at $155k.
Deal economics
- At list price, monthly cash flow is $322 ($4k/yr) — positive.
- The deal already cash-flows at list — no discount required.
- Meets the 1% rule at list price ($2k rent vs $155k).
Location & tenants
- Location reads 71/100 on livability (#380 in NY) — a middle-class / working-renter tenant base. Strengths: cost of living A+, housing A+, health & safety A+; Watch: crime C-, amenities F, commute F.
- Salamanca City School District (town): math 29% / reading 43% proficiency, ranked #560 of 590 in NY (top 95%) — families likely to look elsewhere, expect single-tenant / working-renter base with shorter leases.
- Zoned schools: Prospect Elementary School (math 27% / reading 37%, grade F, #1,646 of 2,108 statewide, top 80%, 435 students, 68% FRL); Seneca Intermediate School (math 24% / reading 39%, grade F, #522 of 729 statewide, top 73%, 377 students, 72% FRL); Salamanca High School (math 47% / reading 62%, grade C-, #912 of 1,100 statewide, top 85%, 481 students, 61% FRL) — zoned schools average 67% FRL vs 51% district-wide (16 pts higher); higher-poverty schools than district average — tighter screening recommended.
- Market conditions: 27 active listings in the ZIP; 128 units permitted in Cattaraugus County in 2024 (21 in 5+ unit buildings).
Forward outlook
- In year one you build about $8k of equity ($1k loan paydown + $7k appreciation (4.5% local appreciation)).
- Cattaraugus County population projected at -28% by 2050 — secular population decline; favor cash flow + early exit over multi-decade hold.
- At projected returns (4.5% appreciation + 3.0% rent growth), your $43k cash investment doubles in ~4 years — after that, you're playing with house money.
- By year 5, paydown + projected appreciation supports a ~$35k cash-out refi (75% LTV) — recoverable capital for the next deal without selling this one.
Negotiation context
- Only 11 days on market — expect competitive offers; lowballing is unlikely to land.
Risks & watch-outs
- Watch-outs: built in 1910 — expect roof / HVAC / electrical / plumbing capex.
Questions for the listing agent
- Built in 1910 — when were the roof, HVAC, electrical panel, plumbing, and water heater last replaced?
- Is there a deadline driving the sale (1031 exchange, divorce, estate, relocation)? That informs how much negotiation room exists.
- What's the average days-on-market for RENTAL listings here right now (not sales)? A rising rental-DOM trend means longer vacancies and softer asking-rent achievability than the comps imply.
- What's the recent tenant-quality profile in this submarket — average credit score on applications, eviction rate, late-payment / NSF rate, and stable-employment percentage? A property-management company in the area should have these aggregated.
- How much new for-sale + rental construction is in the pipeline within 1–3 miles? Heavy new supply typically softens prices + rents 12–24 months out; constrained supply supports both.
Investment metrics
- 1% rule
- 1.14% ✓
- Cap rate
- 8.79%
- Cash-on-cash
- 8.91%
- DSCR
- 1.40
- GRM
- 7.3
CMA / ARV
- ARV (on-the-fly)
- $162,158
- Comps found
- 8
Show comp detail 8 sales within ~0.75 mi
| Address | Dist | Beds/Ba | Sqft | Sold | Price | $/sf | Match |
|---|---|---|---|---|---|---|---|
| 384 Broad St | 0.22mi | 4/2.0 (+1) | 1,894 (+4%) | 6mo | $120,000 | $63 | 71 |
| 335 Broad St | 0.21mi | 4/2.0 (+1) | 1,862 (+2%) | 11mo | $127,500 | $68 | 70 |
| 77 Kent Blvd | 0.15mi | 4/1.5 (+1) | 1,744 (-4%) | 19mo | $156,000 | $89 | 65 |
| 66 Waite Ave | 0.59mi | 3/1.5 | 1,647 (-10%) | 4mo | $179,900 | $109 | 53 |
| 84 Frank St | 0.54mi | 4/1.0 (+1) | 1,865 (+2%) | 15mo | $121,900 | $65 | 52 |
| 17 Waite Ave | 0.55mi | 4/1.0 (+1) | 1,747 (-4%) | 22mo | $58,000 | $33 | 42 |
| 113 Broad St | 0.39mi | 3/3.0 | 2,050 (+12%) | 17mo | $191,000 | $93 | 41 |
| 15 Smith St | 0.64mi | 4/1.5 (+1) | 1,960 (+8%) | 16mo | $180,000 | $92 | 40 |
Match score weights: distance 35% · size 25% · config 20% · recency 20%. Top-matched comps best support the ARV.
Projected returns pro-forma
4.52% appreciation · 3.0% rent growth · sell at horizon
- IRR
- 19.5%
- Equity multiple
- 2.20×
- Total profit
- $52,107
- Equity at exit
- $83,392
- IRR
- 19.6%
- Equity multiple
- 4.27×
- Total profit
- $141,935
- Equity at exit
- $140,376
Cash invested: $43,400 (down + closing). Projections, not guarantees.
Landlord ↔ Tenant lean methodology
- Overall (STATE)
- 15 Strongly Tenant-Friendly
- State New York
- 15 Strongly Tenant-Friendly · D+10
- County
- — inherits STATE
- City
- — inherits STATE
ZIP-level market 14779
- Home prices YoY
- 1.4%
- Active inventory
- 27
- Price-to-rent
- 7.3×
Monthly cashflow live
- Estimated rent
- $1,764 medium interval (Pro) →
- Mortgage (P&I)
- −$813
- Tax est. 1.5%
- −$194 /mo · $2,325/yr
- Insurance
- −$65
- HOA
- −$0
- Lot rent
- −$0
- Vacancy / Maint / Mgmt
- −$370
- Net cashflow
- $322
Break-even live
Sensitivity live
| Price | -10% $429 | -5% $376 | +0% $322 | +5% $269 | +10% $215 |
|---|---|---|---|---|---|
| Rent | -10% $183 | -5% $253 | +0% $322 | +5% $392 | +10% $462 |
| Rate | -1.0pp $400 | -0.5pp $362 | base $322 | +0.5pp $282 | +1.0pp $241 |
UW: 25.0% down · 7.5% · 30yr · 1.5% tax · 5.0% vac · 8.0% maint · 8.0% mgmt
Financing live
Cash to close
- Down payment
- $38,750
- Closing costs
- $4,650
- Reserves months
- —
- Total cash needed
- —
Loan-product check · same deal, 3 products live
Conventional
25% down · 7.5% · 30yr
- Down + closing
- —
- Monthly P&I
- —
- Monthly cashflow
- —
- DSCR
- —
- Eligible?
- —
Personal DTI + credit; lowest rate.
DSCR
20% down · 8.5% · 30yr
- Down + closing
- —
- Monthly P&I
- —
- Monthly cashflow
- —
- DSCR
- —
- Eligible?
- —
No personal income docs; deal must DSCR.
Hard money
10% down · 12.0% · 12mo
- Down + closing
- —
- Monthly P&I
- —
- Monthly cashflow
- —
- DSCR
- —
- Eligible?
- —
Short-term bridge; refi at stabilization.
Listing history 10 events
-
2026-06-16status $155,000 Pending 11 DOM
-
2026-06-15days on market $155,000 Active 11 DOM
-
2026-06-13days on market $155,000 Active 9 DOM
-
2026-06-12days on market $155,000 Active 8 DOM
-
2026-06-09days on market $155,000 Active 5 DOM
-
2026-06-09price $155,000 Active 4 DOM
-
2026-06-08days on market $164,900 Active 4 DOM
-
2026-06-07days on market $164,900 Active 3 DOM
-
2026-06-05remarks 699-char remark
-
2026-06-05$164,900 Active 1 DOM
ⓘ Source: listings_history table (triggers on properties + properties_extension) + one-shot
backfill from property_details.listing_events for pre-trigger history.
Climate risk First Street
- Flood 1/10 Low 0% chance over 30 yrs
- Wildfire 2/10 Low
- Heat 1/10 Low 8 d/yr ≥90°F today · 18 d/yr by 30 yrs out
- Wind 1/10 Low
- Air quality 1/10 Low 0 unhealthy d/yr today · 0 by 30 yrs out
Nearby sold comps map
Loading sold comps map…
Walkable amenities ~0.75 mi
Loading nearby amenities…
Taxation est. · year 1
- Rental income
- $21,168
- − Mortgage interest
- −$8,682
- − Property taxes
- −$2,325
- − Insurance
- −$775
- − Repairs & maintenance
- −$1,693
- − Management
- −$1,693
- − Depreciation
- −$4,509
- Taxable income
- $1,490
- Est. tax owed @ 24.0%
- −$357
- After-tax cash flow
- $3,511/yr
For passive investors: Depreciation is non-cash, so a rental often shows a tax loss while cash-flowing — sheltering income. Rental losses are passive: they offset passive income freely, and up to $25,000/yr can offset ordinary (W-2) income if you actively participate and your MAGI is under $100k (phasing out to $0 by $150k); unused losses carry forward. On sale, claimed depreciation is recaptured at up to 25%, and gains may owe capital-gains tax (a 1031 exchange can defer both). Figures are a year-1 estimate at your 24.0% rate — not tax advice; consult a CPA.
Schools (NCES district)
- District
- Salamanca City School District
- NCES district ID
- 3625440
- Math proficiency
- 29% ▼ -12.00%
- Reading proficiency
- 43% ▲ 5.00%
- Median HH income
- $33,251
- Composite
- 29.52/100
- National rank
- #6500
- State rank
- #560 of 590 in NY
Livability — Salamanca
- Score
- 71/100
- State rank
- #380
- US rank
- #6521
Category grades
Schools grade is shown separately in the Schools card above.
Census & demographics
- Census place
- Salamanca, NY
- Population (ZIP)
- 6,791
Population outlook (Cattaraugus County) Hauer SSP2
- Today (2025)
- 71,623 people
- By 2030
- 67,751 · -5.4%
- By 2040
- 59,488 · -16.9%
- By 2050
- 51,601 · -28.0%
- By 2075
- 35,025 · -51.1%
- By 2100
- 21,243 · -70.3%
Race, ethnicity, and origin ACS 2023
- Neighborhood character
- Predominantly White (68%)
- Race & ethnicity
- White 68% Native American 18% Two or more races 9% Hispanic / Latino 5% Black 2%
- Common ancestry
- Romanian 9% Lithuanian 2% Slovak 1%
- Foreign-born
- 2% · Canada
- Languages at home
- 95% English-only · Spanish 2%
Political lean MEDSL · Cattaraugus
- 2024 margin
- Solid R (+32.8) · D 33.6% · R 66.4%
- 2008→2024 swing
- -22.2pp toward R · 2008: -10.6pp · 2024: -32.8pp
- All cycles
- 2024: R+32.8 2020: R+29.5 2016: R+34.4 2012: R+13.4 2008: R+10.6
Not yet ingested
- Civics
- —
Market trends
- HPI YoY
- ▲ 4.52%
- Current HPI
- 320.5286
- Rent YoY
- —
- Metro
- —
- State GDP YoY
- ▲ 2.60%
- F500 in state
- 92
Industry mix (Fortune 500 HQ in NY)
| Industry | F500 HQs | Revenue |
|---|---|---|
| Financial Services | 10 | $950B |
|
||
| Consumer Goods | 9 | $162B |
|
||
| Insurance | 4 | $225B |
|
||
| Telecommunications | 2 | $144B |
|
||
| Pharmaceuticals | 2 | $112B |
|
||
| Media / Entertainment | 2 | $69B |
|
||
Price history
1 event — show timeline
- 2026-06-01 Listed $164,900 WNYREIS
Cash-flow waterfall
monthlySold comps — $/sqft
last 12 mo · ≤1 miLoading sold comps…