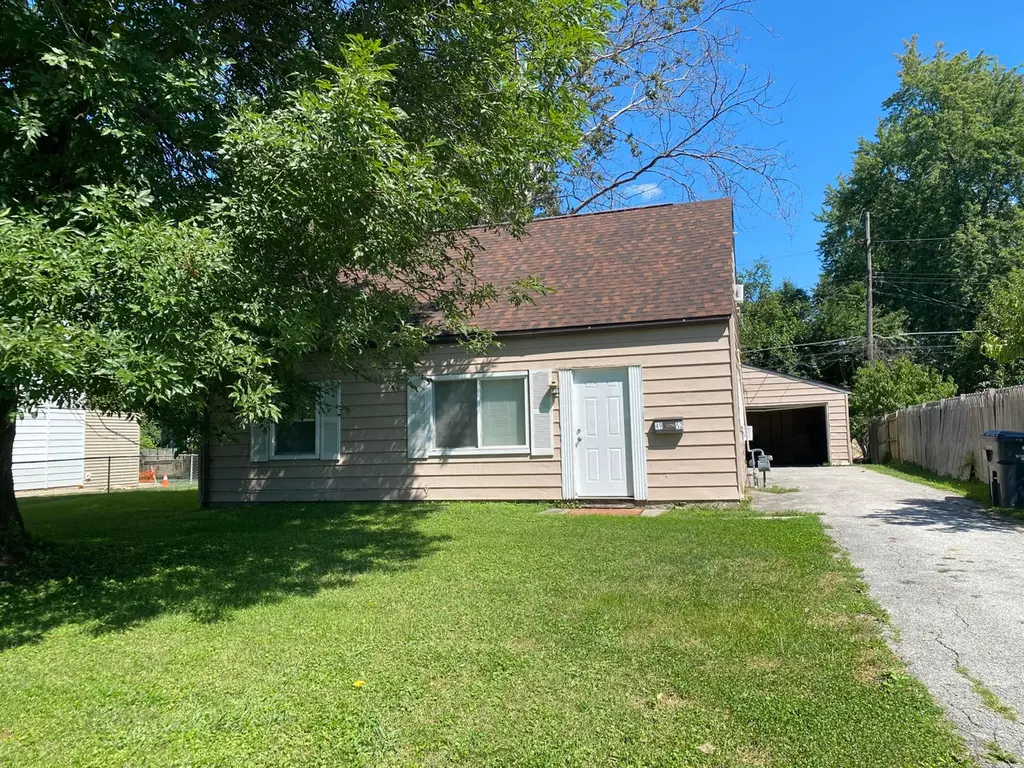
4952 Dimson Dr S · Whitehall, OH
Flood risk 3/10 · Minor
- FEMA flood zone
- X (unshaded)
- Chance of flooding over 30 yrs
- 0.2%
- Est. flood insurance / yr
- $507 – $1,088
Fire risk 1/10 · Minimal
- Est. fire insurance / yr
- $713 – $1,323
Heat risk 3/10 · Minor
- Hot days now (above 99°F)
- 7 days/yr
- Hot days in 30 yrs
- 18 days/yr
Wind risk 2/10 · Minimal
- Chance of severe wind over 30 yrs
- 1.0%
Air-quality risk 2/10 · Minimal
- Unhealthy air days now
- 1 days/yr
- Unhealthy air days in 30 yrs
- 3 days/yr
Risk factors via First Street. Map © Google.
Why this score? — see what drove the B grade
The composite is a weighted blend of 9 inputs, each scored 0–100. Each bar is that input's sub-score; the figure is the points it added to the 100-point composite (weight × sub-score).
- Cash flow +29.0/30.0
- ARV discount +15.0/15.0
- DSCR +10.0/10.0
- 1% rule +8.4/10.0
- Livability +3.6/5.0
- Rent growth +3.1/5.0
- Condition / age +2.5/5.0
- Schools +2.1/10.0
- Appreciation +0.0/10.0
$125,000
🖨 Deal sheet 📄 Offer letter ✓ Due diligence
Listing remarks MLS
Great Investor Opportunity. Priced Thousands below Appraised Value. Needs a little TLC. Call Today, Show Today. Subject to Bank Approval
Key facts
- 7,840 sq ft lot
- 2 garage spots
- Built 1953
Neighborhood map
What this means for you Summary
Snapshot
- This is a 4-bed/1.0-bath single-family listed at $125k.
Deal economics
- At list price, monthly cash flow is $428 ($5k/yr) — positive.
- The deal already cash-flows at list — no discount required.
- Meets the 1% rule at list price ($2k rent vs $125k).
- Recommended offer: $123k (1.5% below list) — sets the bar for market timing.
- Cap rate 10.4% vs local median 4.2% in Whitehall — top-decile yield for the area; either an underpriced asset or a hidden risk that comps aren't pricing in. Stress-test before assuming the spread holds.
Location & tenants
- Location reads 71/100 on livability (#399 in OH) — a middle-class / working-renter tenant base. Strengths: commute A+, cost of living A+, housing A+; Watch: schools D+, crime F, employment D-.
- Whitehall City (suburban): math 18% / reading 33% proficiency, ranked #603 of 656 in OH (top 92%) — low school quality limits family demand, transient renter base, plan for 1-2y turnover; 69% free/reduced lunch — lower-income household profile, screen leases tightly.
- Market conditions: Rents rising (+2.3%/yr); 67 active listings in the ZIP; 11 comparable units currently listed for rent nearby; rentals at typical pace (median 24d on market — plan ~3-4 weeks tenant-placement turnaround); 8,139 units permitted in Franklin County in 2024 (5,940 in 5+ unit buildings).
- This rent runs 37% of the median local income ($55k/yr) — at the standard rent-burdened threshold; future hikes will face affordability resistance.
Forward outlook
- Local home prices are declining (-3.0%/yr); year-one equity from $864 of loan paydown is wiped out by about $4k of value loss. Plan a longer hold.
- Franklin County population projected at +34% by 2050 — long-run rental-demand tailwind backs the buy-and-hold thesis.
- At projected returns (-3.0% appreciation + 2.3% rent growth), your $35k cash investment doubles in ~9 years — after that, you're playing with house money.
Negotiation context
- It's been on market 17 days — a 2% lower offer ($123k) is reasonable based on typical stale-listing flexibility.
- 5 sale attempts since 27y ago with the ask held roughly flat each time — persistent listings suggest the price (not the market) is what's stuck; bring a comps-based counter.
Risks & watch-outs
- Watch-outs: built in 1953 — expect roof / HVAC / electrical / plumbing capex.
Questions for the listing agent
- Built in 1953 — when were the roof, HVAC, electrical panel, plumbing, and water heater last replaced?
- Is there a deadline driving the sale (1031 exchange, divorce, estate, relocation)? That informs how much negotiation room exists.
- Schools are D-rated, which usually means shorter tenancies and higher turnover. Who's the typical renter profile here, and what's been the actual vacancy rate?
- Crime grade is F in this area — have there been break-ins, vandalism, or insurance claims at this property in the last 3 years? What carrier currently insures it and at what premium?
- What's the average days-on-market for RENTAL listings here right now (not sales)? A rising rental-DOM trend means longer vacancies and softer asking-rent achievability than the comps imply.
- What's the recent tenant-quality profile in this submarket — average credit score on applications, eviction rate, late-payment / NSF rate, and stable-employment percentage? A property-management company in the area should have these aggregated.
- How much new for-sale + rental construction is in the pipeline within 1–3 miles? Heavy new supply typically softens prices + rents 12–24 months out; constrained supply supports both.
Investment metrics
- 1% rule
- 1.34% ✓
- Cap rate
- 10.40%
- Cash-on-cash
- 14.67%
- DSCR
- 1.65
- GRM
- 6.2
CMA / ARV
- ARV (on-the-fly)
- $213,962
- Comps found
- 12
Show comp detail 12 sales within ~0.75 mi
| Address | Dist | Beds/Ba | Sqft | Sold | Price | $/sf | Match |
|---|---|---|---|---|---|---|---|
| 931 Antwerp Rd | 0.20mi | 3/1.0 (-1) | 1,054 (0%) | 2mo | $149,900 | $142 | 84 |
| 991 Antwerp Rd | 0.14mi | 3/2.0 (-1) | 1,054 (0%) | 7mo | $230,000 | $218 | 78 |
| 899 Antwerp Rd | 0.24mi | 3/1.0 (-1) | 1,054 (0%) | 8mo | $195,000 | $185 | 77 |
| 855 Dimson Dr E | 0.33mi | 3/2.0 (-1) | 1,054 (0%) | 5mo | $234,900 | $223 | 71 |
| 836 Antwerp Rd | 0.34mi | 3/1.0 (-1) | 1,054 (0%) | 10mo | $180,888 | $172 | 71 |
| 805 Exeter Rd | 0.33mi | 3/1.0 (-1) | 961 (-9%) | 2mo | $185,000 | $193 | 63 |
| 4662 Jae Ave | 0.57mi | 3/1.5 (-1) | 1,092 (+4%) | 3mo | $236,000 | $216 | 58 |
| 1211 Shady Lane Rd | 0.53mi | 3/1.0 (-1) | 912 (-14%) | 1mo | $169,900 | $186 | 47 |
| 1193 Marble Dr | 0.55mi | 3/1.0 (-1) | 912 (-14%) | 1mo | $185,000 | $203 | 46 |
| 1377 Marble Dr | 0.73mi | 3/1.0 (-1) | 1,152 (+9%) | 4mo | $220,000 | $191 | 42 |
| 1243 Simpson Dr | 0.69mi | 3/2.0 (-1) | 912 (-14%) | 1mo | $200,000 | $219 | 36 |
| 1195 Huntly Dr | 0.74mi | 3/2.0 (-1) | 912 (-14%) | 4mo | $230,000 | $252 | 31 |
Match score weights: distance 35% · size 25% · config 20% · recency 20%. Top-matched comps best support the ARV.
Projected returns pro-forma
-3.0% appreciation · 2.29% rent growth · sell at horizon
- IRR
- 4.4%
- Equity multiple
- 1.17×
- Total profit
- $5,847
- Equity at exit
- $18,638
- IRR
- 13.2%
- Equity multiple
- 2.02×
- Total profit
- $35,553
- Equity at exit
- $10,808
Cash invested: $35,000 (down + closing). Projections, not guarantees.
Landlord ↔ Tenant lean methodology
- Overall (STATE)
- 73 Landlord-Friendly
- State Ohio
- 73 Landlord-Friendly · R+6
- County
- — inherits STATE
- City
- — inherits STATE
ZIP-level market 43213
- Rents YoY
- 2.3%
- Active inventory
- 67
- Price-to-rent
- 6.2×
Monthly cashflow live
- Estimated rent
- $1,670 high interval (Pro) →
- Mortgage (P&I)
- −$656
- Tax from tax record
- −$184 /mo · $2,211/yr
- Insurance
- −$52
- HOA
- −$0
- Vacancy / Maint / Mgmt
- −$351
- Net cashflow
- $428
Break-even live
UW: 25.0% down · 7.5% · 30yr · 1.5% tax · 5.0% vac · 8.0% maint · 8.0% mgmt
Financing live
Cash to close
- Down payment
- $31,250
- Closing costs
- $3,750
- Reserves months
- —
- Total cash needed
- —
Loan-product check · same deal, 3 products live
Conventional
25% down · 7.5% · 30yr
- Down + closing
- —
- Monthly P&I
- —
- Monthly cashflow
- —
- DSCR
- —
- Eligible?
- —
Personal DTI + credit; lowest rate.
DSCR
20% down · 8.5% · 30yr
- Down + closing
- —
- Monthly P&I
- —
- Monthly cashflow
- —
- DSCR
- —
- Eligible?
- —
No personal income docs; deal must DSCR.
Hard money
10% down · 12.0% · 12mo
- Down + closing
- —
- Monthly P&I
- —
- Monthly cashflow
- —
- DSCR
- —
- Eligible?
- —
Short-term bridge; refi at stabilization.
Rent comps 11 comps
| Address | Beds | Baths | Sqft | Rent | $/sqft | DOM | Units | Dist |
|---|---|---|---|---|---|---|---|---|
| 984 Exeter Rd Columbus, OH | 3.0 | 2.0 | 1161 | $1,500 | $1.29 | 43d | 1 | 0.07mi |
| 973 Exeter Rd Columbus, OH | 3.0 | 1.0 | 1054 | $1,710 | $1.62 | 43d | 1 | 0.10mi |
| 4661 Jae Ave Columbus, OH | 4.0 | 2.0 | 1230 | $1,799 | $1.46 | 21d | 1 | 0.55mi |
| 279 Little Flower Ln Columbus, OH | 3.0 | 1.0 | 1323 | $1,795 | $1.36 | 4d | 1 | 1.06mi |
| 1660 Huxley Dr Columbus, OH | 3.0 | 1.0 | 1248 | $1,695 | $1.36 | 7d | 1 | 1.06mi |
| 1537 Duffield Dr Columbus, OH | 3.0 | 2.0 | 1020 | $1,500 | $1.47 | 43d | 1 | 1.13mi |
| 4363 Chandler Dr Columbus, OH | 3.0 | 1.0 | 1328 | $1,830 | $1.38 | 23d | 1 | 1.20mi |
| 4472 Saint Ann Ln Columbus, OH | 3.0 | 1.0 | 1339 | $1,755 | $1.31 | 43d | 1 | 1.24mi |
| 381 S Yearling Rd Unit 381 Yearling Whitehall, OH | 3.0 | 1.0 | 850 | $1,095 | $1.29 | 23d | 1 | 1.30mi |
| 1843 Fleming Rd Unit 1 Columbus, OH | 3.0 | 1.5 | 1000 | $1,595 | $1.59 | 23d | 1 | 1.35mi |
| 4048 E Livingston Ave Columbus, OH | 3.0 | 1.0 | 961 | $1,000 | $1.04 | 20d | 1 | 1.44mi |
Listing history 18 events
-
2024-12-02status Pending
-
2022-09-14soldstatus $115,000
-
2022-09-01status Pending
-
2022-08-15$125,000 Active
-
2015-05-05soldstatus $55,900
-
2010-09-12soldstatus $35,000 136-char remark
Show marketing remark (136 chars)
Great Investor Opportunity. Priced Thousands below Appraised Value. Needs a little TLC. Call Today, Show Today. Subject to Bank Approval
-
2010-09-10historical 136-char remark
Show marketing remark (136 chars)
Great Investor Opportunity. Priced Thousands below Appraised Value. Needs a little TLC. Call Today, Show Today. Subject to Bank Approval
-
2010-01-15$35,000 136-char remark
Show marketing remark (136 chars)
Great Investor Opportunity. Priced Thousands below Appraised Value. Needs a little TLC. Call Today, Show Today. Subject to Bank Approval
-
2006-08-24historical
-
2006-07-26$91,900
-
2001-04-30soldstatus $66,000
-
2001-04-17historical
-
2000-11-01$75,900
-
1999-11-03soldstatus $58,900
-
1999-10-29soldstatus $58,900
-
1999-10-01historical
-
1999-08-13$59,900
-
1985-10-02soldstatus $26,000
ⓘ Source: listings_history table (triggers on properties + properties_extension) + one-shot
backfill from property_details.listing_events for pre-trigger history.
Tax reassessment forecast OH · Partial reset (capped growth)
- Current annual tax
- $2,211 · $184/mo
- Projected year-2 tax
- $2,211 · $184/mo
- Expected delta
- $0/yr ($0/mo · 0.0%)
ⓘ Screening estimate from a state-policy table — verify with the county assessor before closing.
Climate risk First Street
- Flood 3/10 Moderate FEMA zone X (unshaded) · 20% chance over 30 yrs
- Wildfire 1/10 Low
- Heat 3/10 Moderate 7 d/yr ≥99°F today · 18 d/yr by 30 yrs out
- Wind 2/10 Low 100% chance of damaging wind over 30 yrs
- Air quality 2/10 Low 1 unhealthy d/yr today · 3 by 30 yrs out
Nearby sold comps map
Loading sold comps map…
Walkable amenities ~0.75 mi
Loading nearby amenities…
Taxation est. · year 1
- Rental income
- $20,045
- − Mortgage interest
- −$7,002
- − Property taxes
- −$2,211
- − Insurance
- −$625
- − Repairs & maintenance
- −$1,604
- − Management
- −$1,604
- − Depreciation
- −$3,636
- Taxable income
- $3,363
- Est. tax owed @ 24.0%
- −$807
- After-tax cash flow
- $4,326/yr
For passive investors: Depreciation is non-cash, so a rental often shows a tax loss while cash-flowing — sheltering income. Rental losses are passive: they offset passive income freely, and up to $25,000/yr can offset ordinary (W-2) income if you actively participate and your MAGI is under $100k (phasing out to $0 by $150k); unused losses carry forward. On sale, claimed depreciation is recaptured at up to 25%, and gains may owe capital-gains tax (a 1031 exchange can defer both). Figures are a year-1 estimate at your 24.0% rate — not tax advice; consult a CPA.
Schools (NCES district)
- District
- Whitehall City
- NCES district ID
- 3904507
- Math proficiency
- 18% ▼ -17.00%
- Reading proficiency
- 33% ▼ -11.00%
- Median HH income
- $36,092
- Composite
- 21.08/100
- National rank
- #8442
- State rank
- #603 of 656 in OH
Livability — Whitehall
- Score
- 71/100
- State rank
- #399
- US rank
- #6587
Category grades
Schools grade is shown separately in the Schools card above.
Census & demographics
- Census place
- Whitehall, OH
- County
- Franklin County · 1,351,780 people
- City population
- 36,273
- Metro
- Columbus, OH
- Population (ZIP)
- 36,273
- Household income
- $54,704
- Rent vs Own
- Severe rent burden
- 2583.0
Population outlook (Franklin County) Hauer SSP2
- Today (2025)
- 1,456,139 people
- By 2030
- 1,556,890 · +6.9%
- By 2040
- 1,757,349 · +20.7%
- By 2050
- 1,950,539 · +34.0%
- By 2075
- 2,376,171 · +63.2%
- By 2100
- 2,636,796 · +81.1%
Race, ethnicity, and origin ACS 2023
- Neighborhood character
- Diverse neighborhood (Simpson 0.66)
- Race & ethnicity
- Black 45% White 36% Hispanic / Latino 10% Two or more races 9% Asian 3%
- Hispanic origin (detail)
- Mexican 4% Puerto Rican 2%
- Common ancestry
- Romanian 2% Slovak 1% Lithuanian 1%
- Foreign-born
- 15% · Canada, China
- Languages at home
- 79% English-only · Spanish 8% Other Indo-European 1% French/Haitian/Cajun 1%
Political lean MEDSL · Franklin
- 2024 margin
- Strong D (+28.4) · D 63.7% · R 35.3% · Other 1.0%
- 2008→2024 swing
- +7.7pp toward D · 2008: 20.7pp · 2024: 28.4pp
- All cycles
- 2024: D+28.4 2020: D+31.4 2016: D+25.9 2012: D+21.7 2008: D+20.7
Not yet ingested
- Civics
- —
Market trends
- HPI YoY
- ▼ -243.35%
- Current HPI
- 198.5072
- Rent YoY
- ▲ 2.29%
- Metro
- Columbus, OH
- State GDP YoY
- ▲ 1.98%
- F500 in state
- 48
Industry mix (Fortune 500 HQ in OH)
| Industry | F500 HQs | Revenue |
|---|---|---|
| Insurance | 3 | $145B |
|
||
| Industrial Machinery | 3 | $49B |
|
||
| Financial Services | 3 | $24B |
|
||
| Consumer Goods | 2 | $93B |
|
||
| Aerospace / Defense | 2 | $47B |
|
||
| Utilities | 2 | $33B |
|
||
Price history
+342.3% since first listed18 events — show timeline
- 2024-12-02 Pending — CBRMLS
- 2022-09-14 Sold (Public Records) $115,000 Public Records
- 2022-09-01 Pending — CBRMLS
- 2022-08-15 Listed $125,000 CBRMLS
- 2015-05-05 Sold (Public Records) $55,900 Public Records
- 2010-09-12 Sold (MLS) $35,000 CBRMLS
- 2010-09-10 Listing Removed — CBRMLS
- 2010-01-15 Listed $35,000 CBRMLS
- 2006-08-24 Listing Removed — CBRMLS
- 2006-07-26 Listed $91,900 CBRMLS
- 2001-04-30 Sold (MLS) $66,000 CBRMLS
- 2001-04-17 Listing Removed — CBRMLS
- 2000-11-01 Listed $75,900 CBRMLS
- 1999-11-03 Sold (Public Records) $58,900 Public Records
- 1999-10-29 Sold (MLS) $58,900 CBRMLS
- 1999-10-01 Listing Removed — CBRMLS
- 1999-08-13 Listed $59,900 CBRMLS
- 1985-10-02 Sold (Public Records) $26,000 Public Records
Property tax history
-2.1%/yrLatest (2024): $2,211 · -0.7% YoY. Source: county tax records.
Cash-flow waterfall
monthlySold comps — $/sqft
last 12 mo · ≤1 miLoading sold comps…