 6-Plex
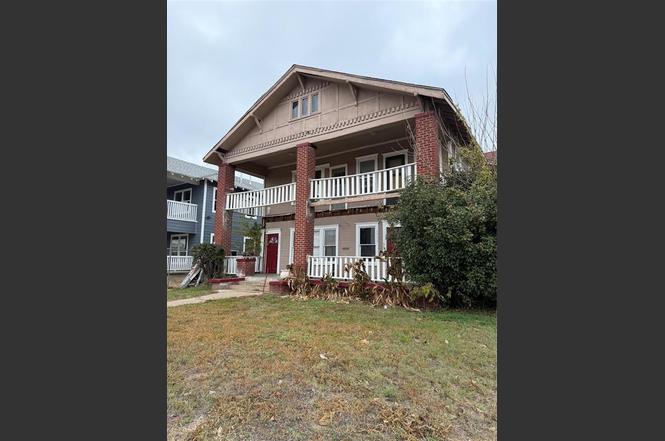
3528 Colonial Ave · Dallas, TX
Flood risk 1/10 · Minimal
- FEMA flood zone
- X (unshaded)
- Chance of flooding over 30 yrs
- 0.0%
- Est. flood insurance / yr
- $507 – $1,088
Fire risk 1/10 · Minimal
- Est. fire insurance / yr
- $1,222 – $2,270
Heat risk 7/10 · Major
- Hot days now (above 109°F)
- 7 days/yr
- Hot days in 30 yrs
- 24 days/yr
Wind risk 6/10 · Moderate
- Chance of severe wind over 30 yrs
- 27.0%
Air-quality risk 3/10 · Minor
- Unhealthy air days now
- 2 days/yr
- Unhealthy air days in 30 yrs
- 3 days/yr
Risk factors via First Street. Map © Google.
Why this score? — see what drove the B+ grade
The composite is a weighted blend of 9 inputs, each scored 0–100. Each bar is that input's sub-score; the figure is the points it added to the 100-point composite (weight × sub-score).
- Cash flow +30.0/30.0
- 1% rule +10.0/10.0
- DSCR +10.0/10.0
- ARV discount +7.5/15.0
- Appreciation +5.4/10.0
- Rent growth +4.3/5.0
- Livability +4.0/5.0
- Schools +2.8/10.0
- Condition / age +2.5/5.0
$225,000
🖨 Deal sheet (PDF) 📄 Offer letter ✓ Due diligence
Multi-family units
County records classify this as Multi-Family (2-4 Unit). Listing-text estimate: 6 units. estimate disagrees with records
Listing remarks
Value add opportunity for a 17 room-5 bath boarding house with lots of potential. Bring your vision, plans, and renovation ideas. Seconds off of I-45 close to Farmer's Market and Deep Ellum, just around the corner from the new Forest Theatre corridor with all new development of schools, retail, and restaurants surrounding the theater, St. Phillips, & Cornerstone. With the recently renovated Cesar Chavez Blvd (previously 175), South Dallas residents now have easy access to Downtown, Farmer's Market, the Cedars, Deep Ellum & Uptown Dallas. The entire landscape of the area is changing--don't miss the opportunity to invest now!
Key facts
- Cesar chavez blvd
- Farmer's market
- Deep ellum
Tags
Property features AI
Finance
- Other: Corner parcel (approx. 0.111 acres); Total building area reported as 3252 (source: public records); Special listing conditions: third party approval; Possession at closing/funding
- Financial info: Listed for cash or conventional financing; No reported gross income or expenses for multi-unit; No capitalization rate reported
- HOA & community: No association; Community park
Exterior
- Parking: 2 parking spaces; Driveway; Off-street parking; On-street parking; Paved parking; No garage or carport
- Security: Security features: unknown; Audio and video surveillance consent noted
- Utilities: City water; City sewer; Not in a municipal utility district
- Home design: Residential income property; Multi-family; Two-story
- Construction: Built in 1916; Brick and wood construction; Composition roof; Pillar/post/pier foundation
- Exterior features: Covered porch(es); Covered front porch; Corner lot; Park nearby
Interior
- Kitchen: Electric range
- Bedrooms: 17 total bedrooms
- Flooring: Tile flooring; Wood flooring
- Bathrooms: 5 full bathrooms
- Heating & cooling: Electric heating; Ceiling fan(s); Window unit(s)
- Interior features: Cable TV available; High-speed internet available; Two levels
Neighborhood map
What this means for you Summary
Snapshot
- This is a 6 × 1-bed/?-bath units multifamily listed at $225k.
Deal economics
- At list price, monthly cash flow is $4k ($49k/yr) — positive. Per door: $686/mo.
- The deal already cash-flows at list — no discount required.
- Meets the 1% rule at list price ($7k rent vs $225k).
- Recommended offer: $198k (12.0% below list) — sets the bar for market timing.
- Cap rate 28.2% vs local median 2.3% in Dallas — top-decile yield for the area; either an underpriced asset or a hidden risk that comps aren't pricing in. Stress-test before assuming the spread holds.
Location & tenants
- Location reads 81/100 on livability (#24 in TX, #1,380 nationally) — a professional / high-income tenant draw. Strengths: amenities A+, commute A+, housing A+; Watch: crime F.
- Dallas ISD (urban): math 31% / reading 36% proficiency, ranked #559 of 826 in TX (top 68%) — families likely to look elsewhere, expect single-tenant / working-renter base with shorter leases; 83% free/reduced lunch — lower-income household profile, screen leases tightly.
- Zoned schools: Paul L Dunbar Learning Center (math 27% / reading 22%, grade F, #3,052 of 4,322 statewide, top 74%, 531 students, 95% FRL); Billy Earl Dade Middle (math 18% / reading 23%, grade F, #1,407 of 1,662 statewide, top 86%, 636 students, 100% FRL); James Madison H S (math 17% / reading 17%, grade F, #1,491 of 1,632 statewide, top 92%, 359 students, 96% FRL).
- Zoned-school proficiency averages 21% at this address vs 34% district-wide (-13 pts) — the specific schools serving this property underperform the Dallas ISD average; the district grade overstates school quality for this exact location.
- Market conditions: Rents rising fast (+7.2%/yr); 247 active listings in the ZIP; 5 comparable units currently listed for rent nearby; rentals leasing fast (median 13d on market — plan ~1-2 weeks tenant-placement turnaround); 40% of comp listings sitting > 30 days — soft ceiling on asking rent; 12,577 units permitted in Dallas County in 2024 (6,829 in 5+ unit buildings).
Forward outlook
- In year one you build about $3k of equity ($2k loan paydown + $2k appreciation (0.8% local appreciation)).
- Dallas County population projected at +35% by 2050 — long-run rental-demand tailwind backs the buy-and-hold thesis.
- At projected returns (0.8% appreciation + 7.2% rent growth), your $63k cash investment doubles in ~2 years — after that, you're playing with house money.
- By year 9, paydown + projected appreciation supports a ~$32k cash-out refi (75% LTV) — recoverable capital for the next deal without selling this one.
Negotiation context
- It's been on market 144 days — a 12% lower offer ($198k) is reasonable based on typical stale-listing flexibility.
Risks & watch-outs
- Watch-outs: property tax is 2.8% of price; built in 1916 — expect roof / HVAC / electrical / plumbing capex.
- Climate carrying-cost: major wind risk, 27% chance of damaging wind over 30y; extreme-heat days projected 7→24/yr by 2055 (HVAC capex compounding) — expect insurance premiums to compound above CPI over the hold.
Questions for the listing agent
- It's been on market 144 days. Have you received any prior offers? Is the seller open to a 12% concession, seller financing, or rate buy-down credit?
- Can we see the unit-by-unit rent roll, current vacancy, and any below-market leases? What's the average tenancy length?
- What capital expenditures (roof, boiler, parking lot, exteriors) have been made in the last 5 years, and what's planned in the next 2?
- Built in 1916 — when were the roof, HVAC, electrical panel, plumbing, and water heater last replaced?
- Property tax is high relative to price — has the assessment been appealed recently, and will the sale trigger a re-assessment?
- Why hasn't it sold? Are there any deal-killer items the seller is aware of (foundation, flood, title, zoning, code violations)?
- Is there a deadline driving the sale (1031 exchange, divorce, estate, relocation)? That informs how much negotiation room exists.
- Crime grade is F in this area — have there been break-ins, vandalism, or insurance claims at this property in the last 3 years? What carrier currently insures it and at what premium?
- What's the average days-on-market for RENTAL listings here right now (not sales)? A rising rental-DOM trend means longer vacancies and softer asking-rent achievability than the comps imply.
- What's the recent tenant-quality profile in this submarket — average credit score on applications, eviction rate, late-payment / NSF rate, and stable-employment percentage? A property-management company in the area should have these aggregated.
- How much new apartment / multifamily construction is in the pipeline within 1–3 miles? Heavy new supply (>2% of stock underway) typically softens rents 12–24 months out; light construction supports rent growth.
Investment metrics
- 1% rule
- 3.32% ✓
- Cap rate
- 28.23%
- Cash-on-cash
- 78.36%
- DSCR
- 4.49
- GRM
- 2.5
CMA / ARV
No comps found within radius.
Projected returns pro-forma
0.79% appreciation · 7.19% rent growth · sell at horizon
- IRR
- 85.8%
- Equity multiple
- 5.71×
- Total profit
- $297,025
- Equity at exit
- $74,353
- IRR
- 87.9%
- Equity multiple
- 13.44×
- Total profit
- $783,550
- Equity at exit
- $96,935
Cash invested: $63,000 (down + closing). Projections, not guarantees.
Landlord ↔ Tenant lean methodology
- Overall (STATE)
- 87 Strongly Landlord-Friendly
- State Texas
- 87 Strongly Landlord-Friendly · R+5
- County
- — inherits STATE
- City
- — inherits STATE
ZIP-level market 75215
- Home prices YoY
- 0.3%
- Rents YoY
- 7.2%
- Active inventory
- 247
- Price-to-rent
- 15.0×
Monthly cashflow live
- Estimated rent
- $7,480 high interval (Pro) →
- Mortgage (P&I)
- −$1,180
- Tax from tax record
- −$522 /mo · $6,262/yr
- Insurance
- −$94
- HOA
- −$0
- Vacancy / Maint / Mgmt
- −$1,571
- Net cashflow
- $4,114
Break-even live
Sensitivity live
| Price | -10% $4,241 | -5% $4,177 | +0% $4,114 | +5% $4,050 | +10% $3,986 |
|---|---|---|---|---|---|
| Rent | -10% $3,523 | -5% $3,818 | +0% $4,114 | +5% $4,409 | +10% $4,705 |
| Rate | -1.0pp $4,227 | -0.5pp $4,171 | base $4,114 | +0.5pp $4,055 | +1.0pp $3,996 |
6-unit breakdown (identical units grouped — click to expand)
| Units | Beds | Baths | Est. rent |
|---|---|---|---|
| 6× units | 1 | — | $7,482 |
| #1 | 1 | — | $1,247 |
| #2 | 1 | — | $1,247 |
| #3 | 1 | — | $1,247 |
| #4 | 1 | — | $1,247 |
| #5 | 1 | — | $1,247 |
| #6 | 1 | — | $1,247 |
| Total (6 units) | $7,480 | ||
UW: 25.0% down · 7.5% · 30yr · 1.5% tax · 5.0% vac · 8.0% maint · 8.0% mgmt
Financing live
Cash to close
- Down payment
- $56,250
- Closing costs
- $6,750
- Reserves months
- —
- Total cash needed
- —
Loan-product check · same deal, 3 products live
Conventional
25% down · 7.5% · 30yr
- Down + closing
- —
- Monthly P&I
- —
- Monthly cashflow
- —
- DSCR
- —
- Eligible?
- —
Personal DTI + credit; lowest rate.
DSCR
20% down · 8.5% · 30yr
- Down + closing
- —
- Monthly P&I
- —
- Monthly cashflow
- —
- DSCR
- —
- Eligible?
- —
No personal income docs; deal must DSCR.
Hard money
10% down · 12.0% · 12mo
- Down + closing
- —
- Monthly P&I
- —
- Monthly cashflow
- —
- DSCR
- —
- Eligible?
- —
Short-term bridge; refi at stabilization.
Rent comps 5 comps
| Address | Beds | Baths | Sqft | Rent | $/sqft | DOM | Units | Dist |
|---|---|---|---|---|---|---|---|---|
| 1805 Browder St Unit 1019612P Dallas, TX | 3.0 | 3.5 | 2357 | $6,844 | $2.90 | 0d | 1 | 1.22mi |
| 1805 Browder St #103 Dallas, TX | 3.0 | 3.5 | 2358 | $8,000 | $3.39 | 45d | 1 | 1.22mi |
| 1874 Beaumont St Dallas, TX | 4.0 | 5.0 | 2578 | $4,900 | $1.90 | 45d | 1 | 1.25mi |
| 512 Avenue L Dallas, TX | 3.0 | 4.0 | 2551 | $3,400 | $1.33 | 9d | 1 | 1.33mi |
| 2216 Dyson St Dallas, TX | 3.0 | 2.0 | 2500 | $2,000 | $0.80 | 12d | 1 | 1.42mi |
Listing history 13 events
-
2026-06-21days on market $225,000 Active 144 DOM
-
2026-06-18days on market $225,000 Active 141 DOM
-
2026-06-17days on market $225,000 Active 140 DOM
-
2026-06-16days on market $225,000 Active 139 DOM
-
2026-06-15days on market $225,000 Active 138 DOM
-
2026-06-13days on market $225,000 Active 136 DOM
-
2026-06-09days on market $225,000 Active 132 DOM
-
2026-06-08days on market $225,000 Active 131 DOM
-
2026-06-07statusdays on market $225,000 Active 130 DOM
-
2026-05-18status Pending
-
2026-04-13historical Active Option Contract
-
2026-01-10$225,000 Active
-
2025-01-24soldstatus
ⓘ Source: listings_history table (triggers on properties + properties_extension) + one-shot
backfill from property_details.listing_events for pre-trigger history.
Tax reassessment forecast TX · Resets to sale price
- Current annual tax
- $6,262 · $522/mo
- Projected year-2 tax
- $6,262 · $522/mo
- Expected delta
- $0/yr ($0/mo · 0.0%)
ⓘ Screening estimate from a state-policy table — verify with the county assessor before closing.
Climate risk First Street
- Flood 1/10 Low FEMA zone X (unshaded) · 0% chance over 30 yrs
- Wildfire 1/10 Low
- Heat 7/10 Severe 7 d/yr ≥109°F today · 24 d/yr by 30 yrs out
- Wind 6/10 Major 27% chance of damaging wind over 30 yrs
- Air quality 3/10 Moderate 2 unhealthy d/yr today · 3 by 30 yrs out
Nearby sold comps map
Loading sold comps map…
Walkable amenities ~0.75 mi
Loading nearby amenities…
Taxation est. · year 1
- Rental income
- $89,760
- − Mortgage interest
- −$12,603
- − Property taxes
- −$6,262
- − Insurance
- −$1,125
- − Repairs & maintenance
- −$7,181
- − Management
- −$7,181
- − Depreciation
- −$6,545
- Taxable income
- $48,863
- Est. tax owed @ 24.0%
- −$11,727
- After-tax cash flow
- $37,638/yr
For passive investors: Depreciation is non-cash, so a rental often shows a tax loss while cash-flowing — sheltering income. Rental losses are passive: they offset passive income freely, and up to $25,000/yr can offset ordinary (W-2) income if you actively participate and your MAGI is under $100k (phasing out to $0 by $150k); unused losses carry forward. On sale, claimed depreciation is recaptured at up to 25%, and gains may owe capital-gains tax (a 1031 exchange can defer both). Figures are a year-1 estimate at your 24.0% rate — not tax advice; consult a CPA.
Schools (NCES district)
- District
- Dallas ISD
- NCES district ID
- 4816230
- Math proficiency
- 31% ▼ -16.00%
- Reading proficiency
- 36% ▼ -4.00%
- Median HH income
- $42,881
- Composite
- 28.41/100
- National rank
- #6763
- State rank
- #559 of 826 in TX
Livability — Dallas
- Score
- 81/100
- State rank
- #24
- US rank
- #1380
Category grades
Schools grade is shown separately in the Schools card above.
Census & demographics
- Census place
- Dallas, TX
- County
- Dallas County · 2,612,404 people
- City population
- 1,168,437
- Metro
- Dallas-Fort Worth-Arlington, TX
- Population (ZIP)
- 18,895
- Household income
- $45,557
- Rent vs Own
- Severe rent burden
- 1464.0
Population outlook (Dallas County) Hauer SSP2
- Today (2025)
- 2,979,839 people
- By 2030
- 3,191,823 · +7.1%
- By 2040
- 3,619,611 · +21.5%
- By 2050
- 4,026,915 · +35.1%
- By 2075
- 4,957,073 · +66.4%
- By 2100
- 5,508,725 · +84.9%
Race, ethnicity, and origin ACS 2023
- Neighborhood character
- Diverse neighborhood (Simpson 0.58)
- Race & ethnicity
- Black 59% Hispanic / Latino 25% White 11% Two or more races 10%
- Hispanic origin (detail)
- Mexican 21%
- Common ancestry
- Italian 1% Hispanic 1%
- Foreign-born
- 16% · Canada
- Languages at home
- 74% English-only · Spanish 26%
Political lean MEDSL · Dallas
- 2024 margin
- Strong D (+22.2) · D 60.2% · R 38.0% · Other 1.8%
- 2008→2024 swing
- +6.9pp toward D · 2008: 15.3pp · 2024: 22.2pp
- All cycles
- 2024: D+22.2 2020: D+31.6 2016: D+26.2 2012: D+15.4 2008: D+15.3
Not yet ingested
- Civics
- —
Market trends
- HPI YoY
- ▲ 0.79%
- Current HPI
- 224.2955
- Rent YoY
- ▲ 7.19%
- Metro
- Dallas-Fort Worth-Arlington, TX
- State GDP YoY
- ▲ 3.95%
- F500 in state
- 110
Industry mix (Fortune 500 HQ in TX)
| Industry | F500 HQs | Revenue |
|---|---|---|
| Energy | 16 | $1,198B |
|
||
| Technology | 5 | $198B |
|
||
| Engineering / Construction | 4 | $72B |
|
||
| Energy Services | 3 | $60B |
|
||
| Utilities | 3 | $41B |
|
||
| Healthcare | 2 | $330B |
|
||
Price history
4 events — show timeline
- 2026-05-18 Pending — NTREIS
- 2026-04-13 Contingent — NTREIS
- 2026-01-10 Listed $225,000 NTREIS
- 2025-01-24 Sold (Public Records) — Public Records
Property tax history
+13.0%/yrLatest (2025): $6,262 · +44.7% YoY. Source: county tax records.
Cash-flow waterfall
monthlySold comps — $/sqft
last 12 mo · ≤1 miLoading sold comps…