1622 Market St · Harrisburg, PA
Flood risk 1/10 · Minimal
- FEMA flood zone
- X (unshaded)
- Chance of flooding over 30 yrs
- 0.0%
- Est. flood insurance / yr
- $473 – $860
Fire risk 1/10 · Minimal
- Est. fire insurance / yr
- $511 – $949
Heat risk 5/10 · Moderate
- Hot days now (above 100°F)
- 7 days/yr
- Hot days in 30 yrs
- 15 days/yr
Wind risk 3/10 · Minor
- Chance of severe wind over 30 yrs
- 6.0%
Air-quality risk 2/10 · Minimal
- Unhealthy air days now
- 1 days/yr
- Unhealthy air days in 30 yrs
- 3 days/yr
Risk factors via First Street. Map © Google.
Why this score? — see what drove the D- grade
The composite is a weighted blend of 9 inputs, each scored 0–100. Each bar is that input's sub-score; the figure is the points it added to the 100-point composite (weight × sub-score).
- Cash flow +14.9/30.0
- Rent growth +4.8/5.0
- DSCR +4.6/10.0
- 1% rule +4.5/10.0
- Livability +4.2/5.0
- Condition / age +2.5/5.0
- Schools +0.8/10.0
- ARV discount +0.0/15.0
- Appreciation +0.0/10.0
$194,900
🖨 Deal sheet (PDF) 📄 Offer letter ✓ Due diligence
Listing remarks MLS
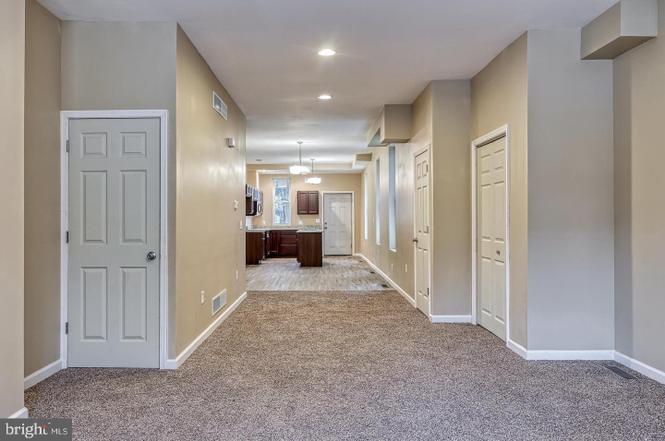
Completely remodeled 4/5BR & 2.5BA home in the heart of Harrisburg, just minutes to downtown. Why rent when you can own for less in most cases. Hurry, schedule your showing today, this home should sell fast.
Key facts
- Newer roof
- Flexible layout
- Hvac system
Tags
Property features AI
Finance
- Other: Above-grade finished area approximately 2,207 (per assessor); Year built source: estimated; Irrigation water rights noted
Exterior
- Parking: Other parking type
- Utilities: Public water; Public septic; Natural gas hot water; 200+ amp electric service; DSL internet available
- Home design: Interior townhouse/rowhouse; Fee simple ownership; Effective renovation in 2022 (major remodel)
- Construction: Brick construction; Concrete perimeter foundation; Roof condition unknown; Basement present and unfinished
- Exterior features: Not located in a federal flood zone; Two or more access/egress points; Pets allowed with no restrictions; Above-grade and below-grade structures
Interior
- Kitchen: Microwave; Stainless steel appliances
- Bedrooms: Five bedrooms on the main level
- Flooring: Carpet; Laminate
- Bathrooms: Two full bathrooms; One half bathroom
- Heating & cooling: Forced air heating (natural gas); Central air conditioning (electric)
- Interior features: Combination kitchen and dining area; Family room adjacent to the kitchen; Soaking tub; Drywall walls and ceilings; Unfurnished
- Laundry & utility: Washer/dryer hookups
Neighborhood map
What this means for you Summary
Snapshot
- This is a 5-bed/2.5-bath townhouse listed at $195k.
Deal economics
- At list price, monthly cash flow is $58 ($693/yr) — positive.
- The deal already cash-flows at list — no discount required.
- To meet the 1% rule (rent ≥ 1% of price), the offer needs to be $185k (5.3% below list).
- Recommended offer: $185k (5.3% below list) — sets the bar for 1% rule.
Location & tenants
- Location reads 84/100 on livability (#107 in PA, #826 nationally) — a professional / high-income tenant draw. Strengths: amenities A+, commute A+, cost of living A+; Watch: employment D, crime F.
- Harrisburg City SD (urban): math 6% / reading 13% proficiency, ranked #535 of 539 in PA (top 99%) — low school quality limits family demand, transient renter base, plan for 1-2y turnover; 82% free/reduced lunch — lower-income household profile, screen leases tightly.
- Zoned schools: Benjamin Franklin Sch (math 3% / reading 10%, grade F, #1,492 of 1,518 statewide, top 98%, 786 students, 100% FRL); Camp Curtin Academy (math 0% / reading 5%, grade F, #512 of 512 statewide, top 100%, 482 students, 100% FRL); Harrisburg Hs (math 24% / reading 10%, grade F, #399 of 437 statewide, top 92%, 1,230 students, 100% FRL) — zoned schools average 100% FRL vs 82% district-wide (18 pts higher); higher-poverty schools than district average — tighter screening recommended.
- Market conditions: Rents rising fast (+9.1%/yr); 68 active listings in the ZIP; 15 comparable units currently listed for rent nearby; rentals at typical pace (median 25d on market — plan ~3-4 weeks tenant-placement turnaround); 40% of comp listings sitting > 30 days — soft ceiling on asking rent; lower-income renter base — watch delinquency; 540 units permitted in Dauphin County in 2024 (194 in 5+ unit buildings).
- At $1,846/mo this rent would consume 56% of the median local household income ($40k/yr) (locally 1014% of renters already pay >50% of income on rent) — very limited rent-growth headroom before tenants either downsize or default.
Forward outlook
- Local home prices are declining (-3.0%/yr); year-one equity from $1k of loan paydown is wiped out by about $6k of value loss. Plan a longer hold.
Negotiation context
- Only 7 days on market — expect competitive offers; lowballing is unlikely to land.
- 3 sale attempts since 5y ago with the ask held roughly flat each time — persistent listings suggest the price (not the market) is what's stuck; bring a comps-based counter.
- Current owner paid $145k; 34% above their basis — modest negotiation headroom, anchor on the comps not their cost.
Risks & watch-outs
- Watch-outs: built in 1930 — expect roof / HVAC / electrical / plumbing capex.
- Climate carrying-cost: extreme-heat days projected 7→15/yr by 2055 (HVAC capex compounding) — expect insurance premiums to compound above CPI over the hold.
Questions for the listing agent
- Built in 1930 — when were the roof, HVAC, electrical panel, plumbing, and water heater last replaced?
- Is there a deadline driving the sale (1031 exchange, divorce, estate, relocation)? That informs how much negotiation room exists.
- Crime grade is F in this area — have there been break-ins, vandalism, or insurance claims at this property in the last 3 years? What carrier currently insures it and at what premium?
- The area grade is low — what's the realistic commute time and amenity access for the typical tenant pool here? Any planned neighborhood developments (good or bad) we should know about?
- What's the average days-on-market for RENTAL listings here right now (not sales)? A rising rental-DOM trend means longer vacancies and softer asking-rent achievability than the comps imply.
- What's the recent tenant-quality profile in this submarket — average credit score on applications, eviction rate, late-payment / NSF rate, and stable-employment percentage? A property-management company in the area should have these aggregated.
- How much new for-sale + rental construction is in the pipeline within 1–3 miles? Heavy new supply typically softens prices + rents 12–24 months out; constrained supply supports both.
Investment metrics
- 1% rule
- 0.95% ✗
- Cap rate
- 6.65%
- Cash-on-cash
- 1.27%
- DSCR
- 1.06
- GRM
- 8.8
CMA / ARV
- ARV (on-the-fly)
- $163,628
- Comps found
- 12
Show comp detail 12 sales within ~0.75 mi
| Address | Dist | Beds/Ba | Sqft | Sold | Price | $/sf | Match |
|---|---|---|---|---|---|---|---|
| 22 S 17th St | 0.07mi | 4/2.0 (-1) | 2,137 (-1%) | 2mo | $150,000 | $70 | 87 |
| 1641 Market St | 0.04mi | 5/1.0 | 2,316 (+8%) | 3mo | $150,000 | $65 | 77 |
| 208 N 15th St | 0.24mi | 5/1.0 | 2,080 (-3%) | 5mo | $80,001 | $38 | 73 |
| 1820 Regina St | 0.21mi | 5/1.5 | 1,920 (-11%) | 5mo | $175,000 | $91 | 64 |
| 1209 Market St | 0.34mi | 5/1.5 | 1,902 (-12%) | 1mo | $145,000 | $76 | 60 |
| 434 S 13th St | 0.56mi | 5/1.0 | 2,055 (-5%) | 2mo | $106,000 | $52 | 58 |
| 1958 Bellevue Rd | 0.37mi | 5/1.0 | 1,935 (-10%) | 3mo | $175,000 | $90 | 57 |
| 1204 N 16th St | 0.67mi | 6/— (+1) | 2,246 (+4%) | 1mo | $177,000 | $79 | 56 |
| 447 S 14th St | 0.53mi | 5/1.0 | 1,968 (-9%) | 2mo | $115,000 | $58 | 53 |
| 2012 Derry St | 0.70mi | 4/1.0 (-1) | 2,193 (+2%) | 5mo | $170,000 | $78 | 49 |
| 343 Crescent St | 0.54mi | 4/3.5 (-1) | 1,905 (-12%) | 6mo | $140,000 | $73 | 42 |
| 1719 Cumberland St | 0.65mi | 4/2.0 (-1) | 1,909 (-11%) | 3mo | $199,900 | $105 | 41 |
Match score weights: distance 35% · size 25% · config 20% · recency 20%. Top-matched comps best support the ARV.
Projected returns pro-forma
-3.0% appreciation · 8.0% rent growth · sell at horizon
- IRR
- -8.6%
- Equity multiple
- 0.67×
- Total profit
- $-18,087
- Equity at exit
- $29,060
- IRR
- 6.7%
- Equity multiple
- 1.62×
- Total profit
- $33,643
- Equity at exit
- $16,851
Cash invested: $54,572 (down + closing). Projections, not guarantees.
Landlord ↔ Tenant lean methodology
- Overall (STATE)
- 62 Landlord-Friendly
- State Pennsylvania
- 62 Landlord-Friendly · EVEN
- County
- — inherits STATE
- City
- — inherits STATE
ZIP-level market 17103
- Rents YoY
- 9.1%
- Active inventory
- 68
- Price-to-rent
- 8.8×
Monthly cashflow live
- Estimated rent
- $1,846 high interval (Pro) →
- Mortgage (P&I)
- −$1,022
- Tax from tax record
- −$298 /mo · $3,572/yr
- Insurance
- −$81
- HOA
- −$0
- Vacancy / Maint / Mgmt
- −$388
- Net cashflow
- $58
Break-even live
Sensitivity live
| Price | -10% $168 | -5% $113 | +0% $58 | +5% $3 | +10% $-53 |
|---|---|---|---|---|---|
| Rent | -10% $-88 | -5% $-15 | +0% $58 | +5% $131 | +10% $204 |
| Rate | -1.0pp $156 | -0.5pp $107 | base $58 | +0.5pp $7 | +1.0pp $-44 |
UW: 25.0% down · 7.5% · 30yr · 1.5% tax · 5.0% vac · 8.0% maint · 8.0% mgmt
Financing live
Cash to close
- Down payment
- $48,725
- Closing costs
- $5,847
- Reserves months
- —
- Total cash needed
- —
Loan-product check · same deal, 3 products live
Conventional
25% down · 7.5% · 30yr
- Down + closing
- —
- Monthly P&I
- —
- Monthly cashflow
- —
- DSCR
- —
- Eligible?
- —
Personal DTI + credit; lowest rate.
DSCR
20% down · 8.5% · 30yr
- Down + closing
- —
- Monthly P&I
- —
- Monthly cashflow
- —
- DSCR
- —
- Eligible?
- —
No personal income docs; deal must DSCR.
Hard money
10% down · 12.0% · 12mo
- Down + closing
- —
- Monthly P&I
- —
- Monthly cashflow
- —
- DSCR
- —
- Eligible?
- —
Short-term bridge; refi at stabilization.
Rent comps 15 comps
| Address | Beds | Baths | Sqft | Rent | $/sqft | DOM | Units | Dist |
|---|---|---|---|---|---|---|---|---|
| 14 S 17th St Harrisburg, PA | 5.0 | 2.0 | 2136 | $1,695 | $0.79 | 15d | 1 | 0.07mi |
| 66 N 17th St Harrisburg, PA | 5.0 | 2.0 | 1845 | $2,195 | $1.19 | 45d | 1 | 0.15mi |
| 111 N 17th St Harrisburg, PA | 5.0 | 1.0 | 1800 | $1,850 | $1.03 | 15d | 1 | 0.26mi |
| 1207 Market St Harrisburg, PA | 4.0 | 1.5 | 1423 | $1,995 | $1.40 | 45d | 1 | 0.32mi |
| 1708 State St Harrisburg, PA | 5.0 | 1.5 | 2320 | $1,745 | $0.75 | 23d | 1 | 0.34mi |
| 227 Hummel St Harrisburg, PA | 5.0 | 2.0 | 2696 | $1,600 | $0.59 | 45d | 1 | 0.39mi |
| 1610 Hunter St Harrisburg, PA | 4.0 | 1.0 | 1776 | $1,450 | $0.82 | 25d | 1 | 0.45mi |
| 1414 Berryhill St Harrisburg, PA | 5.0 | 2.0 | 1786 | $1,700 | $0.95 | 25d | 1 | 0.50mi |
| 301 Chestnut St Harrisburg, PA | 4.0 | 1.0–2.5 | 1437 | $3,000 | $2.09 | 15d | 10 | 0.83mi |
| 301 Chestnut St Harrisburg, PA | 1.0–4.0 | 1.0–2.5 | 1437 | $2,600 | $1.81 | 45d | 1 | 0.83mi |
| 2368 Canby St Harrisburg, PA | 6.0 | 2.0 | 2142 | $2,300 | $1.07 | 23d | 1 | 1.06mi |
| 1202 Penn St Harrisburg, PA | 4.0 | 1.0 | 1706 | $1,495 | $0.88 | 45d | 1 | 1.30mi |
| 1330 Susquehanna St Harrisburg, PA | 4.0 | 1.5 | 2280 | $1,895 | $0.83 | 25d | 1 | 1.30mi |
| 1716 N 6th St Unit NA Harrisburg, PA | 4.0 | 4.0 | 2400 | $2,000 | $0.83 | 25d | 1 | 1.34mi |
| 1716 N 6th St Harrisburg, PA | 4.0 | 3.5 | 2400 | $2,200 | $0.92 | 45d | 1 | 1.34mi |
Listing history 6 events
-
2026-06-21days on market $194,900 Active 7 DOM
-
2026-06-18days on market $194,900 Active 4 DOM
-
2026-06-17days on market $194,900 Active 3 DOM
-
2026-06-16days on market $194,900 Active 2 DOM
-
2026-06-15remarks 649-char remark
-
2026-06-15$194,900 Active 1 DOM
ⓘ Source: listings_history table (triggers on properties + properties_extension) + one-shot
backfill from property_details.listing_events for pre-trigger history.
Tax reassessment forecast PA · Partial reset (capped growth)
- Current annual tax
- $3,572 · $298/mo
- Projected year-2 tax
- $3,572 · $298/mo
- Expected delta
- $0/yr ($0/mo · 0.0%)
ⓘ Screening estimate from a state-policy table — verify with the county assessor before closing.
Climate risk First Street
- Flood 1/10 Low FEMA zone X (unshaded) · 0% chance over 30 yrs
- Wildfire 1/10 Low
- Heat 5/10 Major 7 d/yr ≥100°F today · 15 d/yr by 30 yrs out
- Wind 3/10 Moderate 6% chance of damaging wind over 30 yrs
- Air quality 2/10 Low 1 unhealthy d/yr today · 3 by 30 yrs out
Nearby sold comps map
Loading sold comps map…
Walkable amenities ~0.75 mi
Loading nearby amenities…
Taxation est. · year 1
- Rental income
- $22,157
- − Mortgage interest
- −$10,917
- − Property taxes
- −$3,572
- − Insurance
- −$974
- − Repairs & maintenance
- −$1,773
- − Management
- −$1,773
- − Depreciation
- −$5,670
- Taxable loss
- −$2,522
- Est. tax savings @ 24.0%
- +$605
- After-tax cash flow
- $1,298/yr
For passive investors: Depreciation is non-cash, so a rental often shows a tax loss while cash-flowing — sheltering income. Rental losses are passive: they offset passive income freely, and up to $25,000/yr can offset ordinary (W-2) income if you actively participate and your MAGI is under $100k (phasing out to $0 by $150k); unused losses carry forward. On sale, claimed depreciation is recaptured at up to 25%, and gains may owe capital-gains tax (a 1031 exchange can defer both). Figures are a year-1 estimate at your 24.0% rate — not tax advice; consult a CPA.
Schools (NCES district)
- District
- Harrisburg City SD
- NCES district ID
- 4211580
- Math proficiency
- 6% ▼ -6.00%
- Reading proficiency
- 13% ▼ -10.00%
- Median HH income
- $33,432
- Composite
- 7.6/100
- National rank
- #9945
- State rank
- #535 of 539 in PA
Livability — Harrisburg
- Score
- 84/100
- State rank
- #107
- US rank
- #826
Category grades
Schools grade is shown separately in the Schools card above.
Census & demographics
- Census place
- Harrisburg, PA
- County
- Dauphin County · 247,857 people
- City population
- 184,296
- Metro
- Harrisburg-Carlisle, PA
- Population (ZIP)
- 13,115
- Household income
- $39,825
- Rent vs Own
- Severe rent burden
- 1014.0
Population outlook (Dauphin County) Hauer SSP2
- Today (2025)
- 281,628 people
- By 2030
- 283,549 · +0.7%
- By 2040
- 285,385 · +1.3%
- By 2050
- 286,188 · +1.6%
- By 2075
- 291,053 · +3.3%
- By 2100
- 282,374 · +0.3%
Race, ethnicity, and origin ACS 2023
- Neighborhood character
- Diverse neighborhood (Simpson 0.66)
- Race & ethnicity
- Black 47% Hispanic / Latino 31% White 18% Two or more races 10%
- Hispanic origin (detail)
- Mexican 4% Puerto Rican 18% Dominican 5%
- Common ancestry
- Hispanic 1% Romanian 1% Italian 1%
- Foreign-born
- 9% · Canada
- Languages at home
- 83% English-only · Spanish 11% French/Haitian/Cajun 2% Tagalog/Filipino 1%
Political lean MEDSL · Dauphin
- 2024 margin
- Lean D (+5.9) · D 52.4% · R 46.5% · Other 1.1%
- 2008→2024 swing
- -3.1pp toward R · 2008: 9.1pp · 2024: 5.9pp
- All cycles
- 2024: D+5.9 2020: D+8.5 2016: D+2.8 2012: D+6.0 2008: D+9.1
Not yet ingested
- Civics
- —
Market trends
- HPI YoY
- ▼ -119.52%
- Current HPI
- 211.455
- Rent YoY
- ▲ 9.09%
- Metro
- Harrisburg-Carlisle, PA
- State GDP YoY
- ▲ 1.68%
- F500 in state
- 34
Industry mix (Fortune 500 HQ in PA)
| Industry | F500 HQs | Revenue |
|---|---|---|
| Healthcare | 2 | $309B |
|
||
| Insurance | 2 | $27B |
|
||
| Telecommunications / Media | 1 | $124B |
|
||
| Industrial Distribution | 1 | $22B |
|
||
| Financial Services | 1 | $20B |
|
||
| Chemicals / Materials | 1 | $18B |
|
||
Price history
+8020.8% since first listed12 events — show timeline
- 2026-06-14 Listed $194,900 BRIGHT MLS
- 2022-03-15 Sold (Public Records) $145,000 Public Records
- 2022-03-11 Listing Removed — BRIGHT MLS
- 2022-03-10 Sold (MLS) $145,000 BRIGHT MLS
- 2022-01-13 Pending — BRIGHT MLS
- 2022-01-13 Price Changed $145,000 BRIGHT MLS
- 2021-11-29 Price Changed $140,000 BRIGHT MLS
- 2021-11-29 Relisted — BRIGHT MLS
- 2021-10-22 Pending — BRIGHT MLS
- 2021-10-21 Price Changed $145,000 BRIGHT MLS
- 2021-10-15 Listed $139,990 BRIGHT MLS
- 2019-12-04 Sold (Public Records) $2,400 Public Records
Property tax history
+6.7%/yrLatest (2026): $3,572 · +1.7% YoY. Source: county tax records.
Cash-flow waterfall
monthlySold comps — $/sqft
last 12 mo · ≤1 miLoading sold comps…