5470 Pisgah Rd · Rembert, SC
Flood risk 1/10 · Minimal
- FEMA flood zone
- X (unshaded)
- Chance of flooding over 30 yrs
- 0.0%
- Est. flood insurance / yr
- $507 – $1,088
Fire risk 6/10 · Moderate
- Est. fire insurance / yr
- $783 – $1,453
Heat risk 6/10 · Moderate
- Hot days now (above 106°F)
- 7 days/yr
- Hot days in 30 yrs
- 16 days/yr
Wind risk 6/10 · Moderate
- Chance of severe wind over 30 yrs
- 74.0%
Air-quality risk 2/10 · Minimal
- Unhealthy air days now
- 2 days/yr
- Unhealthy air days in 30 yrs
- 2 days/yr
Risk factors via First Street. Map © Google.
Why this score? — see what drove the B grade
The composite is a weighted blend of 9 inputs, each scored 0–100. Each bar is that input's sub-score; the figure is the points it added to the 100-point composite (weight × sub-score).
- Cash flow +30.0/30.0
- 1% rule +10.0/10.0
- DSCR +10.0/10.0
- ARV discount +7.5/15.0
- Appreciation +5.2/10.0
- Livability +2.9/5.0
- Rent growth +2.5/5.0
- Condition / age +2.5/5.0
- Schools +1.9/10.0
$74,900
🖨 Deal sheet 📄 Offer letter ✓ Due diligence
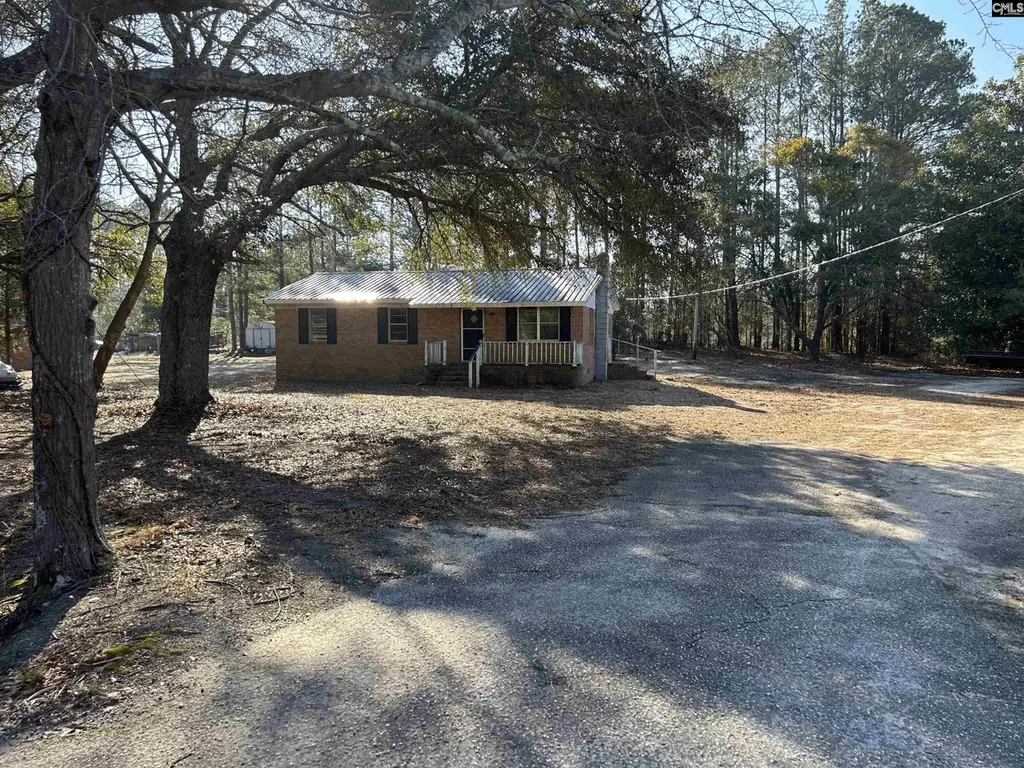
Listing remarks
Attention investors and value buyers! This 3BR/1BA single-family home offers approx. 1,016 sq ft on a spacious 0.69-acre lot—an affordable opportunity to add value. Year built 1974 per deed. Simple layout, manageable size, and solid potential make this an ideal renovation or rental project for buyers working within a budget. Property is sold as-is, where-is, with no repairs, warranties, or credits by seller. Buyer to verify condition, square footage, lot size, zoning, utilities, schools, and suitability for intended use. Information sourced from public or third-party records and deemed reliable but not guaranteed. Cash or renovation financing preferred. Disclaimer: CMLS has not revie
Key facts
- 0.69 acre lot
- Built 1974
- Listed 92 days
Property features AI
Exterior
- Utilities: Public water; Public sewer
- Home design: Single-family property
- Construction: Crawlspace foundation
- Exterior features: Brick exterior above foundation; Paved road access
Interior
- Bedrooms: Master bedroom on the main level
- Bathrooms: One full bathroom
- Heating & cooling: Central heating; Central cooling
- Interior features: One fireplace
Neighborhood map
What this means for you Summary
Snapshot
- This is a 3-bed/1.0-bath single-family listed at $75k.
Deal economics
- At list price, monthly cash flow is $387 ($5k/yr) — positive.
- The deal already cash-flows at list — no discount required.
- Meets the 1% rule at list price ($1k rent vs $75k).
- Recommended offer: $68k (9.0% below list) — sets the bar for market timing.
Location & tenants
- Location reads 57/100 on livability (#285 in SC) — a working-class tenant base; expect higher turnover. Strengths: cost of living A+, housing A+, employment A; Watch: crime F, amenities F, commute F.
- Sumter 01 (urban): math 18% / reading 28% proficiency, ranked #64 of 80 in SC (top 80%) — low school quality limits family demand, transient renter base, plan for 1-2y turnover; 64% free/reduced lunch — lower-income household profile, screen leases tightly.
- Zoned schools: Rafting Creek Elementary (math 5% / reading 15%, grade F, #582 of 597 statewide, top 98%, 134 students, 100% FRL); Crestwood High (math 32% / reading 71%, grade D+, #146 of 196 statewide, top 75%, 1,100 students, 100% FRL) — zoned schools average 100% FRL vs 64% district-wide (36 pts higher); higher-poverty schools than district average — tighter screening recommended.
- Market conditions: 26 active listings in the ZIP; 386 units permitted in Sumter County in 2024 (0 in 5+ unit buildings).
Forward outlook
- In year one you build about $865 of equity ($518 loan paydown + $347 appreciation (0.5% local appreciation)).
- Sumter County population projected at -14% by 2050 — secular population decline; favor cash flow + early exit over multi-decade hold.
- At projected returns (0.5% appreciation + 3.0% rent growth), your $21k cash investment doubles in ~4 years — after that, you're playing with house money.
Negotiation context
- It's been on market 93 days — a 9% lower offer ($68k) is reasonable based on typical stale-listing flexibility.
- 2 sale attempts with the ask held roughly flat each time — persistent listings suggest the price (not the market) is what's stuck; bring a comps-based counter.
Risks & watch-outs
- Climate carrying-cost: major wind risk, 74% chance of damaging wind over 30y; major wildfire risk; extreme-heat days projected 7→16/yr by 2055 (HVAC capex compounding) — expect insurance premiums to compound above CPI over the hold.
Questions for the listing agent
- It's been on market 93 days. Have you received any prior offers? Is the seller open to a 9% concession, seller financing, or rate buy-down credit?
- Built in 1974 — when were the roof, HVAC, electrical panel, plumbing, and water heater last replaced?
- Why hasn't it sold? Are there any deal-killer items the seller is aware of (foundation, flood, title, zoning, code violations)?
- Is there a deadline driving the sale (1031 exchange, divorce, estate, relocation)? That informs how much negotiation room exists.
- Schools are F-rated, which usually means shorter tenancies and higher turnover. Who's the typical renter profile here, and what's been the actual vacancy rate?
- Crime grade is F in this area — have there been break-ins, vandalism, or insurance claims at this property in the last 3 years? What carrier currently insures it and at what premium?
- What's the average days-on-market for RENTAL listings here right now (not sales)? A rising rental-DOM trend means longer vacancies and softer asking-rent achievability than the comps imply.
- What's the recent tenant-quality profile in this submarket — average credit score on applications, eviction rate, late-payment / NSF rate, and stable-employment percentage? A property-management company in the area should have these aggregated.
- How much new for-sale + rental construction is in the pipeline within 1–3 miles? Heavy new supply typically softens prices + rents 12–24 months out; constrained supply supports both.
Investment metrics
- 1% rule
- 1.51% ✓
- Cap rate
- 12.49%
- Cash-on-cash
- 22.14%
- DSCR
- 1.98
- GRM
- 5.5
CMA / ARV
No comps found within radius.
Projected returns pro-forma
0.46% appreciation · 3.0% rent growth · sell at horizon
- IRR
- 23.1%
- Equity multiple
- 2.15×
- Total profit
- $24,107
- Equity at exit
- $23,501
- IRR
- 26.6%
- Equity multiple
- 4.08×
- Total profit
- $64,491
- Equity at exit
- $29,689
Cash invested: $20,972 (down + closing). Projections, not guarantees.
Landlord ↔ Tenant lean methodology
- Overall (STATE)
- 90 Strongly Landlord-Friendly
- State South Carolina
- 90 Strongly Landlord-Friendly · R+6
- County
- — inherits STATE
- City
- — inherits STATE
ZIP-level market 29128
- Home prices YoY
- 0.4%
- Active inventory
- 26
- Price-to-rent
- 5.5×
Monthly cashflow live
- Estimated rent
- $1,133 medium interval (Pro) →
- Mortgage (P&I)
- −$393
- Tax from tax record
- −$85 /mo · $1,015/yr
- Insurance
- −$31
- HOA
- −$0
- Vacancy / Maint / Mgmt
- −$238
- Net cashflow
- $387
Break-even live
UW: 25.0% down · 7.5% · 30yr · 1.5% tax · 5.0% vac · 8.0% maint · 8.0% mgmt
Financing live
Cash to close
- Down payment
- $18,725
- Closing costs
- $2,247
- Reserves months
- —
- Total cash needed
- —
Loan-product check · same deal, 3 products live
Conventional
25% down · 7.5% · 30yr
- Down + closing
- —
- Monthly P&I
- —
- Monthly cashflow
- —
- DSCR
- —
- Eligible?
- —
Personal DTI + credit; lowest rate.
DSCR
20% down · 8.5% · 30yr
- Down + closing
- —
- Monthly P&I
- —
- Monthly cashflow
- —
- DSCR
- —
- Eligible?
- —
No personal income docs; deal must DSCR.
Hard money
10% down · 12.0% · 12mo
- Down + closing
- —
- Monthly P&I
- —
- Monthly cashflow
- —
- DSCR
- —
- Eligible?
- —
Short-term bridge; refi at stabilization.
Listing history 18 events
-
2026-06-19days on market $74,900 Active 93 DOM
-
2026-06-18days on market $74,900 Active 92 DOM
-
2026-06-17days on market $74,900 Active 91 DOM
-
2026-06-16days on market $74,900 Active 90 DOM
-
2026-06-15days on market $74,900 Active 89 DOM
-
2026-06-14days on market $74,900 Active 87 DOM
-
2026-06-13days on market $74,900 Active 86 DOM
-
2026-06-10days on market $74,900 Active 84 DOM
-
2026-06-09days on market $74,900 Active 83 DOM
-
2026-06-08days on market $74,900 Active 82 DOM
-
2026-06-07days on market $74,900 Active 81 DOM
-
2026-06-02days on market $74,900 Active 76 DOM
-
2026-06-01days on market $74,900 Active 75 DOM
-
2026-05-31days on market $74,900 Active 74 DOM
-
2026-05-30days on market $74,900 Active 73 DOM
-
2026-03-18$74,900 Active
-
2026-03-01historical
-
2026-02-05$105,000 Active
ⓘ Source: listings_history table (triggers on properties + properties_extension) + one-shot
backfill from property_details.listing_events for pre-trigger history.
Tax reassessment forecast SC · Resets to sale price
- Current annual tax
- $1,015 · $85/mo
- Projected year-2 tax
- $1,015 · $85/mo
- Expected delta
- $0/yr ($0/mo · 0.0%)
ⓘ Screening estimate from a state-policy table — verify with the county assessor before closing.
Climate risk First Street
- Flood 1/10 Low FEMA zone X (unshaded) · 0% chance over 30 yrs
- Wildfire 6/10 Major
- Heat 6/10 Major 7 d/yr ≥106°F today · 16 d/yr by 30 yrs out
- Wind 6/10 Major 74% chance of damaging wind over 30 yrs
- Air quality 2/10 Low 2 unhealthy d/yr today · 2 by 30 yrs out
Nearby sold comps map
Loading sold comps map…
Walkable amenities ~0.75 mi
Loading nearby amenities…
Taxation est. · year 1
- Rental income
- $13,601
- − Mortgage interest
- −$4,196
- − Property taxes
- −$1,015
- − Insurance
- −$374
- − Repairs & maintenance
- −$1,088
- − Management
- −$1,088
- − Depreciation
- −$2,179
- Taxable income
- $3,661
- Est. tax owed @ 24.0%
- −$879
- After-tax cash flow
- $3,764/yr
For passive investors: Depreciation is non-cash, so a rental often shows a tax loss while cash-flowing — sheltering income. Rental losses are passive: they offset passive income freely, and up to $25,000/yr can offset ordinary (W-2) income if you actively participate and your MAGI is under $100k (phasing out to $0 by $150k); unused losses carry forward. On sale, claimed depreciation is recaptured at up to 25%, and gains may owe capital-gains tax (a 1031 exchange can defer both). Figures are a year-1 estimate at your 24.0% rate — not tax advice; consult a CPA.
Schools (NCES district)
- District
- Sumter 01
- NCES district ID
- 4503902
- Math proficiency
- 18% ▼ -13.00%
- Reading proficiency
- 28% ▼ -6.00%
- Median HH income
- $40,423
- Composite
- 19.45/100
- National rank
- #8775
- State rank
- #64 of 80 in SC
Livability — Rembert
- Score
- 57/100
- State rank
- #285
- US rank
- #22337
Category grades
Schools grade is shown separately in the Schools card above.
Census & demographics
- City population
- 4,309
- Population (ZIP)
- 4,309
Population outlook (Sumter County) Hauer SSP2
- Today (2025)
- 104,585 people
- By 2030
- 102,282 · -2.2%
- By 2040
- 96,258 · -8.0%
- By 2050
- 89,592 · -14.3%
- By 2075
- 74,715 · -28.6%
- By 2100
- 60,235 · -42.4%
Race, ethnicity, and origin ACS 2023
- Neighborhood character
- Predominantly Black (74%)
- Race & ethnicity
- Black 74% White 23% Two or more races 1%
- Common ancestry
- Serbian 2% Slovak 1%
- Foreign-born
- 0% · Canada
- Languages at home
- 97% English-only · French/Haitian/Cajun 1% German/W. Germanic 1% Spanish 1%
Political lean MEDSL · Sumter
- 2024 margin
- Toss-up / Even · D 51.9% · R 47.0% · Other 1.2%
- 2008→2024 swing
- -10.6pp toward R · 2008: 15.4pp · 2024: 4.9pp
- All cycles
- 2024: D+4.9 2020: D+13.0 2016: D+12.0 2012: D+17.5 2008: D+15.4
Not yet ingested
- Civics
- —
Market trends
- HPI YoY
- ▲ 0.46%
- Current HPI
- 111.9199
- Rent YoY
- —
- Metro
- —
- State GDP YoY
- ▲ 4.51%
- F500 in state
- 2
Industry mix (Fortune 500 HQ in SC)
| Industry | F500 HQs | Revenue |
|---|---|---|
| Packaging | 1 | $7B |
|
||
Price history
-28.7% since first listed3 events — show timeline
- 2026-03-18 Listed $74,900 Consolidated MLS
- 2026-03-01 Delisted — Consolidated MLS
- 2026-02-05 Listed $105,000 Consolidated MLS
Property tax history
+29.3%/yrLatest (2025): $1,015 · +1.0% YoY. Source: county tax records.
Cash-flow waterfall
monthlySold comps — $/sqft
last 12 mo · ≤1 miLoading sold comps…