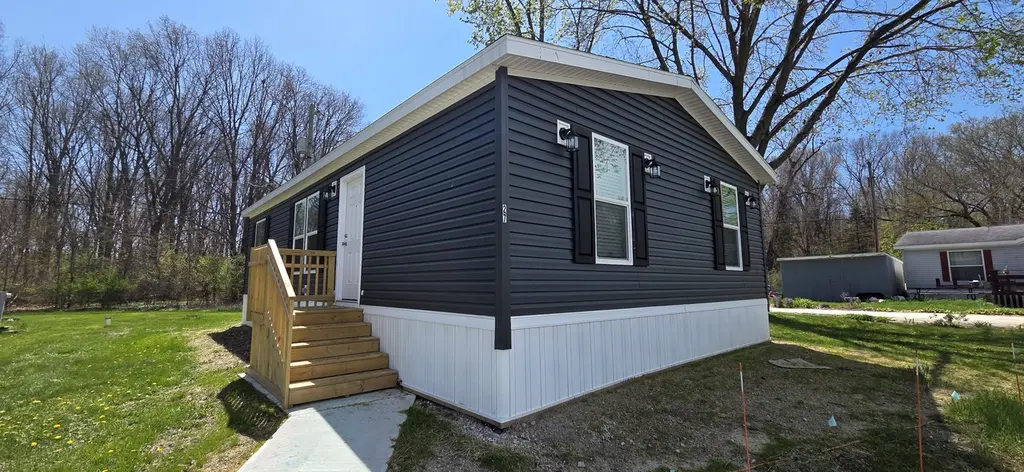
5080 Saint Joseph Ave #27 · Stevensville, MI
Flood risk 3/10 · Minor
- FEMA flood zone
- X (unshaded)
- Chance of flooding over 30 yrs
- 0.2%
- Est. flood insurance / yr
- $507 – $1,088
Fire risk 1/10 · Minimal
- Est. fire insurance / yr
- $784 – $1,456
Heat risk 2/10 · Minimal
- Hot days now (above 101°F)
- 7 days/yr
- Hot days in 30 yrs
- 14 days/yr
Wind risk 2/10 · Minimal
- Chance of severe wind over 30 yrs
- —
Air-quality risk 4/10 · Minor
- Unhealthy air days now
- 4 days/yr
- Unhealthy air days in 30 yrs
- 6 days/yr
Risk factors via First Street. Map © Google.
Why this score? — see what drove the B grade
The composite is a weighted blend of 9 inputs, each scored 0–100. Each bar is that input's sub-score; the figure is the points it added to the 100-point composite (weight × sub-score).
- Cash flow +30.0/30.0
- 1% rule +10.0/10.0
- DSCR +10.0/10.0
- ARV discount +7.5/15.0
- Schools +5.3/10.0
- Livability +3.6/5.0
- Rent growth +2.5/5.0
- Condition / age +2.5/5.0
- Appreciation +0.0/10.0
$79,900
🖨 Deal sheet 📄 Offer letter ✓ Due diligence
Listing remarks
Take advantage of our LIMITED-TIME OFFERS: No site rent until 8/1/2026, free shed, plus waived application fees. Valid through 6/30/26. Restrictions may apply. Brand new 3 bed, 2 bath home with a modern design and an open layout that keeps the main living areas connected. The kitchen sits at the center of the home with a large island and extra cabinet space, offering plenty of room for storage, meal prep, and everyday living. The living and dining areas flow easily off the kitchen, making the space feel open without being overdone. The primary bedroom includes a private bath with a walk-in shower, set up for comfort and convenience. Sand Hill Community is a warm, all-ages manufactured home
Key facts
- Modern design
- Private bath
- Open layout
Tags
Property features AI
Finance
- Financial info: List price $79,900
Exterior
- Home design: Spec home — Dutch Aspire plan; Single-level living area of 960
Interior
- Bedrooms: 3 bedrooms
- Bathrooms: 2 full bathrooms
- Heating & cooling: Central air conditioning
- Interior features: Dishwasher; Refrigerator
Neighborhood map
What this means for you Summary
Snapshot
- This is a 3-bed/2.0-bath manufactured listed at $80k.
Deal economics
- At list price, monthly cash flow is $569 ($7k/yr) — positive.
- The deal already cash-flows at list — no discount required.
- Meets the 1% rule at list price ($1k rent vs $80k).
- Recommended offer: $79k (1.5% below list) — sets the bar for market timing.
- Cap rate 14.8% vs local median 2.2% in Stevensville — top-decile yield for the area; either an underpriced asset or a hidden risk that comps aren't pricing in. Stress-test before assuming the spread holds.
Location & tenants
- Location reads 72/100 on livability (#236 in MI) — a middle-class / working-renter tenant base. Strengths: crime A+, cost of living A+, housing A+; Watch: amenities F, commute F, health & safety F.
- Lakeshore School District (Berrien) (suburban): math 56% / reading 65% proficiency, ranked #37 of 540 in MI (top 7%) — acceptable for families but not a draw, mixed tenant base, ~2y average lease.
- Market conditions: 103 active listings in the ZIP; 1 comparable units currently listed for rent nearby; solid renter incomes; 397 units permitted in Berrien County in 2024 (40 in 5+ unit buildings).
Forward outlook
- Local home prices are declining (-3.0%/yr); year-one equity from $552 of loan paydown is wiped out by about $2k of value loss. Plan a longer hold.
- Berrien County population projected at -16% by 2050 — secular population decline; favor cash flow + early exit over multi-decade hold.
- At projected returns (-3.0% appreciation + 3.0% rent growth), your $22k cash investment doubles in ~4 years — after that, you're playing with house money.
Negotiation context
- It's been on market 29 days — a 2% lower offer ($79k) is reasonable based on typical stale-listing flexibility.
Questions for the listing agent
- Is there a deadline driving the sale (1031 exchange, divorce, estate, relocation)? That informs how much negotiation room exists.
- Schools are B-rated — typically a magnet for longer-tenancy family renters. What's the average tenant stay here, and is there a school-zone premium baked into asking?
- What's the average days-on-market for RENTAL listings here right now (not sales)? A rising rental-DOM trend means longer vacancies and softer asking-rent achievability than the comps imply.
- What's the recent tenant-quality profile in this submarket — average credit score on applications, eviction rate, late-payment / NSF rate, and stable-employment percentage? A property-management company in the area should have these aggregated.
- How much new for-sale + rental construction is in the pipeline within 1–3 miles? Heavy new supply typically softens prices + rents 12–24 months out; constrained supply supports both.
Investment metrics
- 1% rule
- 1.78% ✓
- Cap rate
- 14.83%
- Cash-on-cash
- 30.51%
- DSCR
- 2.36
- GRM
- 4.7
CMA / ARV
No comps found within radius.
Projected returns pro-forma
-3.0% appreciation · 3.0% rent growth · sell at horizon
- IRR
- 25.2%
- Equity multiple
- 2.04×
- Total profit
- $23,298
- Equity at exit
- $11,913
- IRR
- 33.0%
- Equity multiple
- 4.00×
- Total profit
- $67,019
- Equity at exit
- $6,908
Cash invested: $22,372 (down + closing). Projections, not guarantees.
Landlord ↔ Tenant lean methodology
- Overall (STATE)
- 62 Landlord-Friendly
- State Michigan
- 62 Landlord-Friendly · EVEN
- County
- — inherits STATE
- City
- — inherits STATE
ZIP-level market 49127
- Active inventory
- 103
- Price-to-rent
- 4.7×
Monthly cashflow live
- Estimated rent
- $1,419 medium interval (Pro) →
- Mortgage (P&I)
- −$419
- Tax est. 1.5%
- −$100 /mo · $1,198/yr
- Insurance
- −$33
- HOA
- −$0
- Vacancy / Maint / Mgmt
- −$298
- Net cashflow
- $569
Break-even live
UW: 25.0% down · 7.5% · 30yr · 1.5% tax · 5.0% vac · 8.0% maint · 8.0% mgmt
Financing live
Cash to close
- Down payment
- $19,975
- Closing costs
- $2,397
- Reserves months
- —
- Total cash needed
- —
Loan-product check · same deal, 3 products live
Conventional
25% down · 7.5% · 30yr
- Down + closing
- —
- Monthly P&I
- —
- Monthly cashflow
- —
- DSCR
- —
- Eligible?
- —
Personal DTI + credit; lowest rate.
DSCR
20% down · 8.5% · 30yr
- Down + closing
- —
- Monthly P&I
- —
- Monthly cashflow
- —
- DSCR
- —
- Eligible?
- —
No personal income docs; deal must DSCR.
Hard money
10% down · 12.0% · 12mo
- Down + closing
- —
- Monthly P&I
- —
- Monthly cashflow
- —
- DSCR
- —
- Eligible?
- —
Short-term bridge; refi at stabilization.
Rent comps 1 comps
| Address | Beds | Baths | Sqft | Rent | $/sqft | DOM | Units | Dist |
|---|---|---|---|---|---|---|---|---|
| 4581 Red Arrow Hwy Stevensville, MI | 1.0–2.0 | 1.0 | 770 | $1,195 | $1.55 | 43d | 3 | 0.67mi |
Listing history 15 events
-
2026-06-19days on market $79,900 Active 29 DOM
-
2026-06-18days on market $79,900 Active 28 DOM
-
2026-06-17days on market $79,900 Active 27 DOM
-
2026-06-16days on market $79,900 Active 26 DOM
-
2026-06-15days on market $79,900 Active 25 DOM
-
2026-06-14days on market $79,900 Active 23 DOM
-
2026-06-13days on market $79,900 Active 22 DOM
-
2026-06-10days on market $79,900 Active 20 DOM
-
2026-06-09days on market $79,900 Active 19 DOM
-
2026-06-08days on market $79,900 Active 18 DOM
-
2026-06-07days on market $79,900 Active 17 DOM
-
2026-06-02days on market $79,900 Active 12 DOM
-
2026-06-01days on market $79,900 Active 11 DOM
-
2026-05-31days on market $79,900 Active 10 DOM
-
2026-05-30days on market $79,900 Active 9 DOM
ⓘ Source: listings_history table (triggers on properties + properties_extension) + one-shot
backfill from property_details.listing_events for pre-trigger history.
Climate risk First Street
- Flood 3/10 Moderate FEMA zone X (unshaded) · 20% chance over 30 yrs
- Wildfire 1/10 Low
- Heat 2/10 Low 7 d/yr ≥101°F today · 14 d/yr by 30 yrs out
- Wind 2/10 Low
- Air quality 4/10 Moderate 4 unhealthy d/yr today · 6 by 30 yrs out
Nearby sold comps map
Loading sold comps map…
Walkable amenities ~0.75 mi
Loading nearby amenities…
Taxation est. · year 1
- Rental income
- $17,027
- − Mortgage interest
- −$4,476
- − Property taxes
- −$1,198
- − Insurance
- −$400
- − Repairs & maintenance
- −$1,362
- − Management
- −$1,362
- − Depreciation
- −$2,324
- Taxable income
- $5,904
- Est. tax owed @ 24.0%
- −$1,417
- After-tax cash flow
- $5,408/yr
For passive investors: Depreciation is non-cash, so a rental often shows a tax loss while cash-flowing — sheltering income. Rental losses are passive: they offset passive income freely, and up to $25,000/yr can offset ordinary (W-2) income if you actively participate and your MAGI is under $100k (phasing out to $0 by $150k); unused losses carry forward. On sale, claimed depreciation is recaptured at up to 25%, and gains may owe capital-gains tax (a 1031 exchange can defer both). Figures are a year-1 estimate at your 24.0% rate — not tax advice; consult a CPA.
Schools (NCES district)
- District
- Lakeshore School District (Berrien)
- NCES district ID
- 2620820
- Math proficiency
- 56% ▼ -4.00%
- Reading proficiency
- 65% ▲ 2.00%
- Median HH income
- $63,449
- Composite
- 52.75/100
- National rank
- #1546
- State rank
- #37 of 540 in MI
Livability — Stevensville
- Score
- 72/100
- State rank
- #236
- US rank
- #5954
Category grades
Schools grade is shown separately in the Schools card above.
Census & demographics
- County
- Berrien County · 71,477 people
- City population
- 11,155
- Metro
- Niles, MI
- Population (ZIP)
- 11,155
- Household income
- $93,338
- Rent vs Own
- Severe rent burden
- 100.0
Population outlook (Berrien County) Hauer SSP2
- Today (2025)
- 149,273 people
- By 2030
- 145,211 · -2.7%
- By 2040
- 135,435 · -9.3%
- By 2050
- 125,543 · -15.9%
- By 2075
- 103,986 · -30.3%
- By 2100
- 82,256 · -44.9%
Race, ethnicity, and origin ACS 2023
- Neighborhood character
- Predominantly White (83%)
- Race & ethnicity
- White 83% Two or more races 6% Hispanic / Latino 5% Black 4% Asian 3%
- Common ancestry
- Romanian 7% Iranian 4% Slovak 2%
- Foreign-born
- 8% · Canada
- Languages at home
- 93% English-only · Spanish 2% Other Indo-European 2% German/W. Germanic 1%
Political lean MEDSL · Berrien
- 2024 margin
- Lean R (+7.9) · D 45.4% · R 53.2% · Other 1.4%
- 2008→2024 swing
- -13.3pp toward R · 2008: 5.5pp · 2024: -7.9pp
- All cycles
- 2024: R+7.9 2020: R+7.4 2016: R+12.7 2012: R+6.6 2008: D+5.5
Not yet ingested
- Civics
- —
Market trends
- HPI YoY
- ▼ -297.38%
- Current HPI
- 209.9306
- Rent YoY
- —
- Metro
- Niles, MI
- State GDP YoY
- ▲ 1.37%
- F500 in state
- 28
Industry mix (Fortune 500 HQ in MI)
| Industry | F500 HQs | Revenue |
|---|---|---|
| Automotive Parts | 3 | $48B |
|
||
| Automotive | 2 | $372B |
|
||
| Chemicals | 1 | $45B |
|
||
| Automotive Retail | 1 | $29B |
|
||
| Healthcare / Medical Devices | 1 | $23B |
|
||
| Automotive Technology | 1 | $20B |
|
||
Cash-flow waterfall
monthlySold comps — $/sqft
last 12 mo · ≤1 miLoading sold comps…