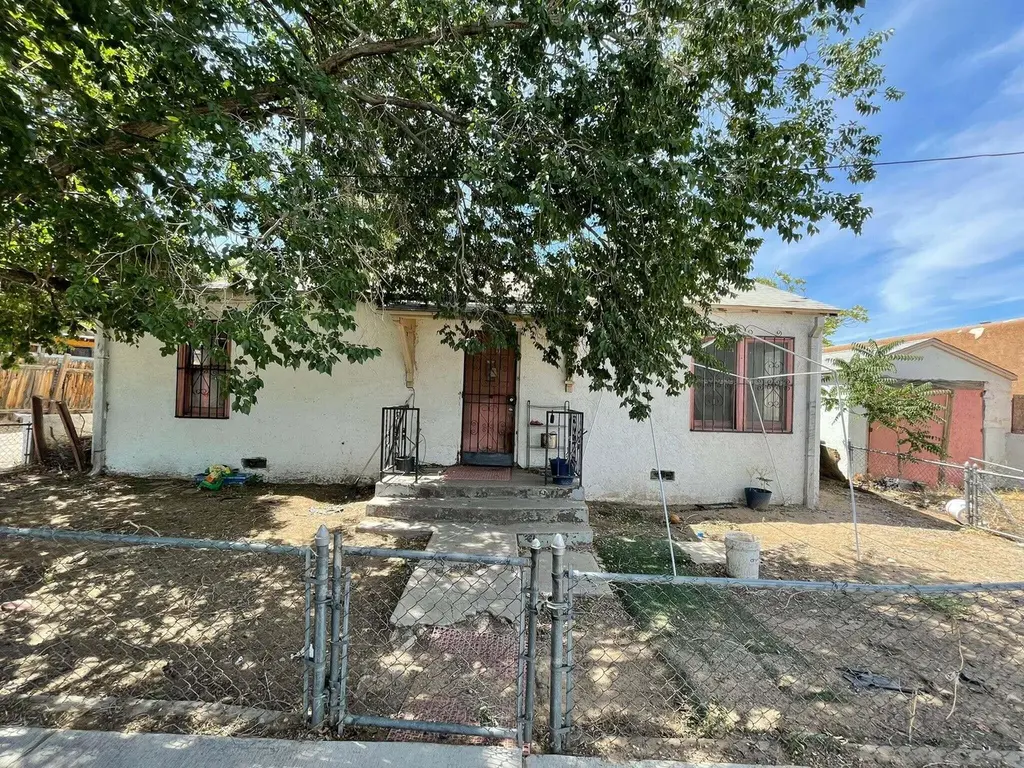
712 Thaxton Ave SE · Albuquerque, NM
Flood risk 1/10 · Minimal
- FEMA flood zone
- X (unshaded)
- Chance of flooding over 30 yrs
- 0.0%
- Est. flood insurance / yr
- $507 – $1,088
Fire risk 3/10 · Minor
- Est. fire insurance / yr
- $706 – $1,312
Heat risk 5/10 · Moderate
- Hot days now (above 95°F)
- 7 days/yr
- Hot days in 30 yrs
- 18 days/yr
Wind risk 1/10 · Minimal
- Chance of severe wind over 30 yrs
- —
Air-quality risk 2/10 · Minimal
- Unhealthy air days now
- 1 days/yr
- Unhealthy air days in 30 yrs
- 3 days/yr
Risk factors via First Street. Map © Google.
Why this score? — see what drove the C grade
The composite is a weighted blend of 9 inputs, each scored 0–100. Each bar is that input's sub-score; the figure is the points it added to the 100-point composite (weight × sub-score).
- Cash flow +22.2/30.0
- ARV discount +7.5/15.0
- DSCR +7.1/10.0
- Schools +5.3/10.0
- 1% rule +4.9/10.0
- Rent growth +3.7/5.0
- Livability +3.6/5.0
- Condition / age +2.5/5.0
- Appreciation +0.0/10.0
$175,000
🖨 Deal sheet (PDF) 📄 Offer letter ✓ Due diligence
Listing remarks
Great opportunity. .! home needs some work such as painting and and some cosmetics, home already has utilities turned on, electricity, gas, water, quick fix it and make some equity. .! SOLD AS IS, Broker OwnerREC with 15,000 down payment, interest 12, long term contract
Key facts
- 2,831 sq ft lot
- Garage
- Built 1948
Property features AI
Exterior
- Parking: Detached or attached garage with 1 garage space
- Utilities: Electricity connected; Natural gas connected; Public water; Public sewer
- Home design: Single-story; Frame construction; Shingle roof
- Construction: Frame construction; Shingle roof
- Exterior features: No notable exterior features reported; Lot approximately 0.07 acres; Zoned R-1; Property faces north; Resale condition
Interior
- Bedrooms: Space for up to 4 bedrooms
- Flooring: Wood flooring
- Bathrooms: 1 full bathroom
- Heating & cooling: Floor furnace heating; Evaporative cooling
- Interior features: Wood window frames; Wood flooring
- Laundry & utility: Electric dryer hookup
Neighborhood map
What this means for you Summary
Snapshot
- This is a 3-bed/1.0-bath other listed at $175k.
Deal economics
- At list price, monthly cash flow is $286 ($3k/yr) — positive.
- The deal already cash-flows at list — no discount required.
- To meet the 1% rule (rent ≥ 1% of price), the offer needs to be $174k (0.6% below list).
- Recommended offer: $174k (0.6% below list) — sets the bar for 1% rule.
- Cap rate 8.3% vs local median 3.7% in Albuquerque — top-decile yield for the area; either an underpriced asset or a hidden risk that comps aren't pricing in. Stress-test before assuming the spread holds.
Location & tenants
- Location reads 72/100 on livability (#13 in NM) — a middle-class / working-renter tenant base. Strengths: amenities A+, commute A+, cost of living A+; Watch: schools D-, crime F.
- Albuquerque Public Schools (urban): math 51% / reading 75% proficiency, ranked #3 of 29 in NM (top 10%) — acceptable for families but not a draw, mixed tenant base, ~2y average lease; 60% free/reduced lunch — lower-income household profile, screen leases tightly.
- Market conditions: Rents rising fast (+4.9%/yr); 143 active listings in the ZIP; 17 comparable units currently listed for rent nearby; rentals lingering (median 45d on market — plan ~5-8 weeks vacancy on turnover, expect pricing pressure); 71% of comp listings sitting > 30 days — soft ceiling on asking rent; lower-income renter base — watch delinquency; 1,316 units permitted in Bernalillo County in 2024 (546 in 5+ unit buildings).
- At $1,739/mo this rent would consume 49% of the median local household income ($43k/yr) (locally 1721% of renters already pay >50% of income on rent) — very limited rent-growth headroom before tenants either downsize or default.
Forward outlook
- Local home prices are declining (-3.0%/yr); year-one equity from $1k of loan paydown is wiped out by about $5k of value loss. Plan a longer hold.
Negotiation context
- Only 9 days on market — expect competitive offers; lowballing is unlikely to land.
Risks & watch-outs
- Watch-outs: built in 1948 — expect roof / HVAC / electrical / plumbing capex.
- Climate carrying-cost: extreme-heat days projected 7→18/yr by 2055 (HVAC capex compounding) — expect insurance premiums to compound above CPI over the hold.
Questions for the listing agent
- Built in 1948 — when were the roof, HVAC, electrical panel, plumbing, and water heater last replaced?
- Is there a deadline driving the sale (1031 exchange, divorce, estate, relocation)? That informs how much negotiation room exists.
- Schools are D-rated, which usually means shorter tenancies and higher turnover. Who's the typical renter profile here, and what's been the actual vacancy rate?
- Crime grade is F in this area — have there been break-ins, vandalism, or insurance claims at this property in the last 3 years? What carrier currently insures it and at what premium?
- What's the average days-on-market for RENTAL listings here right now (not sales)? A rising rental-DOM trend means longer vacancies and softer asking-rent achievability than the comps imply.
- What's the recent tenant-quality profile in this submarket — average credit score on applications, eviction rate, late-payment / NSF rate, and stable-employment percentage? A property-management company in the area should have these aggregated.
- How much new for-sale + rental construction is in the pipeline within 1–3 miles? Heavy new supply typically softens prices + rents 12–24 months out; constrained supply supports both.
Investment metrics
- 1% rule
- 0.99% ✗
- Cap rate
- 8.25%
- Cash-on-cash
- 7.00%
- DSCR
- 1.31
- GRM
- 8.4
CMA / ARV
No comps found within radius.
Projected returns pro-forma
-3.0% appreciation · 4.92% rent growth · sell at horizon
- IRR
- -3.6%
- Equity multiple
- 0.86×
- Total profit
- $-6,785
- Equity at exit
- $26,093
- IRR
- 8.0%
- Equity multiple
- 1.65×
- Total profit
- $31,937
- Equity at exit
- $15,131
Cash invested: $49,000 (down + closing). Projections, not guarantees.
Landlord ↔ Tenant lean methodology
- Overall (STATE)
- 55 Moderately Landlord-Leaning
- State New Mexico
- 55 Moderately Landlord-Leaning · D+3
- County
- — inherits STATE
- City
- — inherits STATE
ZIP-level market 87102
- Rents YoY
- 4.9%
- Active inventory
- 143
- Price-to-rent
- 8.4×
Monthly cashflow live
- Estimated rent
- $1,739 high interval (Pro) →
- Mortgage (P&I)
- −$918
- Tax from tax record
- −$97 /mo · $1,168/yr
- Insurance
- −$73
- HOA
- −$0
- Vacancy / Maint / Mgmt
- −$365
- Net cashflow
- $286
Break-even live
Sensitivity live
| Price | -10% $385 | -5% $335 | +0% $286 | +5% $236 | +10% $187 |
|---|---|---|---|---|---|
| Rent | -10% $148 | -5% $217 | +0% $286 | +5% $354 | +10% $423 |
| Rate | -1.0pp $374 | -0.5pp $330 | base $286 | +0.5pp $240 | +1.0pp $194 |
UW: 25.0% down · 7.5% · 30yr · 1.5% tax · 5.0% vac · 8.0% maint · 8.0% mgmt
Financing live
Cash to close
- Down payment
- $43,750
- Closing costs
- $5,250
- Reserves months
- —
- Total cash needed
- —
Loan-product check · same deal, 3 products live
Conventional
25% down · 7.5% · 30yr
- Down + closing
- —
- Monthly P&I
- —
- Monthly cashflow
- —
- DSCR
- —
- Eligible?
- —
Personal DTI + credit; lowest rate.
DSCR
20% down · 8.5% · 30yr
- Down + closing
- —
- Monthly P&I
- —
- Monthly cashflow
- —
- DSCR
- —
- Eligible?
- —
No personal income docs; deal must DSCR.
Hard money
10% down · 12.0% · 12mo
- Down + closing
- —
- Monthly P&I
- —
- Monthly cashflow
- —
- DSCR
- —
- Eligible?
- —
Short-term bridge; refi at stabilization.
Rent comps 17 comps
| Address | Beds | Baths | Sqft | Rent | $/sqft | DOM | Units | Dist |
|---|---|---|---|---|---|---|---|---|
| 2009 High St SE Unit B Albuquerque, NM | 4.0 | 1.5 | 1000 | $2,036 | $2.04 | 24d | 1 | 0.09mi |
| 2101 Elm St SE Apt A Albuquerque, NM | 3.0 | 1.5 | 1200 | $1,450 | $1.21 | 44d | 1 | 0.14mi |
| 1612 3rd St SW Albuquerque, NM | 3.0 | 2.5 | 1750 | $2,150 | $1.23 | 15d | 1 | 0.84mi |
| 3003 Transport St SE Albuquerque, NM | 5.0 | 1.0–5.0 | 1083 | $1,780 | $1.64 | 44d | 4 | 0.86mi |
| 815 John St SE Albuquerque, NM | 2.0 | 1.0 | 930 | $1,600 | $1.72 | 44d | 1 | 0.94mi |
| 702 Broadway Blvd SE #8 Albuquerque, NM | 2.0 | 1.5 | 1071 | $1,825 | $1.70 | 3d | 1 | 1.02mi |
| 1918 Buena Vista Dr SE Unit B Albuquerque, NM | 2.0 | 1.0 | 1000 | $1,300 | $1.30 | 44d | 1 | 1.03mi |
| 1400 Buena Vista Dr SE Albuquerque, NM | 3.0 | 2.0 | 1718 | $2,200 | $1.28 | 44d | 1 | 1.06mi |
| 1304 Buena Vista Dr SE Albuquerque, NM | 4.0 | 2.0 | 1700 | $2,000 | $1.18 | 15d | 1 | 1.07mi |
| 423 High St SE Albuquerque, NM | 2.0 | 2.0 | 1398 | $1,850 | $1.32 | 44d | 1 | 1.19mi |
| 421 High St SE Albuquerque, NM | 2.0 | 2.0 | 1398 | $1,850 | $1.32 | 44d | 1 | 1.19mi |
| 423 Walter St SE Albuquerque, NM | 3.0 | 2.0 | 1420 | $2,599 | $1.83 | 44d | 1 | 1.20mi |
| 2124 Eton Ave SE Unit 1-F Albuquerque, NM | 3.0 | 2.0 | 1300 | $2,600 | $2.00 | 44d | 1 | 1.36mi |
| 2124 Eton Ave SE Albuquerque, NM | 3.0 | 2.0 | 1300 | $2,200 | $1.69 | 44d | 1 | 1.36mi |
| 1704 Lead Ave SE Unit Lead Ave SE unit 1704 Lead C Albuquerque, NM | 2.0 | 2.0 | 1100 | $1,450 | $1.32 | 3d | 1 | 1.36mi |
| 1704 Lead Ave SE Unit Lead Ave SE unit 1704 Lead C Albuquerque, NM | 2.0 | 2.0 | 1000 | $1,450 | $1.45 | 44d | 1 | 1.36mi |
| 323 Platinum St SW Albuquerque, NM | 2.0 | 1.5 | 1232 | $1,800 | $1.46 | 44d | 1 | 1.47mi |
Listing history 8 events
-
2026-06-19status $175,000 Pending 9 DOM
-
2026-06-18days on market $175,000 Active 9 DOM
-
2026-06-17days on market $175,000 Active 8 DOM
-
2026-06-16days on market $175,000 Active 7 DOM
-
2026-06-15days on market $175,000 Active 6 DOM
-
2026-06-13days on market $175,000 Active 4 DOM
-
2026-06-10remarks 270-char remark
-
2026-06-10$175,000 Active 1 DOM
ⓘ Source: listings_history table (triggers on properties + properties_extension) + one-shot
backfill from property_details.listing_events for pre-trigger history.
Tax reassessment forecast NM · Resets to sale price
- Current annual tax
- $1,168 · $97/mo
- Projected year-2 tax
- $1,400 · $117/mo
- Expected delta
- +$232/yr (+$19/mo · 19.9%)
ⓘ Screening estimate from a state-policy table — verify with the county assessor before closing.
Climate risk First Street
- Flood 1/10 Low FEMA zone X (unshaded) · 0% chance over 30 yrs
- Wildfire 3/10 Moderate
- Heat 5/10 Major 7 d/yr ≥95°F today · 18 d/yr by 30 yrs out
- Wind 1/10 Low
- Air quality 2/10 Low 1 unhealthy d/yr today · 3 by 30 yrs out
Nearby sold comps map
Loading sold comps map…
Walkable amenities ~0.75 mi
Loading nearby amenities…
Taxation est. · year 1
- Rental income
- $20,866
- − Mortgage interest
- −$9,803
- − Property taxes
- −$1,168
- − Insurance
- −$875
- − Repairs & maintenance
- −$1,669
- − Management
- −$1,669
- − Depreciation
- −$5,091
- Taxable income
- $591
- Est. tax owed @ 24.0%
- −$142
- After-tax cash flow
- $3,287/yr
For passive investors: Depreciation is non-cash, so a rental often shows a tax loss while cash-flowing — sheltering income. Rental losses are passive: they offset passive income freely, and up to $25,000/yr can offset ordinary (W-2) income if you actively participate and your MAGI is under $100k (phasing out to $0 by $150k); unused losses carry forward. On sale, claimed depreciation is recaptured at up to 25%, and gains may owe capital-gains tax (a 1031 exchange can defer both). Figures are a year-1 estimate at your 24.0% rate — not tax advice; consult a CPA.
Schools (NCES district)
- District
- Albuquerque Public Schools
- NCES district ID
- 3500060
- Math proficiency
- 51% ▲ 30.00%
- Reading proficiency
- 75% ▲ 45.00%
- Median HH income
- $48,151
- Composite
- 53.29/100
- National rank
- #1487
- State rank
- #3 of 29 in NM
Livability — Albuquerque
- Score
- 72/100
- State rank
- #13
- US rank
- #6219
Category grades
Schools grade is shown separately in the Schools card above.
Census & demographics
- Census place
- Albuquerque, NM
- County
- Bernalillo County · 647,165 people
- City population
- 647,165
- Metro
- Albuquerque, NM
- Population (ZIP)
- 20,123
- Household income
- $42,990
- Rent vs Own
- Severe rent burden
- 1721.0
Population outlook (Bernalillo County) Hauer SSP2
- Today (2025)
- 704,528 people
- By 2030
- 711,723 · +1.0%
- By 2040
- 714,522 · +1.4%
- By 2050
- 709,274 · +0.7%
- By 2075
- 680,015 · -3.5%
- By 2100
- 619,879 · -12.0%
Race, ethnicity, and origin ACS 2023
- Neighborhood character
- Diverse neighborhood (Simpson 0.59)
- Race & ethnicity
- Hispanic / Latino 57% Two or more races 30% White 29% Native American 6% Black 4%
- Hispanic origin (detail)
- Mexican 35% Puerto Rican 1%
- Common ancestry
- Lithuanian 2% Slovak 1% Serbian 1%
- Foreign-born
- 12% · Canada
- Languages at home
- 64% English-only · Spanish 30% Korean 1% Other Indo-European 1%
Political lean MEDSL · Bernalillo
- 2024 margin
- Strong D (+21.0) · D 59.2% · R 38.2% · Other 2.6%
- 2008→2024 swing
- -0.3pp no change · 2008: 21.4pp · 2024: 21.0pp
- All cycles
- 2024: D+21.0 2020: D+24.4 2016: D+17.8 2012: D+16.2 2008: D+21.4
Not yet ingested
- Civics
- —
Market trends
- HPI YoY
- ▼ -208.71%
- Current HPI
- 253.8398
- Rent YoY
- ▲ 4.92%
- Metro
- Albuquerque, NM
- State GDP YoY
- —
- F500 in state
- 0
Price history
3 events — show timeline
- 2026-06-09 Listed $175,000 Southwest MLS
- 2005-03-28 Sold (Public Records) — Public Records
- 2004-09-17 Sold (Public Records) — Public Records
Property tax history
+3.0%/yrLatest (2025): $1,168 · +3.2% YoY. Source: county tax records.
Cash-flow waterfall
monthlySold comps — $/sqft
last 12 mo · ≤1 miLoading sold comps…