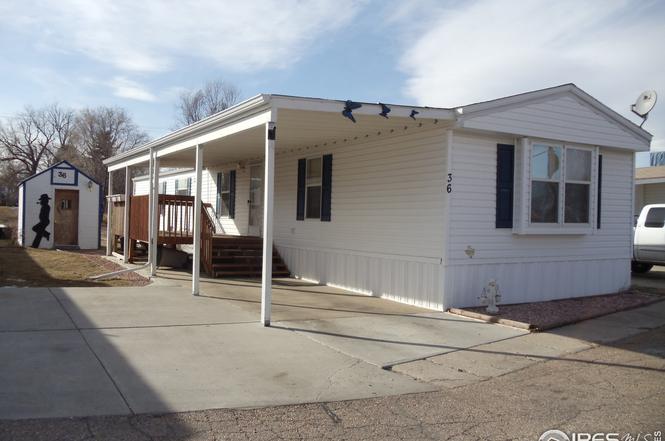
235 N 2nd St #36 · Berthoud, CO
Flood risk 1/10 · Minimal
- FEMA flood zone
- X (unshaded)
- Chance of flooding over 30 yrs
- 0.0%
- Est. flood insurance / yr
- $507 – $1,088
Fire risk 6/10 · Moderate
- Est. fire insurance / yr
- $939 – $1,743
Heat risk 3/10 · Minor
- Hot days now (above 92°F)
- 7 days/yr
- Hot days in 30 yrs
- 19 days/yr
Wind risk 1/10 · Minimal
- Chance of severe wind over 30 yrs
- —
Air-quality risk 4/10 · Minor
- Unhealthy air days now
- 6 days/yr
- Unhealthy air days in 30 yrs
- 7 days/yr
Risk factors via First Street. Map © Google.
Why this score? — see what drove the C+ grade
The composite is a weighted blend of 9 inputs, each scored 0–100. Each bar is that input's sub-score; the figure is the points it added to the 100-point composite (weight × sub-score).
- Cash flow +30.0/30.0
- 1% rule +10.0/10.0
- DSCR +10.0/10.0
- Livability +3.5/5.0
- Schools +3.4/10.0
- Rent growth +2.5/5.0
- Condition / age +2.5/5.0
- ARV discount +0.0/15.0
- Appreciation +0.0/10.0
$169,500
🖨 Deal sheet 📄 Offer letter ✓ Due diligence
Listing remarks
LOW LOT RENT - NO DOGS or FENCES. Welcome to this beautifully maintained ENERGY STAR-certified home, built in 2009, offering 1,631 square feet of thoughtfully designed, single-level living. The heart of the home is the bright, inviting kitchen, enhanced by a skylight that fills the space with natural light. Highlights include quartz countertops, freshly painted cabinets, a wall oven, and a stylish high-efficiency gas stove/oven with an eye-catching backsplash. All kitchen appliances are included, and the charming eat-in kitchen adds warmth and functionality. Also inside, you'll find three spacious bedrooms and two beautifully designed bathrooms, arranged in a split-bedroom layout for added
Key facts
- Quartz countertops
- Skylight
- Built 2009
Tags
Property features AI
Finance
- HOA & community: No association fees or transfer fees listed
Exterior
- Parking: No garage; No designated parking features listed
- Utilities: City water with meter installed; Public sewer; Natural gas available (Xcel); Electricity available; Other utilities available
- Home design: Manufactured in park (mobile home); Built by Clayton
- Construction: Composition exterior; Composition roof
- Exterior features: Enclosed patio/porch; Land lease; Storage structure; Ramp access; Located on a cul-de-sac; Minimal flood risk (C rating)
Interior
- Kitchen: Gas range; Dishwasher; Refrigerator; Microwave; Fire alarm
- Bedrooms: 3 bedrooms
- Bathrooms: 1 full bathroom; 1 three-quarter bathroom
- Heating & cooling: Forced air heating; Central air conditioning
- Interior features: Eat-in kitchen; Separate dining room; Cathedral ceilings; Open floorplan; Workshop; Pantry; Walk-in closets; Skylights; Two or more fireplaces
Neighborhood map
What this means for you Summary
Snapshot
- This is a 2-bed/2.0-bath manufactured listed at $170k.
Deal economics
- At list price, monthly cash flow is $1k ($13k/yr) — positive.
- The deal already cash-flows at list — no discount required.
- Meets the 1% rule at list price ($3k rent vs $170k).
- Recommended offer: $149k (12.0% below list) — sets the bar for market timing.
- Cap rate 14.1% vs local median 3.2% in Berthoud — top-decile yield for the area; either an underpriced asset or a hidden risk that comps aren't pricing in. Stress-test before assuming the spread holds.
Location & tenants
- Location reads 69/100 on livability (#100 in CO) — a middle-class / working-renter tenant base. Strengths: employment A+, housing A+; Watch: amenities F, cost of living F, health & safety F.
- Thompson School District R-2J (suburban): math 28% / reading 48% proficiency, ranked #28 of 86 in CO (top 33%) — families likely to look elsewhere, expect single-tenant / working-renter base with shorter leases.
- Zoned schools: Ivy Stockwell Elementary School (math 47% / reading 57%, grade C-, #174 of 966 statewide, top 20%, 402 students, 21% FRL); Berthoud High School (math 37% / reading 62%, grade D, #115 of 381 statewide, top 34%, 691 students, 15% FRL).
- Zoned-school proficiency averages 51% at this address vs 38% district-wide (+13 pts) — the actual schools serving this property are materially stronger than the Thompson School District R-2J average implies; a family-tenant draw the district grade alone would hide.
- Market conditions: 357 active listings in the ZIP; 2 comparable units currently listed for rent nearby; high-income renter base; 1,786 units permitted in Larimer County in 2024 (402 in 5+ unit buildings).
Forward outlook
- Local home prices are declining (-3.0%/yr); year-one equity from $1k of loan paydown is wiped out by about $5k of value loss. Plan a longer hold.
- Larimer County population projected at +51% by 2050 — long-run rental-demand tailwind backs the buy-and-hold thesis.
- At projected returns (-3.0% appreciation + 3.0% rent growth), your $47k cash investment doubles in ~5 years — after that, you're playing with house money.
Negotiation context
- It's been on market 142 days — a 12% lower offer ($149k) is reasonable based on typical stale-listing flexibility.
- 6 sale attempts since 15y ago; this cycle's ask has dropped $16k (8%) from the opening price — seller is motivated, your offer sets the floor, not the list.
- Current owner paid $33k; list at $170k implies a 415% gain — meaningful room to come down on a strong offer.
Risks & watch-outs
- Climate carrying-cost: major wildfire risk — expect insurance premiums to compound above CPI over the hold.
Questions for the listing agent
- It's been on market 142 days. Have you received any prior offers? Is the seller open to a 12% concession, seller financing, or rate buy-down credit?
- Why hasn't it sold? Are there any deal-killer items the seller is aware of (foundation, flood, title, zoning, code violations)?
- Is there a deadline driving the sale (1031 exchange, divorce, estate, relocation)? That informs how much negotiation room exists.
- Schools are A-rated — typically a magnet for longer-tenancy family renters. What's the average tenant stay here, and is there a school-zone premium baked into asking?
- What's the average days-on-market for RENTAL listings here right now (not sales)? A rising rental-DOM trend means longer vacancies and softer asking-rent achievability than the comps imply.
- What's the recent tenant-quality profile in this submarket — average credit score on applications, eviction rate, late-payment / NSF rate, and stable-employment percentage? A property-management company in the area should have these aggregated.
- How much new for-sale + rental construction is in the pipeline within 1–3 miles? Heavy new supply typically softens prices + rents 12–24 months out; constrained supply supports both.
Investment metrics
- 1% rule
- 1.56% ✓
- Cap rate
- 14.11%
- Cash-on-cash
- 27.92%
- DSCR
- 2.24
- GRM
- 5.3
CMA / ARV
- ARV (on-the-fly)
- $133,742
- Comps found
- 1
Show comp detail 1 sale within ~0.75 mi
| Address | Dist | Beds/Ba | Sqft | Sold | Price | $/sf | Match |
|---|---|---|---|---|---|---|---|
| 230 N 2nd St Unit 76A | 0.19mi | 3/2.0 (+1) | 1,568 (-4%) | 8mo | $127,900 | $82 | 73 |
Match score weights: distance 35% · size 25% · config 20% · recency 20%. Top-matched comps best support the ARV.
Projected returns pro-forma
-3.0% appreciation · 3.0% rent growth · sell at horizon
- IRR
- 22.0%
- Equity multiple
- 1.90×
- Total profit
- $42,799
- Equity at exit
- $25,273
- IRR
- 30.1%
- Equity multiple
- 3.69×
- Total profit
- $127,545
- Equity at exit
- $14,655
Cash invested: $47,460 (down + closing). Projections, not guarantees.
Landlord ↔ Tenant lean methodology
- Overall (STATE)
- 38 Tenant-Leaning
- State Colorado
- 38 Tenant-Leaning · D+4
- County
- — inherits STATE
- City
- — inherits STATE
ZIP-level market 80513
- Active inventory
- 357
- Price-to-rent
- 5.3×
Monthly cashflow live
- Estimated rent
- $2,649 medium interval (Pro) →
- Mortgage (P&I)
- −$889
- Tax from tax record
- −$29 /mo · $347/yr
- Insurance
- −$71
- HOA
- −$0
- Vacancy / Maint / Mgmt
- −$556
- Net cashflow
- $1,104
Break-even live
UW: 25.0% down · 7.5% · 30yr · 1.5% tax · 5.0% vac · 8.0% maint · 8.0% mgmt
Financing live
Cash to close
- Down payment
- $42,375
- Closing costs
- $5,085
- Reserves months
- —
- Total cash needed
- —
Loan-product check · same deal, 3 products live
Conventional
25% down · 7.5% · 30yr
- Down + closing
- —
- Monthly P&I
- —
- Monthly cashflow
- —
- DSCR
- —
- Eligible?
- —
Personal DTI + credit; lowest rate.
DSCR
20% down · 8.5% · 30yr
- Down + closing
- —
- Monthly P&I
- —
- Monthly cashflow
- —
- DSCR
- —
- Eligible?
- —
No personal income docs; deal must DSCR.
Hard money
10% down · 12.0% · 12mo
- Down + closing
- —
- Monthly P&I
- —
- Monthly cashflow
- —
- DSCR
- —
- Eligible?
- —
Short-term bridge; refi at stabilization.
Rent comps 2 comps
| Address | Beds | Baths | Sqft | Rent | $/sqft | DOM | Units | Dist |
|---|---|---|---|---|---|---|---|---|
| 1088 Blue Bell Rd Berthoud, CO | 3.0 | 2.5 | 1949 | $2,800 | $1.44 | 23d | 1 | 0.86mi |
| 1155 Summit Vista Dr Berthoud, CO | 3.0 | 2.5 | 1377 | $2,650 | $1.92 | 14d | 1 | 0.88mi |
Listing history 21 events
-
2026-06-02days on market $169,500 Active 142 DOM
-
2026-06-01days on market $169,500 Active 141 DOM
-
2026-05-31days on market $169,500 Active 140 DOM
-
2026-05-30days on market $169,500 Active 139 DOM
-
2026-04-13price $169,500
-
2026-02-16price $176,900
-
2026-01-11$185,000 Active
-
2025-11-01historical
-
2025-10-08$195,000 Active
-
2019-06-22historical
-
2019-06-12$135,000 Active
-
2018-09-13historical
-
2018-08-27status Pending
-
2018-06-23price $136,500
-
2018-06-19$142,500 Active
-
2017-02-20historical
-
2017-02-13price $124,000
-
2017-02-07$129,000 Active
-
2011-04-07soldstatus $32,900 Sold
-
2011-03-22historical
-
2011-02-16$32,900 Active
ⓘ Source: listings_history table (triggers on properties + properties_extension) + one-shot
backfill from property_details.listing_events for pre-trigger history.
Tax reassessment forecast CO · Resets to sale price
- Current annual tax
- $347 · $29/mo
- Projected year-2 tax
- $932 · $78/mo
- Expected delta
- +$586/yr (+$49/mo · 169.0%)
ⓘ Screening estimate from a state-policy table — verify with the county assessor before closing.
Climate risk First Street
- Flood 1/10 Low FEMA zone X (unshaded) · 0% chance over 30 yrs
- Wildfire 6/10 Major
- Heat 3/10 Moderate 7 d/yr ≥92°F today · 19 d/yr by 30 yrs out
- Wind 1/10 Low
- Air quality 4/10 Moderate 6 unhealthy d/yr today · 7 by 30 yrs out
Nearby sold comps map
Loading sold comps map…
Walkable amenities ~0.75 mi
Loading nearby amenities…
Taxation est. · year 1
- Rental income
- $31,789
- − Mortgage interest
- −$9,495
- − Property taxes
- −$347
- − Insurance
- −$848
- − Repairs & maintenance
- −$2,543
- − Management
- −$2,543
- − Depreciation
- −$4,931
- Taxable income
- $11,083
- Est. tax owed @ 24.0%
- −$2,660
- After-tax cash flow
- $10,593/yr
For passive investors: Depreciation is non-cash, so a rental often shows a tax loss while cash-flowing — sheltering income. Rental losses are passive: they offset passive income freely, and up to $25,000/yr can offset ordinary (W-2) income if you actively participate and your MAGI is under $100k (phasing out to $0 by $150k); unused losses carry forward. On sale, claimed depreciation is recaptured at up to 25%, and gains may owe capital-gains tax (a 1031 exchange can defer both). Figures are a year-1 estimate at your 24.0% rate — not tax advice; consult a CPA.
Schools (NCES district)
- District
- Thompson School District R-2J
- NCES district ID
- 0805400
- Math proficiency
- 28% ▼ -7.00%
- Reading proficiency
- 48% ▬ 0.00%
- Median HH income
- $63,040
- Composite
- 34.01/100
- National rank
- #5313
- State rank
- #28 of 86 in CO
Livability — Berthoud
- Score
- 69/100
- State rank
- #100
- US rank
- #8538
Category grades
Schools grade is shown separately in the Schools card above.
Census & demographics
- Census place
- Berthoud, CO
- County
- Larimer County · 338,255 people
- City population
- 18,271
- Metro
- Fort Collins, CO
- Population (ZIP)
- 18,271
- Household income
- $126,726
- Rent vs Own
- Severe rent burden
- 55.0
Population outlook (Larimer County) Hauer SSP2
- Today (2025)
- 415,361 people
- By 2030
- 457,762 · +10.2%
- By 2040
- 542,310 · +30.6%
- By 2050
- 627,048 · +51.0%
- By 2075
- 833,722 · +100.7%
- By 2100
- 952,590 · +129.3%
Race, ethnicity, and origin ACS 2023
- Neighborhood character
- Predominantly White (86%)
- Race & ethnicity
- White 86% Hispanic / Latino 10% Two or more races 6%
- Hispanic origin (detail)
- Mexican 6% Puerto Rican 1%
- Common ancestry
- Slovak 6% Romanian 4% Lithuanian 4%
- Foreign-born
- 4% · Canada, China, Vietnam
- Languages at home
- 95% English-only · Spanish 4% Other Indo-European 1%
Political lean MEDSL · Larimer
- 2024 margin
- D (+17.6) · D 57.4% · R 39.8% · Other 2.9%
- 2008→2024 swing
- +7.9pp toward D · 2008: 9.7pp · 2024: 17.6pp
- All cycles
- 2024: D+17.6 2020: D+15.4 2016: D+4.9 2012: D+5.2 2008: D+9.7
Not yet ingested
- Civics
- —
Market trends
- HPI YoY
- ▼ -411.30%
- Current HPI
- 260.0027
- Rent YoY
- —
- Metro
- Fort Collins, CO
- State GDP YoY
- ▲ 1.95%
- F500 in state
- 14
Industry mix (Fortune 500 HQ in CO)
| Industry | F500 HQs | Revenue |
|---|---|---|
| Technology Distribution | 1 | $31B |
|
||
| Food / Agriculture | 1 | $18B |
|
||
| Packaging | 1 | $14B |
|
||
| Healthcare | 1 | $13B |
|
||
| Energy | 1 | $10B |
|
||
| Technology | 1 | $4B |
|
||
Price history
+415.2% since first listed17 events — show timeline
- 2026-04-13 Price Changed $169,500 IRES
- 2026-02-16 Price Changed $176,900 IRES
- 2026-01-11 Listed $185,000 IRES
- 2025-11-01 Listing Removed — IRES
- 2025-10-08 Listed $195,000 IRES
- 2019-06-22 Listing Removed — IRES
- 2019-06-12 Listed $135,000 IRES
- 2018-09-13 Listing Removed — IRES
- 2018-08-27 Pending — IRES
- 2018-06-23 Price Changed $136,500 IRES
- 2018-06-19 Listed $142,500 IRES
- 2017-02-20 Listing Removed — IRES
- 2017-02-13 Price Changed $124,000 IRES
- 2017-02-07 Listed $129,000 IRES
- 2011-04-07 Sold (MLS) $32,900 IRES
- 2011-03-22 Listing Removed — IRES
- 2011-02-16 Listed $32,900 IRES
Property tax history
+0.1%/yrLatest (2025): $347 · +260.4% YoY. Source: county tax records.
Cash-flow waterfall
monthlySold comps — $/sqft
last 12 mo · ≤1 miLoading sold comps…