80 E Maplewood Ave · Dayton, OH
Flood risk 4/10 · Minor
- FEMA flood zone
- X (unshaded)
- Chance of flooding over 30 yrs
- 0.2%
- Est. flood insurance / yr
- $473 – $860
Fire risk 1/10 · Minimal
- Est. fire insurance / yr
- $713 – $1,323
Heat risk 3/10 · Minor
- Hot days now (above 104°F)
- 7 days/yr
- Hot days in 30 yrs
- 18 days/yr
Wind risk 2/10 · Minimal
- Chance of severe wind over 30 yrs
- 0.0%
Air-quality risk 3/10 · Minor
- Unhealthy air days now
- 2 days/yr
- Unhealthy air days in 30 yrs
- 4 days/yr
Risk factors via First Street. Map © Google.
Why this score? — see what drove the D+ grade
The composite is a weighted blend of 9 inputs, each scored 0–100. Each bar is that input's sub-score; the figure is the points it added to the 100-point composite (weight × sub-score).
- Cash flow +21.2/30.0
- DSCR +6.8/10.0
- ARV discount +5.0/15.0
- 1% rule +4.9/10.0
- Rent growth +3.6/5.0
- Livability +3.2/5.0
- Condition / age +2.5/5.0
- Schools +1.3/10.0
- Appreciation +0.0/10.0
$109,000
🖨 Deal sheet (PDF) 📄 Offer letter ✓ Due diligence
Listing remarks MLS
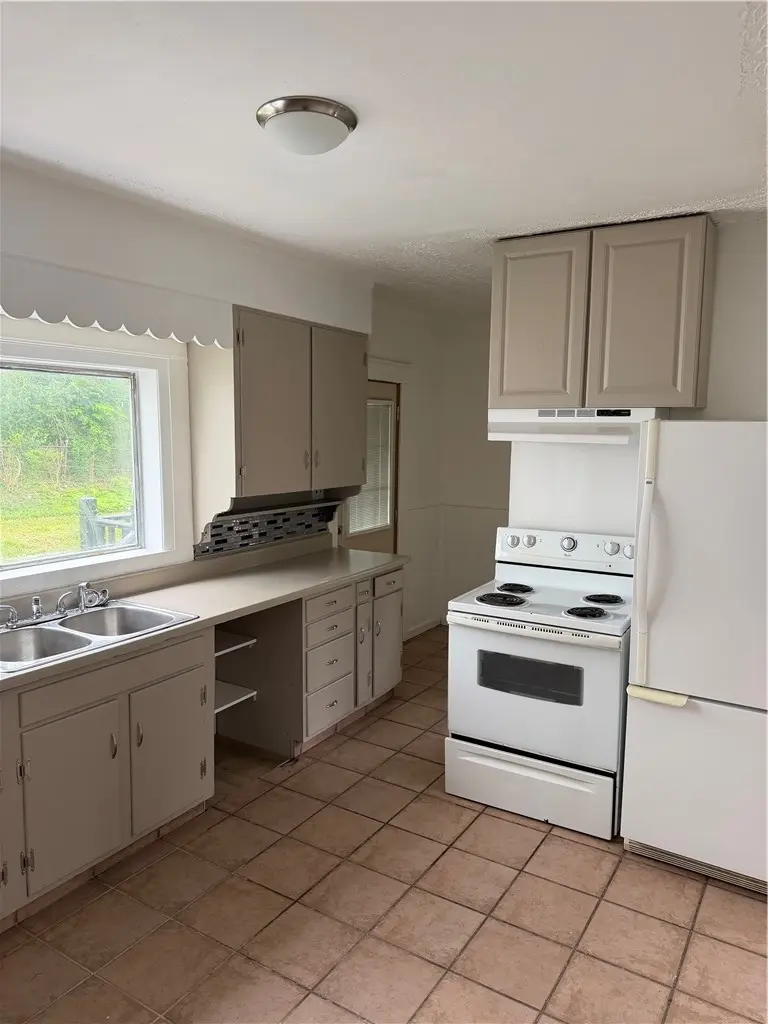
Very cute 2 story home. Home features large living and dining areas. Kitchen is open with great counter and cabinet space. Huge 2 car detached garage. Large bedrooms with great closet space. Don't miss this great first time buyer home. Please read attached doc, print and forward with all offers. Seller addendum required. Info believed accurate not warranted. Rely on your own inspections. This sale is subject to seller’s ability in conveying insurable title.
Key facts
- Enclosed front porch
- 6,399 sq ft lot
- 2 garage spots
Tags
Property features AI
Finance
- Financial info: Offered for sale
Exterior
- Parking: Detached two-car garage
- Utilities: Natural gas available; Central air conditioning
- Home design: Two-story home; Aluminum siding and frame construction
- Construction: Aluminum siding; Frame construction
- Exterior features: Residential lot
Interior
- Kitchen: Kitchen on main level
- Bedrooms: Three bedrooms on the second level
- Bathrooms: One full bathroom; One half bathroom (main level)
- Heating & cooling: Natural gas heating; Central air conditioning
- Interior features: Full, unfinished basement; Florida room
- Laundry & utility: Basement utility space
Neighborhood map
What this means for you Summary
Snapshot
- This is a 3-bed/1.5-bath single-family listed at $109k.
Deal economics
- At list price, monthly cash flow is $158 ($2k/yr) — positive.
- The deal already cash-flows at list — no discount required.
- To meet the 1% rule (rent ≥ 1% of price), the offer needs to be $108k (0.8% below list).
- Recommended offer: $107k (1.5% below list) — sets the bar for market timing.
Location & tenants
- Location reads 65/100 on livability (#716 in OH) — a middle-class / working-renter tenant base. Strengths: cost of living A+, housing A+, health & safety A; Watch: amenities C-, crime F, commute F.
- Dayton City (urban): math 12% / reading 21% proficiency, ranked #641 of 656 in OH (top 98%) — low school quality limits family demand, transient renter base, plan for 1-2y turnover; 74% free/reduced lunch — lower-income household profile, screen leases tightly.
- Zoned schools: River'S Edge Montessori Elementary School (math 22% / reading 32%, grade F, #1,193 of 1,584 statewide, top 76%, 494 students, 0% FRL); Belmont High School (math 5% / reading 20%, grade F, #720 of 781 statewide, top 93%, 1,100 students, 0% FRL) — zoned schools average 0% FRL vs 74% district-wide (74 pts lower); this property's tenant base skews higher-income than the district average.
- Market conditions: Rents rising fast (+4.3%/yr); 136 active listings in the ZIP; 40 comparable units currently listed for rent nearby; rentals at typical pace (median 26d on market — plan ~3-4 weeks tenant-placement turnaround); 42% of comp listings sitting > 30 days — soft ceiling on asking rent; lower-income renter base — watch delinquency; 907 units permitted in Montgomery County in 2024 (416 in 5+ unit buildings).
Forward outlook
- Local home prices are declining (-3.0%/yr); year-one equity from $754 of loan paydown is wiped out by about $3k of value loss. Plan a longer hold.
- Montgomery County population projected at -10% by 2050 — secular population decline; favor cash flow + early exit over multi-decade hold.
Negotiation context
- It's been on market 19 days — a 2% lower offer ($107k) is reasonable based on typical stale-listing flexibility.
- 2 sale attempts since 7y ago with the ask held roughly flat each time — persistent listings suggest the price (not the market) is what's stuck; bring a comps-based counter.
- Current owner paid $20k; list at $109k implies a 445% gain — meaningful room to come down on a strong offer.
Risks & watch-outs
- Watch-outs: built in 1923 — expect roof / HVAC / electrical / plumbing capex.
Questions for the listing agent
- Built in 1923 — when were the roof, HVAC, electrical panel, plumbing, and water heater last replaced?
- Is there a deadline driving the sale (1031 exchange, divorce, estate, relocation)? That informs how much negotiation room exists.
- Crime grade is F in this area — have there been break-ins, vandalism, or insurance claims at this property in the last 3 years? What carrier currently insures it and at what premium?
- The area grade is low — what's the realistic commute time and amenity access for the typical tenant pool here? Any planned neighborhood developments (good or bad) we should know about?
- What's the average days-on-market for RENTAL listings here right now (not sales)? A rising rental-DOM trend means longer vacancies and softer asking-rent achievability than the comps imply.
- What's the recent tenant-quality profile in this submarket — average credit score on applications, eviction rate, late-payment / NSF rate, and stable-employment percentage? A property-management company in the area should have these aggregated.
- How much new for-sale + rental construction is in the pipeline within 1–3 miles? Heavy new supply typically softens prices + rents 12–24 months out; constrained supply supports both.
Investment metrics
- 1% rule
- 0.99% ✗
- Cap rate
- 8.04%
- Cash-on-cash
- 6.23%
- DSCR
- 1.28
- GRM
- 8.4
CMA / ARV
- ARV (on-the-fly)
- $103,332
- Comps found
- 12
Show comp detail 12 sales within ~0.75 mi
| Address | Dist | Beds/Ba | Sqft | Sold | Price | $/sf | Match |
|---|---|---|---|---|---|---|---|
| 121 E Hillcrest Ave | 0.08mi | 3/1.0 | 1,402 (+7%) | 1mo | $75,000 | $53 | 82 |
| 69 E Beechwood Ave | 0.10mi | 3/1.0 | 1,400 (+7%) | 1mo | $173,000 | $124 | 81 |
| 128 E Parkwood Dr | 0.33mi | 3/1.0 | 1,228 (-6%) | 1mo | $29,810 | $24 | 72 |
| 423 Sandalwood Dr | 0.30mi | 3/1.5 | 1,444 (+10%) | 1mo | $62,000 | $43 | 68 |
| 445 Sandhurst Dr | 0.56mi | 3/1.0 | 1,338 (+2%) | 2mo | $48,950 | $37 | 66 |
| 212 E Hillcrest Ave | 0.22mi | 3/1.0 | 1,144 (-12%) | 2mo | $90,000 | $79 | 65 |
| 1404 Pinecrest Dr | 0.74mi | 3/1.5 | 1,256 (-4%) | 0mo | $205,000 | $163 | 58 |
| 117 Valleyview Dr | 0.52mi | 2/1.0 (-1) | 1,381 (+6%) | 1mo | $50,000 | $36 | 58 |
| 148 Valleyview Dr | 0.46mi | 3/1.0 | 1,163 (-11%) | 2mo | $125,000 | $107 | 57 |
| 17 Marie Ave | 0.55mi | 4/1.5 (+1) | 1,424 (+9%) | 0mo | $70,000 | $49 | 54 |
| 50 Woodcrest Ave | 0.41mi | 3/1.0 | 1,500 (+15%) | 2mo | $155,000 | $103 | 53 |
| 2933 Lindale Ave | 0.73mi | 3/2.0 | 1,132 (-14%) | 2mo | $208,000 | $184 | 40 |
Match score weights: distance 35% · size 25% · config 20% · recency 20%. Top-matched comps best support the ARV.
Projected returns pro-forma
-3.0% appreciation · 4.34% rent growth · sell at horizon
- IRR
- -5.3%
- Equity multiple
- 0.80×
- Total profit
- $-6,120
- Equity at exit
- $16,252
- IRR
- 5.8%
- Equity multiple
- 1.45×
- Total profit
- $13,809
- Equity at exit
- $9,424
Cash invested: $30,520 (down + closing). Projections, not guarantees.
Landlord ↔ Tenant lean methodology
- Overall (STATE)
- 73 Landlord-Friendly
- State Ohio
- 73 Landlord-Friendly · R+6
- County
- — inherits STATE
- City
- — inherits STATE
ZIP-level market 45405
- Rents YoY
- 4.3%
- Active inventory
- 136
- Price-to-rent
- 8.4×
Monthly cashflow live
- Estimated rent
- $1,081 high interval (Pro) →
- Mortgage (P&I)
- −$572
- Tax from tax record
- −$79 /mo · $944/yr
- Insurance
- −$45
- HOA
- −$0
- Vacancy / Maint / Mgmt
- −$227
- Net cashflow
- $158
Break-even live
Sensitivity live
| Price | -10% $220 | -5% $189 | +0% $158 | +5% $127 | +10% $97 |
|---|---|---|---|---|---|
| Rent | -10% $73 | -5% $116 | +0% $158 | +5% $201 | +10% $244 |
| Rate | -1.0pp $213 | -0.5pp $186 | base $158 | +0.5pp $130 | +1.0pp $101 |
UW: 25.0% down · 7.5% · 30yr · 1.5% tax · 5.0% vac · 8.0% maint · 8.0% mgmt
Financing live
Cash to close
- Down payment
- $27,250
- Closing costs
- $3,270
- Reserves months
- —
- Total cash needed
- —
Loan-product check · same deal, 3 products live
Conventional
25% down · 7.5% · 30yr
- Down + closing
- —
- Monthly P&I
- —
- Monthly cashflow
- —
- DSCR
- —
- Eligible?
- —
Personal DTI + credit; lowest rate.
DSCR
20% down · 8.5% · 30yr
- Down + closing
- —
- Monthly P&I
- —
- Monthly cashflow
- —
- DSCR
- —
- Eligible?
- —
No personal income docs; deal must DSCR.
Hard money
10% down · 12.0% · 12mo
- Down + closing
- —
- Monthly P&I
- —
- Monthly cashflow
- —
- DSCR
- —
- Eligible?
- —
Short-term bridge; refi at stabilization.
Rent comps 40 comps
| Address | Beds | Baths | Sqft | Rent | $/sqft | DOM | Units | Dist |
|---|---|---|---|---|---|---|---|---|
| 65 E Maplewood Ave Dayton, OH | 2.0 | 1.0 | 1064 | $723 | $0.68 | 45d | 1 | 0.03mi |
| 39 E Maplewood Ave Dayton, OH | 4.0 | 1.5 | 1560 | $1,050 | $0.67 | 5d | 1 | 0.07mi |
| 42 Pointview Ave Unit 42 Dayton, OH | 3.0 | 2.0 | 1240 | $1,200 | $0.97 | 5d | 1 | 0.10mi |
| 38 Pointview Ave Dayton, OH | 2.0 | 1.0 | 1140 | $900 | $0.79 | 16d | 1 | 0.11mi |
| 220 Fernwood Ave Dayton, OH | 2.0 | 1.0 | 884 | $900 | $1.02 | 5d | 1 | 0.18mi |
| 26 W Beechwood Ave Dayton, OH | 3.0 | 1.5 | 1468 | $1,050 | $0.72 | 45d | 1 | 0.20mi |
| 202 E Bruce Ave Apt 2 Dayton, OH | 2.0 | 1.0 | 1250 | $800 | $0.64 | 25d | 1 | 0.24mi |
| 147 Laura Ave Dayton, OH | 2.0 | 1.0 | 1096 | $975 | $0.89 | 25d | 1 | 0.26mi |
| 101 E Bruce Ave Dayton, OH | 3.0 | 1.0 | 1455 | $1,150 | $0.79 | 4d | 1 | 0.27mi |
| 317 Fernwood Ave Dayton, OH | 3.0 | 1.0 | 1320 | $1,100 | $0.83 | 13d | 1 | 0.27mi |
| 152 Laura Ave Dayton, OH | 2.0 | 1.0 | 990 | $895 | $0.90 | 45d | 1 | 0.28mi |
| 337 Ryburn Ave Unit 2 Dayton, OH | 2.0 | 1.0 | 900 | $800 | $0.89 | 45d | 1 | 0.37mi |
| 228 E Siebenthaler Ave Dayton, OH | 2.0 | 1.0 | 934 | $1,200 | $1.28 | 45d | 1 | 0.43mi |
| 244 E Siebenthaler Ave Dayton, OH | 2.0 | 1.5 | 1273 | $1,175 | $0.92 | 4d | 1 | 0.44mi |
| 2327 N Main St Unit 2 Dayton, OH | 2.0 | 1.0 | 900 | $1,200 | $1.33 | 25d | 1 | 0.46mi |
| 41 W Fairview Ave Unit 2 Dayton, OH | 3.0 | 1.0 | 1452 | $1,200 | $0.83 | 16d | 1 | 0.48mi |
| 31 E Norman Ave Dayton, OH | 3.0 | 1.0 | 1100 | $1,150 | $1.05 | 25d | 1 | 0.53mi |
| 419 Sandhurst Dr Dayton, OH | 2.0 | 1.0 | 950 | $975 | $1.03 | 25d | 1 | 0.55mi |
| 101 W Norman Ave Unit 101 Dayton, OH | 3.0 | 1.0 | 1600 | $945 | $0.59 | 45d | 1 | 0.55mi |
| 412 W Parkwood Dr Unit 1 Dayton, OH | 2.0 | 1.0 | 900 | $875 | $0.97 | 25d | 1 | 0.56mi |
| 2333 Rustic Rd Unit 4 Dayton, OH | 2.0 | 1.0 | 1000 | $840 | $0.84 | 4d | 1 | 0.58mi |
| 2333 Rustic Rd Dayton, OH | 2.0 | 1.0 | 1000 | $840 | $0.84 | 45d | 1 | 0.58mi |
| 181 W Norman Ave Dayton, OH | 3.0 | 2.0 | 1228 | $1,150 | $0.94 | 45d | 1 | 0.59mi |
| 201 W Norman Ave Dayton, OH | 3.0 | 1.0 | 1424 | $1,200 | $0.84 | 45d | 1 | 0.60mi |
| 439 W Fairview Ave Dayton, OH | 3.0 | 1.0 | 1500 | $1,200 | $0.80 | 45d | 1 | 0.61mi |
| 167 W Hudson Ave Dayton, OH | 3.0 | 1.5 | 1344 | $1,185 | $0.88 | 45d | 1 | 0.64mi |
| 234 Santa Clara Ave Dayton, OH | 3.0 | 1.0 | 1368 | $1,125 | $0.82 | 45d | 1 | 0.79mi |
| 1019 Cherry Dr Dayton, OH | 4.0 | 1.0 | 1057 | $1,125 | $1.06 | 45d | 1 | 0.80mi |
| 628 W Norman Ave Unit 628 Dayton, OH | 2.0 | 1.0 | 918 | $795 | $0.87 | 45d | 1 | 0.81mi |
| 69 Waverly Ave Dayton, OH | 2.0 | 1.0 | 900 | $850 | $0.94 | 5d | 1 | 0.87mi |
| 1004 W Fairview Ave Dayton, OH | 2.0 | 1.0 | 1053 | $950 | $0.90 | 25d | 1 | 0.87mi |
| 265 Victor Ave Dayton, OH | 3.0 | 1.0 | 1204 | $900 | $0.75 | 45d | 1 | 0.91mi |
| 240 Castlewood Ave Dayton, OH | 2.0 | 1.0 | 912 | $995 | $1.09 | 23d | 1 | 0.93mi |
| 1207 W Fairview Ave Dayton, OH | 2.0 | 1.0 | 1023 | $825 | $0.81 | 5d | 1 | 0.98mi |
| 1207 W Fairview Ave Dayton, OH | 2.0 | 1.0 | 1023 | $825 | $0.81 | 45d | 1 | 0.98mi |
| 519 Heather Dr Unit 1C Dayton, OH | 2.0 | 2.0 | 1100 | $1,095 | $1.00 | 5d | 1 | 0.99mi |
| 2247 Salem Ave Unit 2249 Dayton, OH | 3.0 | 1.5 | 1300 | $1,400 | $1.08 | 45d | 1 | 1.02mi |
| 2247 Salem Ave Unit 2247 Dayton, OH | 3.0 | 1.5 | 1300 | $1,350 | $1.04 | 5d | 1 | 1.02mi |
| 110 Cromwell Pl Unit 2 Dayton, OH | 2.0 | 1.0 | 1000 | $995 | $0.99 | 23d | 1 | 1.02mi |
| 110 Cromwell Pl Unit 5 Dayton, OH | 2.0 | 1.0 | 1000 | $1,099 | $1.10 | 21d | 1 | 1.02mi |
Listing history 14 events
-
2026-06-22days on market $109,000 Active 19 DOM
-
2026-06-18days on market $109,000 Active 16 DOM
-
2026-06-17days on market $109,000 Active 15 DOM
-
2026-06-16days on market $109,000 Active 14 DOM
-
2026-06-15days on market $109,000 Active 13 DOM
-
2026-06-14days on market $109,000 Active 11 DOM
-
2026-06-13days on market $109,000 Active 10 DOM
-
2026-06-10days on market $109,000 Active 8 DOM
-
2026-06-09days on market $109,000 Active 7 DOM
-
2026-06-08days on market $109,000 Active 6 DOM
-
2026-06-07days on market $109,000 Active 5 DOM
-
2026-06-05days on market $109,000 Active 2 DOM
-
2026-06-03remarks 699-char remark
-
2026-06-03$109,000 Active 1 DOM
ⓘ Source: listings_history table (triggers on properties + properties_extension) + one-shot
backfill from property_details.listing_events for pre-trigger history.
Tax reassessment forecast OH · Partial reset (capped growth)
- Current annual tax
- $944 · $79/mo
- Projected year-2 tax
- $1,322 · $110/mo
- Expected delta
- +$378/yr (+$31/mo · 40.0%)
ⓘ Screening estimate from a state-policy table — verify with the county assessor before closing.
Climate risk First Street
- Flood 4/10 Moderate FEMA zone X (unshaded) · 20% chance over 30 yrs
- Wildfire 1/10 Low
- Heat 3/10 Moderate 7 d/yr ≥104°F today · 18 d/yr by 30 yrs out
- Wind 2/10 Low 0% chance of damaging wind over 30 yrs
- Air quality 3/10 Moderate 2 unhealthy d/yr today · 4 by 30 yrs out
Nearby sold comps map
Loading sold comps map…
Walkable amenities ~0.75 mi
Loading nearby amenities…
Taxation est. · year 1
- Rental income
- $12,973
- − Mortgage interest
- −$6,106
- − Property taxes
- −$944
- − Insurance
- −$545
- − Repairs & maintenance
- −$1,038
- − Management
- −$1,038
- − Depreciation
- −$3,171
- Taxable income
- $132
- Est. tax owed @ 24.0%
- −$32
- After-tax cash flow
- $1,869/yr
For passive investors: Depreciation is non-cash, so a rental often shows a tax loss while cash-flowing — sheltering income. Rental losses are passive: they offset passive income freely, and up to $25,000/yr can offset ordinary (W-2) income if you actively participate and your MAGI is under $100k (phasing out to $0 by $150k); unused losses carry forward. On sale, claimed depreciation is recaptured at up to 25%, and gains may owe capital-gains tax (a 1031 exchange can defer both). Figures are a year-1 estimate at your 24.0% rate — not tax advice; consult a CPA.
Schools (NCES district)
- District
- Dayton City
- NCES district ID
- 3904384
- Math proficiency
- 12% ▼ -12.00%
- Reading proficiency
- 21% ▼ -11.00%
- Median HH income
- $28,688
- Composite
- 12.94/100
- National rank
- #9579
- State rank
- #641 of 656 in OH
Livability — Dayton
- Score
- 65/100
- State rank
- #716
- US rank
- #12895
Category grades
Schools grade is shown separately in the Schools card above.
Census & demographics
- Census place
- Dayton, OH
- County
- Montgomery County · 459,541 people
- City population
- 164,387
- Metro
- Dayton-Kettering, OH
- Population (ZIP)
- 18,955
- Household income
- $43,973
- Rent vs Own
- Severe rent burden
- 1475.0
Population outlook (Montgomery County) Hauer SSP2
- Today (2025)
- 523,241 people
- By 2030
- 514,948 · -1.6%
- By 2040
- 493,378 · -5.7%
- By 2050
- 469,639 · -10.2%
- By 2075
- 418,360 · -20.0%
- By 2100
- 353,315 · -32.5%
Race, ethnicity, and origin ACS 2023
- Neighborhood character
- Predominantly Black (68%)
- Race & ethnicity
- Black 68% White 23% Two or more races 7% Hispanic / Latino 3%
- Common ancestry
- Italian 1% Slovak 1%
- Foreign-born
- 3% · Canada
- Languages at home
- 95% English-only · Spanish 2% French/Haitian/Cajun 1%
Political lean MEDSL · Montgomery
- 2024 margin
- Toss-up / Even · D 49.8% · R 49.3%
- 2008→2024 swing
- -5.8pp toward R · 2008: 6.2pp · 2024: 0.5pp
- All cycles
- 2024: D+0.5 2020: D+2.2 2016: R+1.2 2012: D+3.1 2008: D+6.2
Not yet ingested
- Civics
- —
Market trends
- HPI YoY
- ▼ -125.58%
- Current HPI
- 173.4962
- Rent YoY
- ▲ 4.34%
- Metro
- Dayton-Kettering, OH
- State GDP YoY
- ▲ 1.98%
- F500 in state
- 48
Industry mix (Fortune 500 HQ in OH)
| Industry | F500 HQs | Revenue |
|---|---|---|
| Insurance | 3 | $145B |
|
||
| Industrial Machinery | 3 | $49B |
|
||
| Financial Services | 3 | $24B |
|
||
| Consumer Goods | 2 | $93B |
|
||
| Aerospace / Defense | 2 | $47B |
|
||
| Utilities | 2 | $33B |
|
||
Price history
+82.0% since first listed6 events — show timeline
- 2026-06-02 Listed $109,000 Dayton MLS
- 2019-02-21 Sold (MLS) $20,000 Dayton MLS
- 2019-02-21 Sold (MLS) $20,000 Dayton MLS
- 2019-01-31 Pending — Dayton MLS
- 2019-01-15 Listed $19,900 Dayton MLS
- 1998-07-20 Sold (Public Records) $59,900 Public Records
Property tax history
-1.3%/yrLatest (2025): $944 · -0.2% YoY. Source: county tax records.
Cash-flow waterfall
monthlySold comps — $/sqft
last 12 mo · ≤1 miLoading sold comps…