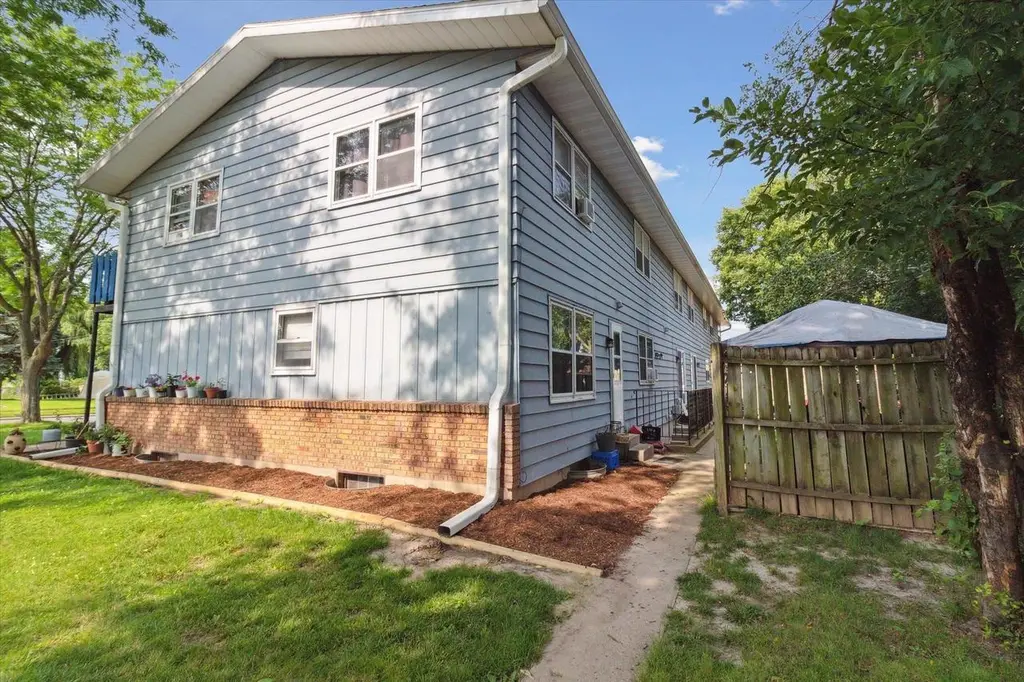
 7-Plex
3712-3724 Lien Rd · Madison, WI
Flood risk 1/10 · Minimal
- FEMA flood zone
- X (unshaded)
- Chance of flooding over 30 yrs
- 0.0%
- Est. flood insurance / yr
- $473 – $860
Fire risk 1/10 · Minimal
- Est. fire insurance / yr
- $636 – $1,182
Heat risk 2/10 · Minimal
- Hot days now (above 100°F)
- 7 days/yr
- Hot days in 30 yrs
- 14 days/yr
Wind risk 2/10 · Minimal
- Chance of severe wind over 30 yrs
- —
Air-quality risk 3/10 · Minor
- Unhealthy air days now
- 2 days/yr
- Unhealthy air days in 30 yrs
- 3 days/yr
Risk factors via First Street. Map © Google.
Why this score? — see what drove the D- grade
The composite is a weighted blend of 9 inputs, each scored 0–100. Each bar is that input's sub-score; the figure is the points it added to the 100-point composite (weight × sub-score).
- Cash flow +12.5/30.0
- ARV discount +7.5/15.0
- Livability +4.2/5.0
- DSCR +3.7/10.0
- 1% rule +3.4/10.0
- Schools +3.3/10.0
- Rent growth +2.8/5.0
- Condition / age +2.5/5.0
- Appreciation +0.0/10.0
$1,099,900
🖨 Deal sheet (PDF) 📄 Offer letter ✓ Due diligence
Multi-family units
County records classify this as Multi-Family (5+ Unit). Listing-text estimate: 7 units. confirmed
5+ unit building — per-unit beds/baths from public records are typically unavailable; the breakdown below (if shown) is an estimate from the listing text.
Listing remarks
Stabilized 7-unit in Madison combining reliable in-place income with meaningful rent upside. Long-term tenants anchor the rent roll. Six units are similar in size and share laundry in the basement. Unit 3724 stands out as a townhome-style layout with bedrooms on upper-level and a private unfinished basement, including its own dedicated laundry. Current rents range from $1,100 to a renovated unit at $1,400, with two active renewal offers accepted at $1,250 establishing strong in-building comps and a clear floor for repricing units.
Key facts
- 0.37 acre lot
- Parking
- Built 1971
Property features AI
Finance
- Other: Seven residential rental units (unit sizes include 900 sq ft for several units and one 1,100 sq ft unit); Appliances included for all units as noted; tenants' personal property excluded
- Financial info: Multi-family property (7 units); Improvement value listed in records
Exterior
- Parking: One outside parking space
- Utilities: Municipal water; Municipal sewer; Separate electric meters
- Home design: Apartment building, 2-story; 1–2 stories
- Construction: 0.37 acre lot
- Exterior features: Aluminum/steel exterior; Zoned residential
Interior
- Kitchen: Refrigerators included (7); Dishwashers included (7); Oven/Range included (7)
- Bedrooms: Seven units with 2 bedrooms each (Units 1–4 listed; total units: 7)
- Bathrooms: Mostly full bathrooms; some units include a half bath (Unit 4 has 1 half bath)
- Heating & cooling: Radiant electric heating; Natural gas available
- Interior features: Partial basement with crawl space and poured concrete
- Laundry & utility: Separate electric meters
Neighborhood map
What this means for you Summary
Snapshot
- This is a 7 × 2-bed/1-bath units multifamily listed at $1.10M.
Deal economics
- At list price, monthly cash flow is $-165 ($-2k/yr) — negative. Per door: $-24/mo.
- To cash-flow at today's rent, offer at most $1.07M (2.7% below list).
- To meet the 1% rule (rent ≥ 1% of price), the offer needs to be $929k (15.6% below list).
- Recommended offer: $929k (15.6% below list) — sets the bar for 1% rule.
- Cap rate 6.1% vs local median 2.4% in Madison — top-decile yield for the area; either an underpriced asset or a hidden risk that comps aren't pricing in. Stress-test before assuming the spread holds.
Location & tenants
- Location reads 84/100 on livability (#39 in WI, #819 nationally) — a professional / high-income tenant draw. Strengths: commute A+, employment A+, housing A+.
- Madison Metropolitan School District (urban): math 35% / reading 40% proficiency, ranked #193 of 342 in WI (top 56%) — families likely to look elsewhere, expect single-tenant / working-renter base with shorter leases.
- Zoned schools: Sandburg Elementary (392 students, 64% FRL); Sherman Middle (math 17% / reading 27%, grade F, #336 of 383 statewide, top 89%, 401 students, 58% FRL); East High (math 32% / reading 42%, grade F, #123 of 483 statewide, top 28%, 1,649 students, 55% FRL).
- Market conditions: Rents rising (+1.1%/yr); 140 active listings in the ZIP; 5,519 units permitted in Dane County in 2024 (3,978 in 5+ unit buildings).
- At $9,286/mo this rent would consume 151% of the median local household income ($74k/yr) (locally 2064% of renters already pay >50% of income on rent) — very limited rent-growth headroom before tenants either downsize or default.
Forward outlook
- Local home prices are declining (-3.0%/yr); year-one equity from $8k of loan paydown is wiped out by about $33k of value loss. Plan a longer hold.
- Dane County population projected at +35% by 2050 — long-run rental-demand tailwind backs the buy-and-hold thesis.
Negotiation context
- It's been on market 20 days — a 2% lower offer ($1.08M) is reasonable based on typical stale-listing flexibility.
- Current owner paid $315k; list at $1.10M implies a 249% gain — meaningful room to come down on a strong offer.
Questions for the listing agent
- What do current leases actually rent for vs. the listed asking? Can we see a recent rent roll and the last 12 months of T-12 income?
- Can we see the unit-by-unit rent roll, current vacancy, and any below-market leases? What's the average tenancy length?
- What capital expenditures (roof, boiler, parking lot, exteriors) have been made in the last 5 years, and what's planned in the next 2?
- Built in 1971 — when were the roof, HVAC, electrical panel, plumbing, and water heater last replaced?
- Is there a deadline driving the sale (1031 exchange, divorce, estate, relocation)? That informs how much negotiation room exists.
- The area grade is low — what's the realistic commute time and amenity access for the typical tenant pool here? Any planned neighborhood developments (good or bad) we should know about?
- What's the average days-on-market for RENTAL listings here right now (not sales)? A rising rental-DOM trend means longer vacancies and softer asking-rent achievability than the comps imply.
- What's the recent tenant-quality profile in this submarket — average credit score on applications, eviction rate, late-payment / NSF rate, and stable-employment percentage? A property-management company in the area should have these aggregated.
- How much new apartment / multifamily construction is in the pipeline within 1–3 miles? Heavy new supply (>2% of stock underway) typically softens rents 12–24 months out; light construction supports rent growth.
Investment metrics
- 1% rule
- 0.84% ✗
- Cap rate
- 6.11%
- Cash-on-cash
- -0.64%
- DSCR
- 0.97
- GRM
- 9.9
CMA / ARV
No comps found within radius.
Projected returns pro-forma
-3.0% appreciation · 1.14% rent growth · sell at horizon
- IRR
- -19.4%
- Equity multiple
- 0.33×
- Total profit
- $-205,747
- Equity at exit
- $163,999
- IRR
- -16.5%
- Equity multiple
- 0.16×
- Total profit
- $-259,851
- Equity at exit
- $95,099
Cash invested: $307,972 (down + closing). Projections, not guarantees.
Landlord ↔ Tenant lean methodology
- Overall (STATE)
- 73 Landlord-Friendly
- State Wisconsin
- 73 Landlord-Friendly · R+2
- County
- — inherits STATE
- City
- — inherits STATE
ZIP-level market 53704
- Rents YoY
- 1.1%
- Active inventory
- 140
- Price-to-rent
- 69.1×
Monthly cashflow live
- Estimated rent
- $9,286 high interval (Pro) →
- Mortgage (P&I)
- −$5,768
- Tax from tax record
- −$1,275 /mo · $15,300/yr
- Insurance
- −$458
- HOA
- −$0
- Vacancy / Maint / Mgmt
- −$1,950
- Net cashflow
- $-165
Break-even live
Sensitivity live
| Price | -10% $457 | -5% $146 | +0% $-165 | +5% $-477 | +10% $-788 |
|---|---|---|---|---|---|
| Rent | -10% $-899 | -5% $-532 | +0% $-165 | +5% $201 | +10% $568 |
| Rate | -1.0pp $389 | -0.5pp $114 | base $-165 | +0.5pp $-450 | +1.0pp $-740 |
7-unit breakdown (identical units grouped — click to expand)
| Units | Beds | Baths | Est. rent |
|---|---|---|---|
| 7× units | 2 | 1 | $9,289 |
| #1 | 2 | 1 | $1,327 |
| #2 | 2 | 1 | $1,327 |
| #3 | 2 | 1 | $1,327 |
| #4 | 2 | 1 | $1,327 |
| #5 | 2 | 1 | $1,327 |
| #6 | 2 | 1 | $1,327 |
| #7 | 2 | 1 | $1,327 |
| Total (7 units) | $9,286 | ||
UW: 25.0% down · 7.5% · 30yr · 1.5% tax · 5.0% vac · 8.0% maint · 8.0% mgmt
Financing live
Cash to close
- Down payment
- $274,975
- Closing costs
- $32,997
- Reserves months
- —
- Total cash needed
- —
Loan-product check · same deal, 3 products live
Conventional
25% down · 7.5% · 30yr
- Down + closing
- —
- Monthly P&I
- —
- Monthly cashflow
- —
- DSCR
- —
- Eligible?
- —
Personal DTI + credit; lowest rate.
DSCR
20% down · 8.5% · 30yr
- Down + closing
- —
- Monthly P&I
- —
- Monthly cashflow
- —
- DSCR
- —
- Eligible?
- —
No personal income docs; deal must DSCR.
Hard money
10% down · 12.0% · 12mo
- Down + closing
- —
- Monthly P&I
- —
- Monthly cashflow
- —
- DSCR
- —
- Eligible?
- —
Short-term bridge; refi at stabilization.
Listing history 14 events
-
2026-06-21days on market $1,099,900 Active 20 DOM
-
2026-06-18days on market $1,099,900 Active 17 DOM
-
2026-06-17days on market $1,099,900 Active 16 DOM
-
2026-06-16days on market $1,099,900 Active 15 DOM
-
2026-06-15days on market $1,099,900 Active 14 DOM
-
2026-06-14days on market $1,099,900 Active 12 DOM
-
2026-06-13days on market $1,099,900 Active 11 DOM
-
2026-06-10days on market $1,099,900 Active 9 DOM
-
2026-06-09days on market $1,099,900 Active 8 DOM
-
2026-06-08days on market $1,099,900 Active 7 DOM
-
2026-06-07days on market $1,099,900 Active 6 DOM
-
2026-06-03days on market $1,099,900 Active 2 DOM
-
2026-06-01remarks 536-char remark
-
2026-06-01$1,099,900 Active 1 DOM
ⓘ Source: listings_history table (triggers on properties + properties_extension) + one-shot
backfill from property_details.listing_events for pre-trigger history.
Tax reassessment forecast WI · Partial reset (capped growth)
- Current annual tax
- $15,300 · $1,275/mo
- Projected year-2 tax
- $17,824 · $1,485/mo
- Expected delta
- +$2,524/yr (+$210/mo · 16.5%)
ⓘ Screening estimate from a state-policy table — verify with the county assessor before closing.
Climate risk First Street
- Flood 1/10 Low FEMA zone X (unshaded) · 0% chance over 30 yrs
- Wildfire 1/10 Low
- Heat 2/10 Low 7 d/yr ≥100°F today · 14 d/yr by 30 yrs out
- Wind 2/10 Low
- Air quality 3/10 Moderate 2 unhealthy d/yr today · 3 by 30 yrs out
Nearby sold comps map
Loading sold comps map…
Walkable amenities ~0.75 mi
Loading nearby amenities…
Taxation est. · year 1
- Rental income
- $111,432
- − Mortgage interest
- −$61,612
- − Property taxes
- −$15,300
- − Insurance
- −$5,500
- − Repairs & maintenance
- −$8,915
- − Management
- −$8,915
- − Depreciation
- −$31,997
- Taxable loss
- −$20,805
- Est. tax savings @ 24.0%
- +$4,993
- After-tax cash flow
- $3,009/yr
For passive investors: Depreciation is non-cash, so a rental often shows a tax loss while cash-flowing — sheltering income. Rental losses are passive: they offset passive income freely, and up to $25,000/yr can offset ordinary (W-2) income if you actively participate and your MAGI is under $100k (phasing out to $0 by $150k); unused losses carry forward. On sale, claimed depreciation is recaptured at up to 25%, and gains may owe capital-gains tax (a 1031 exchange can defer both). Figures are a year-1 estimate at your 24.0% rate — not tax advice; consult a CPA.
Schools (NCES district)
- District
- Madison Metropolitan School District
- NCES district ID
- 5508520
- Math proficiency
- 35% ▼ -4.00%
- Reading proficiency
- 40% ▲ 3.00%
- Median HH income
- $51,654
- Composite
- 32.56/100
- National rank
- #5686
- State rank
- #193 of 342 in WI
Livability — Madison
- Score
- 84/100
- State rank
- #39
- US rank
- #819
Category grades
Schools grade is shown separately in the Schools card above.
Census & demographics
- Census place
- Madison, WI
- County
- Dane County · 506,461 people
- City population
- 301,931
- Metro
- Madison, WI
- Population (ZIP)
- 46,730
- Household income
- $74,034
- Rent vs Own
- Severe rent burden
- 2064.0
Population outlook (Dane County) Hauer SSP2
- Today (2025)
- 610,707 people
- By 2030
- 654,875 · +7.2%
- By 2040
- 740,480 · +21.2%
- By 2050
- 826,188 · +35.3%
- By 2075
- 1,040,574 · +70.4%
- By 2100
- 1,168,084 · +91.3%
Race, ethnicity, and origin ACS 2023
- Neighborhood character
- Predominantly White (67%)
- Race & ethnicity
- White 67% Two or more races 13% Black 11% Hispanic / Latino 10% Asian 5%
- Hispanic origin (detail)
- Mexican 6%
- Common ancestry
- Portuguese 6% Romanian 4% Italian 3%
- Foreign-born
- 9% · Canada, China, Jamaica
- Languages at home
- 89% English-only · Spanish 6% Other Asian/Pacific 2% Other Indo-European 1%
Political lean MEDSL · Dane
- 2024 margin
- Solid D (+51.7) · D 75.1% · R 23.4% · Other 1.5%
- 2008→2024 swing
- +4.7pp toward D · 2008: 47.0pp · 2024: 51.7pp
- All cycles
- 2024: D+51.7 2020: D+52.6 2016: D+48.0 2012: D+43.6 2008: D+47.0
Not yet ingested
- Civics
- —
Market trends
- HPI YoY
- ▼ -440.26%
- Current HPI
- 293.4723
- Rent YoY
- ▲ 1.14%
- Metro
- Madison, WI
- State GDP YoY
- ▲ 2.10%
- F500 in state
- 20
Industry mix (Fortune 500 HQ in WI)
| Industry | F500 HQs | Revenue |
|---|---|---|
| Industrial Machinery | 4 | $23B |
|
||
| Industrial Technology | 2 | $36B |
|
||
| Insurance | 1 | $36B |
|
||
| Professional Services | 1 | $19B |
|
||
| Utilities | 1 | $9B |
|
||
| Consumer Goods | 1 | $3B |
|
||
Price history
+249.2% since first listed2 events — show timeline
- 2026-06-01 Listed $1,099,900 SCWMLS
- 2001-01-26 Sold (Public Records) $315,000 Public Records
Property tax history
+4.1%/yrLatest (2025): $15,300 · +16.3% YoY. Source: county tax records.
Cash-flow waterfall
monthlySold comps — $/sqft
last 12 mo · ≤1 miLoading sold comps…