 Fourplex
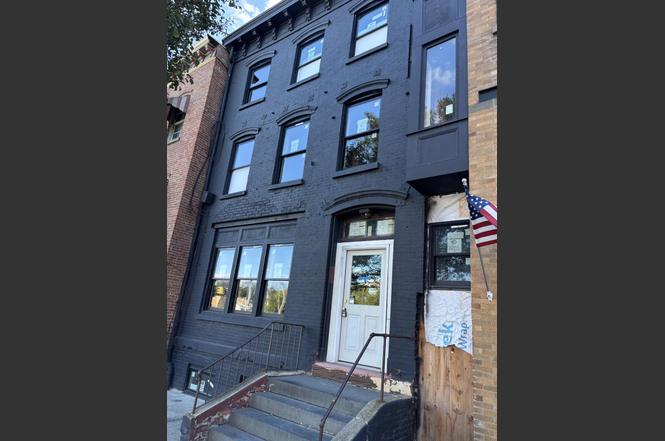
157 Broadway · Newburgh, NY
Flood risk No data
- FEMA flood zone
- —
- Chance of flooding over 30 yrs
- —
- Est. flood insurance / yr
- —
Fire risk No data
- Est. fire insurance / yr
- —
Heat risk No data
- Hot days now (above threshold)
- —
- Hot days in 30 yrs
- —
Wind risk No data
- Chance of severe wind over 30 yrs
- —
Air-quality risk No data
- Unhealthy air days now
- —
- Unhealthy air days in 30 yrs
- —
Risk factors via First Street. Map © Google.
Why this score? — see what drove the B- grade
The composite is a weighted blend of 9 inputs, each scored 0–100. Each bar is that input's sub-score; the figure is the points it added to the 100-point composite (weight × sub-score).
- Cash flow +30.0/30.0
- 1% rule +10.0/10.0
- DSCR +10.0/10.0
- ARV discount +6.3/15.0
- Schools +3.5/10.0
- Livability +3.1/5.0
- Rent growth +2.7/5.0
- Condition / age +2.5/5.0
- Appreciation +0.0/10.0
$449,000
🖨 Deal sheet (PDF) 📄 Offer letter ✓ Due diligence
Multi-family units
County records classify this as Multi-Family (2-4 Unit). Listing-text estimate: 4 units. confirmed
Listing remarks
Stalled 4 Family Construction. Full Floor Units, Two 2 Bedroom Units and Two 3 Bedroom Units. Framing Done, Split Units in place, Plumbing, Electrical and Underground Utilities in place. Ready for insulation and sheetrock. Approved Plans in Place. Creative Seller Financing Available.
Key facts
- 3,920 sq ft lot
- Built 1910
- Listed 515 days
Tags
Property features AI
Finance
- Financial info: Seller financing available
Exterior
- Parking: On-street parking
- Utilities: Public sewer; Trash collection (public)
- Home design: Townhouse; Quadruplex
- Construction: Brick construction
- Exterior features: Brick construction
Interior
- Heating & cooling: Ductless cooling; Natural gas heating; Other heating
- Interior features: Three or more levels; 18 total rooms; Full basement
Neighborhood map
What this means for you Summary
Snapshot
- This is a 2×2bd/1.5ba + 2×3bd/1.5ba units multifamily listed at $449k.
Deal economics
- At list price, monthly cash flow is $2k ($27k/yr) — positive. Per door: $560/mo.
- The deal already cash-flows at list — no discount required.
- Meets the 1% rule at list price ($7k rent vs $449k).
- Recommended offer: $395k (12.0% below list) — sets the bar for market timing.
- Cap rate 12.3% vs local median 4.4% in Newburgh — top-decile yield for the area; either an underpriced asset or a hidden risk that comps aren't pricing in. Stress-test before assuming the spread holds.
Location & tenants
- Location reads 62/100 on livability (#878 in NY) — a middle-class / working-renter tenant base. Strengths: health & safety A+, housing B+, cost of living B; Watch: employment D+, crime F, amenities F.
- Newburgh City School District (suburban): math 33% / reading 48% proficiency, ranked #500 of 590 in NY (top 85%) — families likely to look elsewhere, expect single-tenant / working-renter base with shorter leases; 61% free/reduced lunch — lower-income household profile, screen leases tightly.
- Zoned schools: Newburgh Free Academy (math 76% / reading 85%, grade A, #506 of 1,100 statewide, top 46%, 3,433 students, 56% FRL).
- Zoned-school proficiency averages 80% at this address vs 40% district-wide (+40 pts) — the actual schools serving this property are materially stronger than the Newburgh City School District average implies; a family-tenant draw the district grade alone would hide.
- Market conditions: Rents flat; 384 active listings in the ZIP; 1 comparable units currently listed for rent nearby; solid renter incomes; 1,746 units permitted in Orange County in 2024 (1,265 in 5+ unit buildings).
- At $7,373/mo this rent would consume 103% of the median local household income ($86k/yr) (locally 2412% of renters already pay >50% of income on rent) — very limited rent-growth headroom before tenants either downsize or default.
Forward outlook
- Local home prices are declining (-3.0%/yr); year-one equity from $3k of loan paydown is wiped out by about $13k of value loss. Plan a longer hold.
- At projected returns (-3.0% appreciation + 0.6% rent growth), your $126k cash investment doubles in ~7 years — after that, you're playing with house money.
Negotiation context
- It's been on market 515 days — a 12% lower offer ($395k) is reasonable based on typical stale-listing flexibility.
- 6 sale attempts since 24y ago; this cycle's ask has dropped $351k (44%) from the opening price — seller is motivated, your offer sets the floor, not the list.
- Current owner paid $275k; list at $449k implies a 63% gain — meaningful room to come down on a strong offer.
Risks & watch-outs
- Watch-outs: property tax is 2.8% of price; built in 1910 — expect roof / HVAC / electrical / plumbing capex.
Questions for the listing agent
- It's been on market 515 days. Have you received any prior offers? Is the seller open to a 12% concession, seller financing, or rate buy-down credit?
- Can we see the unit-by-unit rent roll, current vacancy, and any below-market leases? What's the average tenancy length?
- What capital expenditures (roof, boiler, parking lot, exteriors) have been made in the last 5 years, and what's planned in the next 2?
- Built in 1910 — when were the roof, HVAC, electrical panel, plumbing, and water heater last replaced?
- Property tax is high relative to price — has the assessment been appealed recently, and will the sale trigger a re-assessment?
- Why hasn't it sold? Are there any deal-killer items the seller is aware of (foundation, flood, title, zoning, code violations)?
- Is there a deadline driving the sale (1031 exchange, divorce, estate, relocation)? That informs how much negotiation room exists.
- Schools are D-rated, which usually means shorter tenancies and higher turnover. Who's the typical renter profile here, and what's been the actual vacancy rate?
- Crime grade is F in this area — have there been break-ins, vandalism, or insurance claims at this property in the last 3 years? What carrier currently insures it and at what premium?
- What's the average days-on-market for RENTAL listings here right now (not sales)? A rising rental-DOM trend means longer vacancies and softer asking-rent achievability than the comps imply.
- What's the recent tenant-quality profile in this submarket — average credit score on applications, eviction rate, late-payment / NSF rate, and stable-employment percentage? A property-management company in the area should have these aggregated.
- How much new apartment / multifamily construction is in the pipeline within 1–3 miles? Heavy new supply (>2% of stock underway) typically softens rents 12–24 months out; light construction supports rent growth.
Investment metrics
- 1% rule
- 1.64% ✓
- Cap rate
- 12.28%
- Cash-on-cash
- 21.38%
- DSCR
- 1.95
- GRM
- 5.1
CMA / ARV
- ARV (on-the-fly)
- $437,760
- Comps found
- 12
Show comp detail 12 sales within ~0.75 mi
| Address | Dist | Beds/Ba | Sqft | Sold | Price | $/sf | Match |
|---|---|---|---|---|---|---|---|
| 57 Carpenter Ave | 0.29mi | 7/3.0 (+1) | 3,000 (+4%) | 8mo | $460,000 | $153 | 68 |
| 17 Lutheran St | 0.20mi | 6/2.0 | 2,670 (-7%) | 15mo | $285,000 | $107 | 62 |
| 189 Liberty St | 0.23mi | 7/5.0 (+1) | 2,927 (+2%) | 16mo | $565,000 | $193 | 60 |
| 6 Liberty St | 0.39mi | 6/4.0 | 3,075 (+7%) | 7mo | $500,000 | $163 | 60 |
| 145 Renwick St | 0.37mi | 5/3.0 (-1) | 2,760 (-4%) | 14mo | $285,000 | $103 | 59 |
| 60 Johnston St | 0.17mi | 6/2.0 | 2,625 (-9%) | 18mo | $298,000 | $114 | 58 |
| 100 Courtney Ave | 0.50mi | 6/3.0 | 2,772 (-4%) | 18mo | $485,000 | $175 | 55 |
| 16 Lutheran St | 0.17mi | 6/2.0 | 2,508 (-13%) | 13mo | $380,000 | $152 | 55 |
| 11 Liberty St | 0.37mi | 7/3.0 (+1) | 3,024 (+5%) | 17mo | $525,000 | $174 | 55 |
| 181 First St | 0.16mi | 5/2.0 (-1) | 2,450 (-15%) | 15mo | $335,000 | $137 | 46 |
| 298 Liberty St | 0.50mi | 6/3.0 | 2,573 (-11%) | 20mo | $370,000 | $144 | 42 |
| 204 Grand St | 0.53mi | 6/5.0 | 3,254 (+13%) | 12mo | $350,000 | $108 | 36 |
Match score weights: distance 35% · size 25% · config 20% · recency 20%. Top-matched comps best support the ARV.
Projected returns pro-forma
-3.0% appreciation · 0.63% rent growth · sell at horizon
- IRR
- 11.0%
- Equity multiple
- 1.42×
- Total profit
- $53,124
- Equity at exit
- $66,947
- IRR
- 17.9%
- Equity multiple
- 2.31×
- Total profit
- $164,389
- Equity at exit
- $38,821
Cash invested: $125,720 (down + closing). Projections, not guarantees.
Landlord ↔ Tenant lean methodology
- Overall (STATE)
- 15 Strongly Tenant-Friendly
- State New York
- 15 Strongly Tenant-Friendly · D+10
- County
- — inherits STATE
- City
- — inherits STATE
ZIP-level market 12550
- Home prices YoY
- -33.3%
- Rents YoY
- 0.6%
- Active inventory
- 384
- Price-to-rent
- 21.8×
Monthly cashflow live
- Estimated rent
- $7,373 high interval (Pro) →
- Mortgage (P&I)
- −$2,355
- Tax from tax record
- −$1,043 /mo · $12,519/yr
- Insurance
- −$187
- HOA
- −$0
- Vacancy / Maint / Mgmt
- −$1,548
- Net cashflow
- $2,240
Break-even live
Sensitivity live
| Price | -10% $2,494 | -5% $2,367 | +0% $2,240 | +5% $2,113 | +10% $1,986 |
|---|---|---|---|---|---|
| Rent | -10% $1,657 | -5% $1,948 | +0% $2,240 | +5% $2,531 | +10% $2,822 |
| Rate | -1.0pp $2,466 | -0.5pp $2,354 | base $2,240 | +0.5pp $2,123 | +1.0pp $2,005 |
4-unit breakdown (identical units grouped — click to expand)
| Units | Beds | Baths | Est. rent |
|---|---|---|---|
| 2× units | 2 | 1.5 | $3,428 |
| #1 | 2 | 1.5 | $1,714 |
| #2 | 2 | 1.5 | $1,714 |
| 2× units | 3 | 1.5 | $3,946 |
| #3 | 3 | 1.5 | $1,973 |
| #4 | 3 | 1.5 | $1,973 |
| Total (4 units) | $7,373 | ||
UW: 25.0% down · 7.5% · 30yr · 1.5% tax · 5.0% vac · 8.0% maint · 8.0% mgmt
Financing live
Cash to close
- Down payment
- $112,250
- Closing costs
- $13,470
- Reserves months
- —
- Total cash needed
- —
Loan-product check · same deal, 3 products live
Conventional
25% down · 7.5% · 30yr
- Down + closing
- —
- Monthly P&I
- —
- Monthly cashflow
- —
- DSCR
- —
- Eligible?
- —
Personal DTI + credit; lowest rate.
DSCR
20% down · 8.5% · 30yr
- Down + closing
- —
- Monthly P&I
- —
- Monthly cashflow
- —
- DSCR
- —
- Eligible?
- —
No personal income docs; deal must DSCR.
Hard money
10% down · 12.0% · 12mo
- Down + closing
- —
- Monthly P&I
- —
- Monthly cashflow
- —
- DSCR
- —
- Eligible?
- —
Short-term bridge; refi at stabilization.
Rent comps 1 comps
| Address | Beds | Baths | Sqft | Rent | $/sqft | DOM | Units | Dist |
|---|---|---|---|---|---|---|---|---|
| 87 Ellis Ave Newburgh, NY | 5.0 | 2.5 | 2172 | $2,500 | $1.15 | 45d | 1 | 1.18mi |
Listing history 19 events
-
2026-04-13status Pending
-
2026-01-07price $449,000
-
2025-11-12status Active
-
2025-11-12historical
-
2025-09-25price $525,000
-
2025-05-14status Active
-
2025-05-14historical
-
2025-05-06price $649,000
-
2025-03-14price $699,000
-
2024-11-14$800,000 Active
-
2024-05-02$800,000 Active
-
2021-11-10historical
-
2021-05-28$400,000 Active
-
2019-04-15soldstatus $275,000
-
2003-05-20soldstatus $85,000
-
2003-05-19soldstatus $175,000
-
2002-12-02price $185,000
-
2002-12-02historical
-
2002-11-26$85,000
ⓘ Source: listings_history table (triggers on properties + properties_extension) + one-shot
backfill from property_details.listing_events for pre-trigger history.
Tax reassessment forecast NY · Partial reset (capped growth)
- Current annual tax
- $12,519 · $1,043/mo
- Projected year-2 tax
- $12,519 · $1,043/mo
- Expected delta
- $0/yr ($0/mo · 0.0%)
ⓘ Screening estimate from a state-policy table — verify with the county assessor before closing.
Nearby sold comps map
Loading sold comps map…
Walkable amenities ~0.75 mi
Loading nearby amenities…
Taxation est. · year 1
- Rental income
- $88,476
- − Mortgage interest
- −$25,151
- − Property taxes
- −$12,519
- − Insurance
- −$2,245
- − Repairs & maintenance
- −$7,078
- − Management
- −$7,078
- − Depreciation
- −$13,062
- Taxable income
- $21,343
- Est. tax owed @ 24.0%
- −$5,122
- After-tax cash flow
- $21,754/yr
For passive investors: Depreciation is non-cash, so a rental often shows a tax loss while cash-flowing — sheltering income. Rental losses are passive: they offset passive income freely, and up to $25,000/yr can offset ordinary (W-2) income if you actively participate and your MAGI is under $100k (phasing out to $0 by $150k); unused losses carry forward. On sale, claimed depreciation is recaptured at up to 25%, and gains may owe capital-gains tax (a 1031 exchange can defer both). Figures are a year-1 estimate at your 24.0% rate — not tax advice; consult a CPA.
Schools (NCES district)
- District
- Newburgh City School District
- NCES district ID
- 3620700
- Math proficiency
- 33% ▼ -8.00%
- Reading proficiency
- 48% ▲ 10.00%
- Median HH income
- $56,387
- Composite
- 35.46/100
- National rank
- #4927
- State rank
- #500 of 590 in NY
Livability — Newburgh
- Score
- 62/100
- State rank
- #878
- US rank
- #17021
Category grades
Schools grade is shown separately in the Schools card above.
Census & demographics
- Census place
- Newburgh, NY
- County
- Orange County · 267,004 people
- City population
- 55,152
- Metro
- Poughkeepsie-Newburgh-Middletown, NY
- Population (ZIP)
- 55,152
- Household income
- $85,697
- Rent vs Own
- Severe rent burden
- 2412.0
Population outlook (Orange County) Hauer SSP2
- Today (2025)
- 379,830 people
- By 2030
- 378,955 · -0.2%
- By 2040
- 375,444 · -1.2%
- By 2050
- 369,311 · -2.8%
- By 2075
- 354,233 · -6.7%
- By 2100
- 318,150 · -16.2%
Race, ethnicity, and origin ACS 2023
- Neighborhood character
- Diverse neighborhood (Simpson 0.68)
- Race & ethnicity
- Hispanic / Latino 39% White 36% Black 20% Two or more races 12% Asian 2%
- Hispanic origin (detail)
- Mexican 14% Puerto Rican 10% Dominican 2%
- Common ancestry
- Romanian 2% Hispanic 1% Lithuanian 1%
- Foreign-born
- 18% · Canada, Dominican Republic
- Languages at home
- 64% English-only · Spanish 30% French/Haitian/Cajun 1% Other Indo-European 1%
Political lean MEDSL · Orange
- 2024 margin
- Lean R (+8.4) · D 45.8% · R 54.2%
- 2008→2024 swing
- -12.5pp toward R · 2008: 4.1pp · 2024: -8.4pp
- All cycles
- 2024: R+8.4 2020: R+0.2 2016: R+6.5 2012: D+5.2 2008: D+4.1
Not yet ingested
- Civics
- —
Market trends
- HPI YoY
- ▼ -151.93%
- Current HPI
- 304.1046
- Rent YoY
- ▲ 0.63%
- Metro
- Poughkeepsie-Newburgh-Middletown, NY
- State GDP YoY
- ▲ 2.60%
- F500 in state
- 92
Industry mix (Fortune 500 HQ in NY)
| Industry | F500 HQs | Revenue |
|---|---|---|
| Financial Services | 10 | $950B |
|
||
| Consumer Goods | 9 | $162B |
|
||
| Insurance | 4 | $225B |
|
||
| Telecommunications | 2 | $144B |
|
||
| Pharmaceuticals | 2 | $112B |
|
||
| Media / Entertainment | 2 | $69B |
|
||
Price history
+428.2% since first listed19 events — show timeline
- 2026-04-13 Pending — OneKey® MLS as Distributed by MLS Grid
- 2026-01-07 Price Changed $449,000 OneKey® MLS as Distributed by MLS Grid
- 2025-11-12 Relisted — OneKey® MLS as Distributed by MLS Grid
- 2025-11-12 Listing Removed — OneKey® MLS as Distributed by MLS Grid
- 2025-09-25 Price Changed $525,000 OneKey® MLS as Distributed by MLS Grid
- 2025-05-14 Relisted — OneKey® MLS as Distributed by MLS Grid
- 2025-05-14 Listing Removed — OneKey® MLS as Distributed by MLS Grid
- 2025-05-06 Price Changed $649,000 OneKey® MLS as Distributed by MLS Grid
- 2025-03-14 Price Changed $699,000 OneKey® MLS as Distributed by MLS Grid
- 2024-11-14 Listed $800,000 OneKey® MLS as Distributed by MLS Grid
- 2024-05-02 Listed $800,000 OneKey® MLS as Distributed by MLS Grid
- 2021-11-10 Listing Removed — OneKey® MLS as Distributed by MLS Grid
- 2021-05-28 Listed $400,000 OneKey® MLS as Distributed by MLS Grid
- 2019-04-15 Sold (Public Records) $275,000 Public Records
- 2003-05-20 Sold (MLS) $85,000 HGMLS
- 2003-05-19 Sold (Public Records) $175,000 Public Records
- 2002-12-02 Delisted — HGMLS
- 2002-12-02 Price Changed $185,000 HGMLS
- 2002-11-26 Listed $85,000 HGMLS
Property tax history
+10.7%/yrLatest (2025): $12,519 · -3.5% YoY. Source: county tax records.
Cash-flow waterfall
monthlySold comps — $/sqft
last 12 mo · ≤1 miLoading sold comps…