 🏗️ New Construction
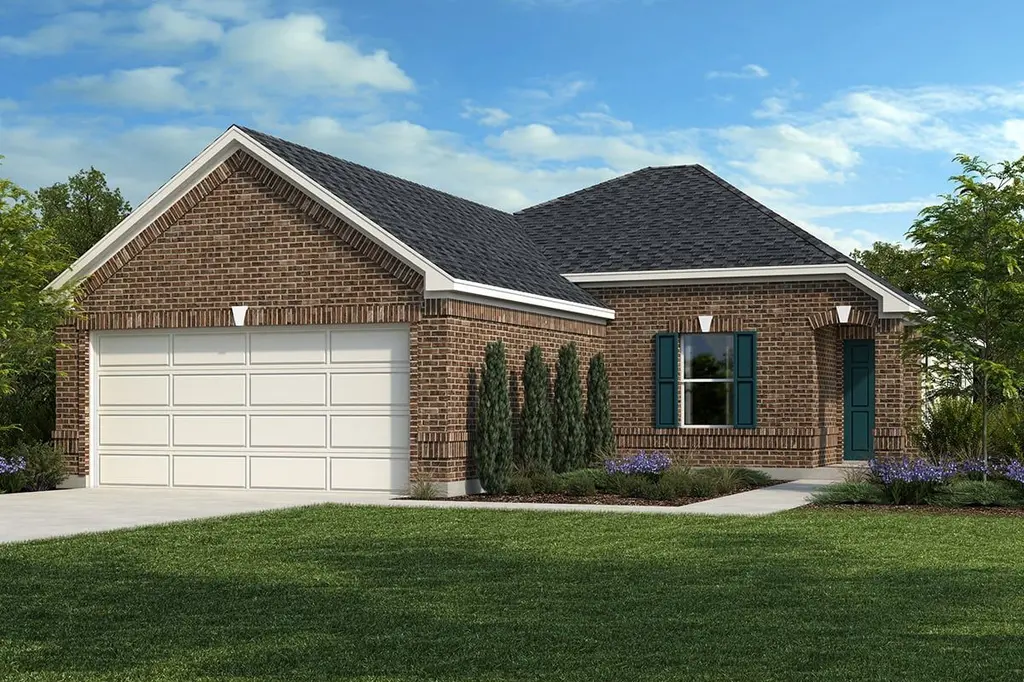
Plan 1523 Plan · Manvel, TX
Flood risk 1/10 · Minimal
- FEMA flood zone
- X (unshaded)
- Chance of flooding over 30 yrs
- 0.0%
- Est. flood insurance / yr
- $507 – $1,088
Fire risk 5/10 · Moderate
- Est. fire insurance / yr
- $1,222 – $2,270
Heat risk 9/10 · Severe
- Hot days now (above 110°F)
- 7 days/yr
- Hot days in 30 yrs
- 23 days/yr
Wind risk 9/10 · Severe
- Chance of severe wind over 30 yrs
- 99.0%
Air-quality risk 2/10 · Minimal
- Unhealthy air days now
- 1 days/yr
- Unhealthy air days in 30 yrs
- 2 days/yr
Risk factors via First Street. Map © Google.
Why this score? — see what drove the D grade
The composite is a weighted blend of 9 inputs, each scored 0–100. Each bar is that input's sub-score; the figure is the points it added to the 100-point composite (weight × sub-score).
- Cash flow +11.4/30.0
- ARV discount +7.5/15.0
- Condition / age +4.0/5.0
- Schools +3.9/10.0
- Livability +3.4/5.0
- 1% rule +3.3/10.0
- DSCR +3.3/10.0
- Rent growth +3.2/5.0
- Appreciation +0.0/10.0
$260,995
🖨 Deal sheet (PDF) 📄 Offer letter ✓ Due diligence
Listing remarks MLS
* Stainless steel appliances with 2-yr. warranty * Open floor plan * Granite kitchen countertops * WaterSense® labeled faucets * 5-panel interior doors * Tankless water heater * Gas range * Kitchen USB charging port * Den * Extra storage space * Low-E windows * ENERGY STAR® certified home * Commuter-friendly location * Near local schools * Close to family friendly parks * Close to popular restaurants * Great shopping nearby * Outdoor recreation nearby
Key facts
- Gas range
- 2 garage spots
- Listed 112 days
Tags
Neighborhood map
What this means for you Summary
Snapshot
- This is a 3-bed/2.0-bath single-family listed at $261k. Condition is rated good.
Deal economics
- At list price, monthly cash flow is $-93 ($-1k/yr) — negative.
- To cash-flow at today's rent, offer at most $257k (1.6% below list).
- To meet the 1% rule (rent ≥ 1% of price), the offer needs to be $225k (13.9% below list).
- Recommended offer: $225k (13.9% below list) — sets the bar for 1% rule.
- Cap rate 5.9% vs local median 2.2% in Manvel — top-decile yield for the area; either an underpriced asset or a hidden risk that comps aren't pricing in. Stress-test before assuming the spread holds.
Location & tenants
- Location reads 67/100 on livability (#544 in TX) — a middle-class / working-renter tenant base. Strengths: crime A+, employment A+, housing A+; Watch: amenities F, commute F, health & safety F.
- Alvin ISD (suburban): math 39% / reading 48% proficiency, ranked #255 of 826 in TX (top 31%) — families likely to look elsewhere, expect single-tenant / working-renter base with shorter leases.
- Zoned schools: Alvin H S (math 35% / reading 48%, grade F, #767 of 1,632 statewide, top 47%, 2,821 students, 65% FRL) — zoned schools average 65% FRL vs 48% district-wide (16 pts higher); higher-poverty schools than district average — tighter screening recommended.
- Market conditions: Rents rising (+2.8%/yr); 1261 active listings in the ZIP; 3 comparable units currently listed for rent nearby; rentals lingering (median 46d on market — plan ~5-8 weeks vacancy on turnover, expect pricing pressure); 67% of comp listings sitting > 30 days — soft ceiling on asking rent; high-income renter base; 3,960 units permitted in Brazoria County in 2024 (593 in 5+ unit buildings).
Forward outlook
- Local home prices are declining (-3.0%/yr); year-one equity from $2k of loan paydown is wiped out by about $8k of value loss. Plan a longer hold.
- Brazoria County population projected at +44% by 2050 — long-run rental-demand tailwind backs the buy-and-hold thesis.
Negotiation context
- It's been on market 113 days — a 9% lower offer ($238k) is reasonable based on typical stale-listing flexibility.
Risks & watch-outs
- Climate carrying-cost: severe wind risk, 99% chance of damaging wind over 30y; moderate wildfire risk; extreme-heat days projected 7→23/yr by 2055 (HVAC capex compounding) — expect insurance premiums to compound above CPI over the hold.
Questions for the listing agent
- What do current leases actually rent for vs. the listed asking? Can we see a recent rent roll and the last 12 months of T-12 income?
- It's been on market 113 days. Have you received any prior offers? Is the seller open to a 14% concession, seller financing, or rate buy-down credit?
- Why hasn't it sold? Are there any deal-killer items the seller is aware of (foundation, flood, title, zoning, code violations)?
- Is there a deadline driving the sale (1031 exchange, divorce, estate, relocation)? That informs how much negotiation room exists.
- The area grade is low — what's the realistic commute time and amenity access for the typical tenant pool here? Any planned neighborhood developments (good or bad) we should know about?
- What's the average days-on-market for RENTAL listings here right now (not sales)? A rising rental-DOM trend means longer vacancies and softer asking-rent achievability than the comps imply.
- What's the recent tenant-quality profile in this submarket — average credit score on applications, eviction rate, late-payment / NSF rate, and stable-employment percentage? A property-management company in the area should have these aggregated.
- How much new for-sale + rental construction is in the pipeline within 1–3 miles? Heavy new supply typically softens prices + rents 12–24 months out; constrained supply supports both.
Investment metrics
- 1% rule
- 0.83% ✗
- Cap rate
- 5.88%
- Cash-on-cash
- -1.48%
- DSCR
- 0.93
- GRM
- 10.0
CMA / ARV
- ARV (median comp)
- $270,416
- List price
- $260,995
- Delta
- -3.48%
- Verdict
- FAIR
- Comps
- 20 within 1.0 mi
Show comp detail 12 sales within ~0.75 mi
| Address | Dist | Beds/Ba | Sqft | Sold | Price | $/sf | Match |
|---|---|---|---|---|---|---|---|
| 54 Rodeo Crest Dr | 0.29mi | 3/2.0 | 1,530 (+0%) | 3mo | $235,000 | $154 | 83 |
| 8 Santa Clara Dr | 0.22mi | 3/2.0 | 1,530 (+0%) | 7mo | $275,000 | $180 | 83 |
| 16 Santa Clara Dr | 0.26mi | 3/2.0 | 1,530 (+0%) | 15mo | $285,000 | $186 | 74 |
| 75 Rodeo Dr | 0.26mi | 4/2.0 (+1) | 1,575 (+3%) | 10mo | $240,000 | $152 | 69 |
| 23 Rodeo Bend Dr | 0.23mi | 3/2.0 | 1,720 (+13%) | 16mo | $295,500 | $172 | 55 |
| 55 San Simeon Dr | 0.40mi | 3/2.0 | 1,726 (+13%) | 8mo | $249,999 | $145 | 53 |
| 7 Rodeo Bend Dr | 0.17mi | 3/2.0 | 1,720 (+13%) | 21mo | $295,500 | $172 | 53 |
| 18 Carmel Chase Ct | 0.56mi | 3/2.0 | 1,696 (+11%) | 5mo | $295,000 | $174 | 51 |
| 13 Palmdale Ln | 0.24mi | 3/2.5 | 1,724 (+13%) | 18mo | $267,000 | $155 | 50 |
| 141 Rodeo Dr | 0.58mi | 3/2.5 | 1,392 (-9%) | 20mo | $259,950 | $187 | 39 |
| 38 Mira Loma Dr | 0.43mi | 4/2.0 (+1) | 1,731 (+14%) | 19mo | $254,900 | $147 | 36 |
| 3506 Windmill Palm Dr | 0.66mi | 4/3.0 (+1) | 1,746 (+15%) | 5mo | $379,900 | $218 | 31 |
Match score weights: distance 35% · size 25% · config 20% · recency 20%. Top-matched comps best support the ARV.
Projected returns pro-forma
-3.0% appreciation · 2.77% rent growth · sell at horizon
- IRR
- -19.0%
- Equity multiple
- 0.34×
- Total profit
- $-50,240
- Equity at exit
- $40,320
- IRR
- -12.0%
- Equity multiple
- 0.30×
- Total profit
- $-53,375
- Equity at exit
- $23,381
Cash invested: $75,716 (down + closing). Projections, not guarantees.
Landlord ↔ Tenant lean methodology
- Overall (STATE)
- 87 Strongly Landlord-Friendly
- State Texas
- 87 Strongly Landlord-Friendly · R+5
- County
- — inherits STATE
- City
- — inherits STATE
ZIP-level market 77578
- Rents YoY
- 2.8%
- Active inventory
- 1261
- Price-to-rent
- 9.7×
Monthly cashflow live
- Estimated rent
- $2,248 medium interval (Pro) →
- Mortgage (P&I)
- −$1,418
- Tax est. 1.5%
- −$338 /mo · $4,056/yr
- Insurance
- −$113
- HOA
- −$0
- Vacancy / Maint / Mgmt
- −$472
- Net cashflow
- $-93
Break-even live
Sensitivity live
| Price | -10% $94 | -5% $0 | +0% $-93 | +5% $-187 | +10% $-280 |
|---|---|---|---|---|---|
| Rent | -10% $-271 | -5% $-182 | +0% $-93 | +5% $-4 | +10% $84 |
| Rate | -1.0pp $43 | -0.5pp $-24 | base $-93 | +0.5pp $-163 | +1.0pp $-235 |
UW: 25.0% down · 7.5% · 30yr · 1.5% tax · 5.0% vac · 8.0% maint · 8.0% mgmt
Financing live
Cash to close
- Down payment
- $67,604
- Closing costs
- $8,112
- Reserves months
- —
- Total cash needed
- —
Loan-product check · same deal, 3 products live
Conventional
25% down · 7.5% · 30yr
- Down + closing
- —
- Monthly P&I
- —
- Monthly cashflow
- —
- DSCR
- —
- Eligible?
- —
Personal DTI + credit; lowest rate.
DSCR
20% down · 8.5% · 30yr
- Down + closing
- —
- Monthly P&I
- —
- Monthly cashflow
- —
- DSCR
- —
- Eligible?
- —
No personal income docs; deal must DSCR.
Hard money
10% down · 12.0% · 12mo
- Down + closing
- —
- Monthly P&I
- —
- Monthly cashflow
- —
- DSCR
- —
- Eligible?
- —
Short-term bridge; refi at stabilization.
Rent comps 3 comps
| Address | Beds | Baths | Sqft | Rent | $/sqft | DOM | Units | Dist |
|---|---|---|---|---|---|---|---|---|
| 121 Rodeo Dr Manvel, TX | 3.0 | 3.0 | 2015 | $2,300 | $1.14 | 45d | 1 | 0.49mi |
| 21 Wheeler Ridge Cir Manvel, TX | 3.0 | 2.0 | 1275 | $1,875 | $1.47 | 7d | 1 | 0.86mi |
| 57 Spring Ln Manvel, TX | 4.0 | 2.0 | 1875 | $2,450 | $1.31 | 45d | 1 | 0.95mi |
Listing history 18 events
-
2026-06-21days on market $260,995 Active 113 DOM
-
2026-06-18days on market $260,995 Active 110 DOM
-
2026-06-17days on market $260,995 Active 109 DOM
-
2026-06-16days on market $260,995 Active 108 DOM
-
2026-06-15days on market $260,995 Active 107 DOM
-
2026-06-13days on market $260,995 Active 105 DOM
-
2026-06-13days on market $260,995 Active 104 DOM
-
2026-06-09days on market $260,995 Active 101 DOM
-
2026-06-08days on market $260,995 Active 100 DOM
-
2026-06-07days on market $260,995 Active 99 DOM
-
2026-06-04days on market $260,995 Active 96 DOM
-
2026-06-03days on market $260,995 Active 95 DOM
-
2026-06-02days on market $260,995 Active 94 DOM
-
2026-06-01days on market $260,995 Active 93 DOM
-
2026-05-31days on market $260,995 Active 92 DOM
-
2026-04-15price $265,995 498-char remark
Show marketing remark (498 chars)
* Stainless steel appliances with 2-yr. warranty * Open floor plan * Granite kitchen countertops * WaterSense® labeled faucets * 5-panel interior doors * Tankless water heater * Gas range * Kitchen USB charging port * Den * Extra storage space * Low-E windows * ENERGY STAR® certified home * Commuter-friendly location * Near local schools * Close to family friendly parks * Close to popular restaurants * Great shopping nearby * Outdoor recreation nearby
-
2026-03-07price $275,995 498-char remark
Show marketing remark (498 chars)
* Stainless steel appliances with 2-yr. warranty * Open floor plan * Granite kitchen countertops * WaterSense® labeled faucets * 5-panel interior doors * Tankless water heater * Gas range * Kitchen USB charging port * Den * Extra storage space * Low-E windows * ENERGY STAR® certified home * Commuter-friendly location * Near local schools * Close to family friendly parks * Close to popular restaurants * Great shopping nearby * Outdoor recreation nearby
-
2026-03-01$270,995 Active 498-char remark
Show marketing remark (498 chars)
* Stainless steel appliances with 2-yr. warranty * Open floor plan * Granite kitchen countertops * WaterSense® labeled faucets * 5-panel interior doors * Tankless water heater * Gas range * Kitchen USB charging port * Den * Extra storage space * Low-E windows * ENERGY STAR® certified home * Commuter-friendly location * Near local schools * Close to family friendly parks * Close to popular restaurants * Great shopping nearby * Outdoor recreation nearby
ⓘ Source: listings_history table (triggers on properties + properties_extension) + one-shot
backfill from property_details.listing_events for pre-trigger history.
Climate risk First Street
- Flood 1/10 Low FEMA zone X (unshaded) · 0% chance over 30 yrs
- Wildfire 5/10 Major
- Heat 9/10 Extreme 7 d/yr ≥110°F today · 23 d/yr by 30 yrs out
- Wind 9/10 Extreme 99% chance of damaging wind over 30 yrs
- Air quality 2/10 Low 1 unhealthy d/yr today · 2 by 30 yrs out
Nearby sold comps map
Loading sold comps map…
Walkable amenities ~0.75 mi
Loading nearby amenities…
Taxation est. · year 1
- Rental income
- $26,971
- − Mortgage interest
- −$15,147
- − Property taxes
- −$4,056
- − Insurance
- −$1,352
- − Repairs & maintenance
- −$2,158
- − Management
- −$2,158
- − Depreciation
- −$7,867
- Taxable loss
- −$5,767
- Est. tax savings @ 24.0%
- +$1,384
- After-tax cash flow
- $266/yr
For passive investors: Depreciation is non-cash, so a rental often shows a tax loss while cash-flowing — sheltering income. Rental losses are passive: they offset passive income freely, and up to $25,000/yr can offset ordinary (W-2) income if you actively participate and your MAGI is under $100k (phasing out to $0 by $150k); unused losses carry forward. On sale, claimed depreciation is recaptured at up to 25%, and gains may owe capital-gains tax (a 1031 exchange can defer both). Figures are a year-1 estimate at your 24.0% rate — not tax advice; consult a CPA.
Condition & rehab AI · 1 photo
This home is in excellent condition with no visible repairs needed. It offers a good ROI with updates that can enhance both resale and rental value.
Value-add opportunities
- Both Paint interior walls — Fresh paint can enhance curb appeal and interior aesthetics
- Both Replace outdoor lighting — Modern lighting can improve curb appeal and safety
- Both Install smart home devices — Smart home devices can increase convenience and property value
Renovation cost estimate screening
Value-add ROI direction
- Both Paint interior walls — Fresh paint can enhance curb appeal and interior aesthetics ↑
- Both Replace outdoor lighting — Modern lighting can improve curb appeal and safety ↑
- Both Install smart home devices — Smart home devices can increase convenience and property value ↑
ⓘ Cost ranges are severity-bucket heuristics (US national rule-of-thumb). Get contractor quotes + a written scope before underwriting a rehab budget.
Schools (NCES district)
- District
- Alvin ISD
- NCES district ID
- 4808090
- Math proficiency
- 39% ▼ -11.00%
- Reading proficiency
- 48% ▬ 0.00%
- Median HH income
- $66,740
- Composite
- 38.96/100
- National rank
- #4080
- State rank
- #255 of 826 in TX
Livability — Manvel
- Score
- 67/100
- State rank
- #544
- US rank
- #10576
Category grades
Schools grade is shown separately in the Schools card above.
Census & demographics
- Census place
- Manvel, TX
- County
- Brazoria County · 374,982 people
- City population
- 30,210
- Metro
- Houston-The Woodlands-Sugar Land, TX
- Population (ZIP)
- 30,210
- Household income
- $134,016
- Rent vs Own
- Severe rent burden
- 93.0
Population outlook (Brazoria County) Hauer SSP2
- Today (2025)
- 420,414 people
- By 2030
- 457,585 · +8.8%
- By 2040
- 532,232 · +26.6%
- By 2050
- 605,399 · +44.0%
- By 2075
- 779,358 · +85.4%
- By 2100
- 883,759 · +110.2%
Race, ethnicity, and origin ACS 2023
- Neighborhood character
- Highly diverse neighborhood (Simpson 0.73)
- Race & ethnicity
- White 36% Black 30% Hispanic / Latino 22% Two or more races 15% Asian 9%
- Hispanic origin (detail)
- Mexican 18%
- Common ancestry
- Norwegian 2% Subsaharan African 2% Scotch-Irish 1%
- Foreign-born
- 15% · Canada, China, Vietnam
- Languages at home
- 78% English-only · Spanish 13% Tagalog/Filipino 2% Vietnamese 2%
Political lean MEDSL · Brazoria
- 2024 margin
- R (+19.7) · D 39.5% · R 59.2% · Other 1.3%
- 2008→2024 swing
- +9.9pp toward D · 2008: -29.6pp · 2024: -19.7pp
- All cycles
- 2024: R+19.7 2020: R+18.2 2016: R+24.6 2012: R+34.2 2008: R+29.6
Not yet ingested
- Civics
- —
Market trends
- HPI YoY
- ▼ -154.15%
- Current HPI
- 218.4264
- Rent YoY
- ▲ 2.77%
- Metro
- Houston-The Woodlands-Sugar Land, TX
- State GDP YoY
- ▲ 3.95%
- F500 in state
- 110
Industry mix (Fortune 500 HQ in TX)
| Industry | F500 HQs | Revenue |
|---|---|---|
| Energy | 16 | $1,198B |
|
||
| Technology | 5 | $198B |
|
||
| Engineering / Construction | 4 | $72B |
|
||
| Energy Services | 3 | $60B |
|
||
| Utilities | 3 | $41B |
|
||
| Healthcare | 2 | $330B |
|
||
Price history
-1.8% since first listed3 events — show timeline
- 2026-04-15 Price Changed $265,995 Zillow
- 2026-03-07 Price Changed $275,995 Zillow
- 2026-03-01 Listed $270,995 Zillow
Cash-flow waterfall
monthlySold comps — $/sqft
last 12 mo · ≤1 miLoading sold comps…