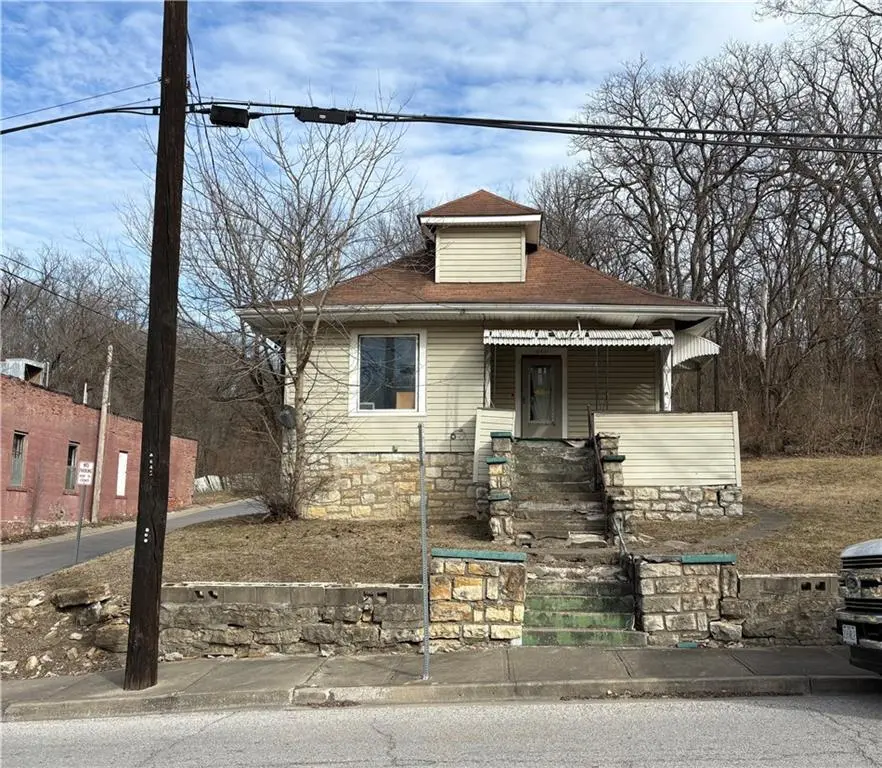
643 N Main St · Excelsior Springs, MO
Flood risk 1/10 · Minimal
- FEMA flood zone
- X (unshaded)
- Chance of flooding over 30 yrs
- 0.0%
- Est. flood insurance / yr
- $473 – $860
Fire risk 3/10 · Minor
- Est. fire insurance / yr
- $1,054 – $1,958
Heat risk 4/10 · Minor
- Hot days now (above 106°F)
- 7 days/yr
- Hot days in 30 yrs
- 16 days/yr
Wind risk 2/10 · Minimal
- Chance of severe wind over 30 yrs
- —
Air-quality risk 3/10 · Minor
- Unhealthy air days now
- 3 days/yr
- Unhealthy air days in 30 yrs
- 3 days/yr
Risk factors via First Street. Map © Google.
Why this score? — see what drove the B- grade
The composite is a weighted blend of 9 inputs, each scored 0–100. Each bar is that input's sub-score; the figure is the points it added to the 100-point composite (weight × sub-score).
- Cash flow +30.0/30.0
- 1% rule +10.0/10.0
- DSCR +10.0/10.0
- ARV discount +7.5/15.0
- Livability +3.4/5.0
- Schools +2.9/10.0
- Rent growth +2.5/5.0
- Condition / age +2.5/5.0
- Appreciation +0.0/10.0
$49,000
🖨 Deal sheet 📄 Offer letter ✓ Due diligence
Listing remarks
Bring your ideas! This one is ready to rehab! 3 lots available as well 2 next door and 1 behind the house, 3 additional lots can be purchased. 2 directly next door and one large lot behind the house at 643 main. please see mls#'s on the FOUR PARCELS: 2624373,2624378,2624376,2624381
Key facts
- 4,356 sq ft lot
- Built 1885
- Listed 4 days
Property features AI
Finance
- Other: Living area reported as 962 above-grade; Bungalow-style home
- Financial info: Annual tax amount listed (reported)
- HOA & community: No association fees; No maintenance provided
Exterior
- Parking: Off-street parking
- Utilities: Public water; Public sewer
- Home design: Single family residence (attached); Residential property; Composition roof
- Construction: Stone and frame construction; About 101+ years old
- Exterior features: Not in a flood plain; Approximately 0.1 acre lot
Interior
- Bedrooms: 2 bedrooms
- Bathrooms: 1 full bathroom
- Heating & cooling: Natural gas heating; Other cooling
- Interior features: Bungalow floor plan; Unfinished stone/rock basement
Neighborhood map
What this means for you Summary
Snapshot
- This is a 2-bed/1.0-bath single-family listed at $49k.
Deal economics
- At list price, monthly cash flow is $582 ($7k/yr) — positive.
- The deal already cash-flows at list — no discount required.
- Meets the 1% rule at list price ($1k rent vs $49k).
- Cap rate 20.5% vs local median 4.6% in Excelsior Springs — top-decile yield for the area; either an underpriced asset or a hidden risk that comps aren't pricing in. Stress-test before assuming the spread holds.
Location & tenants
- Location reads 67/100 on livability (#228 in MO) — a middle-class / working-renter tenant base. Strengths: cost of living A+, housing A+; Watch: schools D+, crime D+, amenities F.
- Excelsior Springs 40 (town): math 27% / reading 40% proficiency, ranked #225 of 324 in MO (top 69%) — families likely to look elsewhere, expect single-tenant / working-renter base with shorter leases.
- Market conditions: 122 active listings in the ZIP; 5 comparable units currently listed for rent nearby; rentals leasing fast (median 2d on market — plan ~1-2 weeks tenant-placement turnaround); solid renter incomes; 341 units permitted in Clay County in 2024 (40 in 5+ unit buildings).
Forward outlook
- Local home prices are declining (-3.0%/yr); year-one equity from $339 of loan paydown is wiped out by about $1k of value loss. Plan a longer hold.
- Clay County population projected at +24% by 2050 — long-run rental-demand tailwind backs the buy-and-hold thesis.
- At projected returns (-3.0% appreciation + 3.0% rent growth), your $14k cash investment doubles in ~3 years — after that, you're playing with house money.
Negotiation context
- Only 4 days on market — expect competitive offers; lowballing is unlikely to land.
Risks & watch-outs
- Watch-outs: property tax is 3.3% of price; built in 1885 — expect roof / HVAC / electrical / plumbing capex.
Questions for the listing agent
- Built in 1885 — when were the roof, HVAC, electrical panel, plumbing, and water heater last replaced?
- Property tax is high relative to price — has the assessment been appealed recently, and will the sale trigger a re-assessment?
- Is there a deadline driving the sale (1031 exchange, divorce, estate, relocation)? That informs how much negotiation room exists.
- Schools are D-rated, which usually means shorter tenancies and higher turnover. Who's the typical renter profile here, and what's been the actual vacancy rate?
- Crime grade is D in this area — have there been break-ins, vandalism, or insurance claims at this property in the last 3 years? What carrier currently insures it and at what premium?
- What's the average days-on-market for RENTAL listings here right now (not sales)? A rising rental-DOM trend means longer vacancies and softer asking-rent achievability than the comps imply.
- What's the recent tenant-quality profile in this submarket — average credit score on applications, eviction rate, late-payment / NSF rate, and stable-employment percentage? A property-management company in the area should have these aggregated.
- How much new for-sale + rental construction is in the pipeline within 1–3 miles? Heavy new supply typically softens prices + rents 12–24 months out; constrained supply supports both.
Investment metrics
- 1% rule
- 2.56% ✓
- Cap rate
- 20.55%
- Cash-on-cash
- 50.92%
- DSCR
- 3.27
- GRM
- 3.2
CMA / ARV
- ARV (on-the-fly)
- $175,084
- Comps found
- 12
Show comp detail 12 sales within ~0.75 mi
| Address | Dist | Beds/Ba | Sqft | Sold | Price | $/sf | Match |
|---|---|---|---|---|---|---|---|
| 207 Kibler Rd | 0.41mi | 2/1.0 | 960 (-0%) | 4mo | $175,000 | $182 | 78 |
| 408 E Excelsior St | 0.34mi | 2/1.0 | 974 (+1%) | 10mo | $22,900 | $24 | 73 |
| 724 Elmwood St | 0.63mi | 2/1.0 | 955 (-1%) | 3mo | $169,000 | $177 | 67 |
| 128 Wildwood Ave | 0.51mi | 2/1.0 | 920 (-4%) | 3mo | $115,000 | $125 | 66 |
| 725 Ley St | 0.58mi | 3/1.0 (+1) | 974 (+1%) | 0mo | $185,900 | $191 | 66 |
| 815 Wilhite St | 0.54mi | 3/1.0 (+1) | 944 (-2%) | 3mo | $180,000 | $191 | 64 |
| 116 Greenwood Ave | 0.48mi | 3/1.0 (+1) | 920 (-4%) | 8mo | $169,900 | $185 | 59 |
| 600 Centralia Ave | 0.38mi | 3/1.0 (+1) | 880 (-8%) | 7mo | $185,000 | $210 | 57 |
| 625 Benton Ave | 0.57mi | 2/1.0 | 1,050 (+9%) | 6mo | $69,750 | $66 | 53 |
| 729 Hazel St | 0.56mi | 3/1.0 (+1) | 894 (-7%) | 7mo | $45,000 | $50 | 51 |
| 316 May St | 0.73mi | 2/1.0 | 864 (-10%) | 7mo | $180,000 | $208 | 43 |
| 1004 Hickory St | 0.68mi | 3/1.0 (+1) | 1,100 (+14%) | 1mo | $175,000 | $159 | 39 |
Match score weights: distance 35% · size 25% · config 20% · recency 20%. Top-matched comps best support the ARV.
Projected returns pro-forma
-3.0% appreciation · 3.0% rent growth · sell at horizon
- IRR
- 48.8%
- Equity multiple
- 3.13×
- Total profit
- $29,199
- Equity at exit
- $7,306
- IRR
- 54.4%
- Equity multiple
- 6.35×
- Total profit
- $73,425
- Equity at exit
- $4,237
Cash invested: $13,720 (down + closing). Projections, not guarantees.
Landlord ↔ Tenant lean methodology
- Overall (STATE)
- 81 Strongly Landlord-Friendly
- State Missouri
- 81 Strongly Landlord-Friendly · R+10
- County
- — inherits STATE
- City
- — inherits STATE
ZIP-level market 64024
- Home prices YoY
- -15.3%
- Active inventory
- 122
- Price-to-rent
- 3.2×
Monthly cashflow live
- Estimated rent
- $1,257 high interval (Pro) →
- Mortgage (P&I)
- −$257
- Tax from tax record
- −$133 /mo · $1,599/yr
- Insurance
- −$20
- HOA
- −$0
- Vacancy / Maint / Mgmt
- −$264
- Net cashflow
- $582
Break-even live
UW: 25.0% down · 7.5% · 30yr · 1.5% tax · 5.0% vac · 8.0% maint · 8.0% mgmt
Financing live
Cash to close
- Down payment
- $12,250
- Closing costs
- $1,470
- Reserves months
- —
- Total cash needed
- —
Loan-product check · same deal, 3 products live
Conventional
25% down · 7.5% · 30yr
- Down + closing
- —
- Monthly P&I
- —
- Monthly cashflow
- —
- DSCR
- —
- Eligible?
- —
Personal DTI + credit; lowest rate.
DSCR
20% down · 8.5% · 30yr
- Down + closing
- —
- Monthly P&I
- —
- Monthly cashflow
- —
- DSCR
- —
- Eligible?
- —
No personal income docs; deal must DSCR.
Hard money
10% down · 12.0% · 12mo
- Down + closing
- —
- Monthly P&I
- —
- Monthly cashflow
- —
- DSCR
- —
- Eligible?
- —
Short-term bridge; refi at stabilization.
Rent comps 5 comps
| Address | Beds | Baths | Sqft | Rent | $/sqft | DOM | Units | Dist |
|---|---|---|---|---|---|---|---|---|
| 117 South St Excelsior Springs, MO | 1.0 | 1.0 | 602 | $900 | $1.49 | 1d | 2 | 0.42mi |
| 410 N Titus Ave Excelsior Springs, MO | 3.0 | 2.0 | 910 | $1,476 | $1.62 | 43d | 1 | 0.70mi |
| 317 Woods St Excelsior Springs, MO | 2.0 | 1.0 | 884 | $1,350 | $1.53 | 1d | 1 | 0.76mi |
| 1406 Magnolia W Excelsior Springs, MO | 2.0 | 1.0 | 750 | $895 | $1.19 | 21d | 2 | 0.94mi |
| 701 Tiger Dr Excelsior Springs, MO | 2.0 | 1.5 | 800 | $1,250 | $1.56 | 1d | 1 | 1.13mi |
Listing history 5 events
-
2026-06-10status $49,000 Pending 4 DOM
-
2026-06-09days on market $49,000 Active 4 DOM
-
2026-06-08days on market $49,000 Active 3 DOM
-
2026-06-07remarks 284-char remark
-
2026-06-07$49,000 Active 2 DOM
ⓘ Source: listings_history table (triggers on properties + properties_extension) + one-shot
backfill from property_details.listing_events for pre-trigger history.
Tax reassessment forecast MO · Resets to sale price
- Current annual tax
- $1,599 · $133/mo
- Projected year-2 tax
- $1,599 · $133/mo
- Expected delta
- $0/yr ($0/mo · -0.0%)
ⓘ Screening estimate from a state-policy table — verify with the county assessor before closing.
Climate risk First Street
- Flood 1/10 Low FEMA zone X (unshaded) · 0% chance over 30 yrs
- Wildfire 3/10 Moderate
- Heat 4/10 Moderate 7 d/yr ≥106°F today · 16 d/yr by 30 yrs out
- Wind 2/10 Low
- Air quality 3/10 Moderate 3 unhealthy d/yr today · 3 by 30 yrs out
Nearby sold comps map
Loading sold comps map…
Walkable amenities ~0.75 mi
Loading nearby amenities…
Taxation est. · year 1
- Rental income
- $15,080
- − Mortgage interest
- −$2,745
- − Property taxes
- −$1,599
- − Insurance
- −$245
- − Repairs & maintenance
- −$1,206
- − Management
- −$1,206
- − Depreciation
- −$1,425
- Taxable income
- $6,653
- Est. tax owed @ 24.0%
- −$1,597
- After-tax cash flow
- $5,389/yr
For passive investors: Depreciation is non-cash, so a rental often shows a tax loss while cash-flowing — sheltering income. Rental losses are passive: they offset passive income freely, and up to $25,000/yr can offset ordinary (W-2) income if you actively participate and your MAGI is under $100k (phasing out to $0 by $150k); unused losses carry forward. On sale, claimed depreciation is recaptured at up to 25%, and gains may owe capital-gains tax (a 1031 exchange can defer both). Figures are a year-1 estimate at your 24.0% rate — not tax advice; consult a CPA.
Schools (NCES district)
- District
- Excelsior Springs 40
- NCES district ID
- 2911650
- Math proficiency
- 27% ▼ -6.00%
- Reading proficiency
- 40% ▼ -1.00%
- Median HH income
- $52,747
- Composite
- 29.32/100
- National rank
- #6548
- State rank
- #225 of 324 in MO
Livability — Excelsior Springs
- Score
- 67/100
- State rank
- #228
- US rank
- #11166
Category grades
Schools grade is shown separately in the Schools card above.
Census & demographics
- Census place
- Excelsior Springs, MO
- County
- Clay County · 220,651 people
- City population
- 15,574
- Metro
- Kansas City, MO-KS
- Population (ZIP)
- 15,574
- Household income
- $77,895
- Rent vs Own
- Severe rent burden
- 329.0
Population outlook (Clay County) Hauer SSP2
- Today (2025)
- 266,022 people
- By 2030
- 280,057 · +5.3%
- By 2040
- 306,153 · +15.1%
- By 2050
- 328,630 · +23.5%
- By 2075
- 375,182 · +41.0%
- By 2100
- 392,861 · +47.7%
Race, ethnicity, and origin ACS 2023
- Neighborhood character
- Predominantly White (85%)
- Race & ethnicity
- White 85% Two or more races 7% Hispanic / Latino 6% Black 3% Native American 1%
- Hispanic origin (detail)
- Mexican 4% Cuban 2%
- Common ancestry
- Italian 2% Serbian 2% Portuguese 1%
- Foreign-born
- 3% · Canada, China
- Languages at home
- 95% English-only · Spanish 3%
Political lean MEDSL · Clay
- 2024 margin
- Lean R (+5.6) · D 46.4% · R 52.0% · Other 1.6%
- 2008→2024 swing
- -4.9pp toward R · 2008: -0.7pp · 2024: -5.6pp
- All cycles
- 2024: R+5.6 2020: R+4.1 2016: R+11.1 2012: R+8.4 2008: R+0.7
Not yet ingested
- Civics
- —
Market trends
- HPI YoY
- ▼ -54.83%
- Current HPI
- 302.9184
- Rent YoY
- —
- Metro
- Kansas City, MO-KS
- State GDP YoY
- ▲ 1.84%
- F500 in state
- 20
Industry mix (Fortune 500 HQ in MO)
| Industry | F500 HQs | Revenue |
|---|---|---|
| Healthcare | 1 | $163B |
|
||
| Insurance | 1 | $21B |
|
||
| Industrial Technology | 1 | $17B |
|
||
| Retail | 1 | $16B |
|
||
| Industrial Distribution | 1 | $10B |
|
||
| Utilities | 1 | $9B |
|
||
Price history
1 event — show timeline
- 2026-06-05 Listed $49,000 Heartland MLS as Distributed by MLS Grid
Property tax history
+6.1%/yrLatest (2025): $1,599 · +7.2% YoY. Source: county tax records.
Cash-flow waterfall
monthlySold comps — $/sqft
last 12 mo · ≤1 miLoading sold comps…