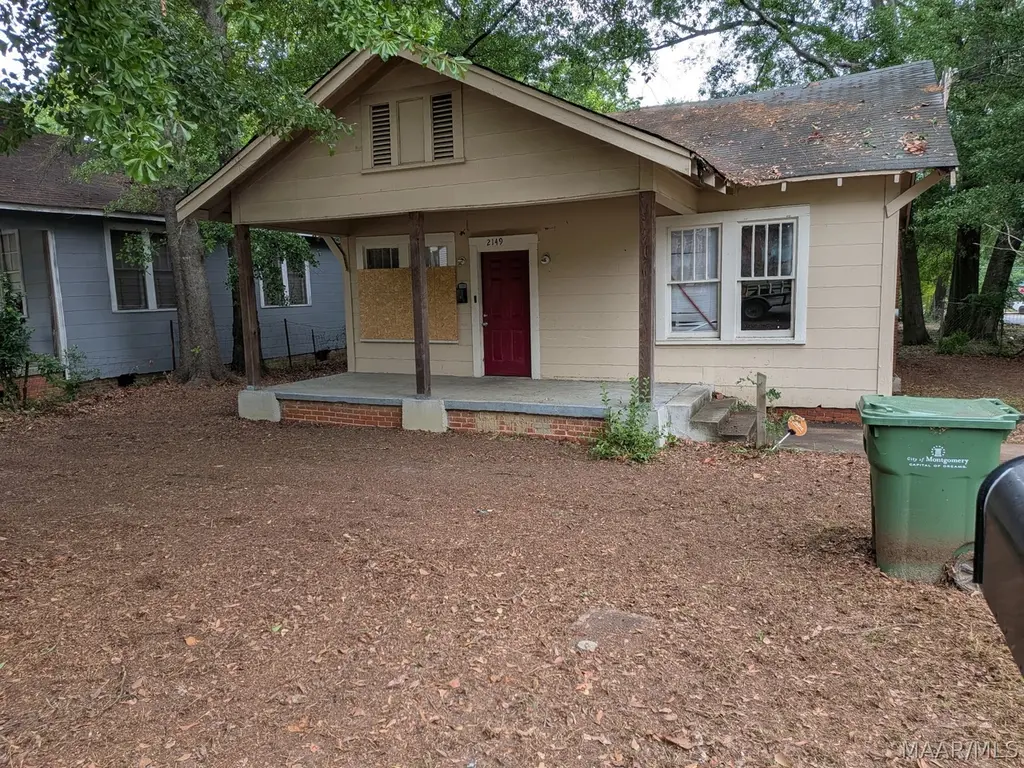
2149 E Fifth St · Montgomery, AL
Flood risk 1/10 · Minimal
- FEMA flood zone
- X (unshaded)
- Chance of flooding over 30 yrs
- 0.0%
- Est. flood insurance / yr
- $507 – $1,088
Fire risk 1/10 · Minimal
- Est. fire insurance / yr
- $916 – $1,700
Heat risk 7/10 · Major
- Hot days now (above 107°F)
- 7 days/yr
- Hot days in 30 yrs
- 19 days/yr
Wind risk 8/10 · Major
- Chance of severe wind over 30 yrs
- 80.0%
Air-quality risk 3/10 · Minor
- Unhealthy air days now
- 4 days/yr
- Unhealthy air days in 30 yrs
- 4 days/yr
Risk factors via First Street. Map © Google.
Why this score? — see what drove the B- grade
The composite is a weighted blend of 9 inputs, each scored 0–100. Each bar is that input's sub-score; the figure is the points it added to the 100-point composite (weight × sub-score).
- Cash flow +30.0/30.0
- 1% rule +10.0/10.0
- DSCR +10.0/10.0
- Rent growth +4.1/5.0
- ARV discount +3.6/15.0
- Livability +3.2/5.0
- Condition / age +2.5/5.0
- Schools +1.7/10.0
- Appreciation +0.0/10.0
$45,000
🖨 Deal sheet (PDF) 📄 Offer letter ✓ Due diligence
Listing remarks MLS
Great investment property. Has new mini blinds and painted floors. Central HVAC. Please verify schools if important. There has been some copper theft.
Key facts
- 7,405 sq ft lot
- Parking
- Built 1930
Property features AI
Exterior
- Parking: Driveway
- Utilities: Cable available; Electricity available; Natural gas available; Public water; Public sewer
- Home design: Single-story home
- Construction: Asbestos construction materials; Year built per public records
- Exterior features: Covered porch; Porch; Storage structure; Partial fencing; Fence; Mature trees; Paved road access; City corner lot
Interior
- Kitchen: Kitchen/dining combo
- Bedrooms: Two bedrooms on the first floor
- Flooring: Wood flooring
- Bathrooms: Two full bathrooms on the first floor
- Heating & cooling: Central heating (gas); Central electric air conditioning
- Interior features: Blinds and window treatments; Linen closet; Fireplace (one)
- Laundry & utility: Washer hookup; Dryer hookup; Water heater
Neighborhood map
What this means for you Summary
Snapshot
- This is a 3-bed/1.0-bath single-family listed at $45k.
Deal economics
- At list price, monthly cash flow is $609 ($7k/yr) — positive.
- The deal already cash-flows at list — no discount required.
- Meets the 1% rule at list price ($1k rent vs $45k).
- Recommended offer: $44k (3.0% below list) — sets the bar for market timing.
- Cap rate 22.5% vs local median 6.0% in Montgomery — top-decile yield for the area; either an underpriced asset or a hidden risk that comps aren't pricing in. Stress-test before assuming the spread holds.
Location & tenants
- Location reads 65/100 on livability (#138 in AL) — a middle-class / working-renter tenant base. Strengths: cost of living A+, housing A+; Watch: employment D, crime F, amenities D-.
- Montgomery County (urban): math 9% / reading 31% proficiency, ranked #106 of 129 in AL (top 82%) — low school quality limits family demand, transient renter base, plan for 1-2y turnover; 70% free/reduced lunch — lower-income household profile, screen leases tightly.
- Zoned schools: Dannelly Elementary School (math 2% / reading 21%, grade F, #556 of 627 statewide, top 89%, 622 students, 88% FRL); Goodwyn Middle School (math 0% / reading 16%, grade F, #239 of 257 statewide, top 93%, 808 students, 84% FRL); Jefferson Davis High School (math 3% / reading 16%, grade F, #258 of 305 statewide, top 85%, 1,522 students, 83% FRL).
- Market conditions: Rents rising fast (+6.3%/yr); 138 active listings in the ZIP; 33 comparable units currently listed for rent nearby; rentals lingering (median 46d on market — plan ~5-8 weeks vacancy on turnover, expect pricing pressure); 52% of comp listings sitting > 30 days — soft ceiling on asking rent; 460 units permitted in Montgomery County in 2024 (37 in 5+ unit buildings).
Forward outlook
- Local home prices are declining (-3.0%/yr); year-one equity from $311 of loan paydown is wiped out by about $1k of value loss. Plan a longer hold.
- Montgomery County population projected to shrink 8% by 2050 — rents likely to lag national; underwrite the cash flow, not the appreciation.
- At projected returns (-3.0% appreciation + 6.3% rent growth), your $13k cash investment doubles in ~2 years — after that, you're playing with house money.
Negotiation context
- It's been on market 46 days — a 3% lower offer ($44k) is reasonable based on typical stale-listing flexibility.
- 2 sale attempts since 8y ago with the ask held roughly flat each time — persistent listings suggest the price (not the market) is what's stuck; bring a comps-based counter.
Risks & watch-outs
- Watch-outs: built in 1930 — expect roof / HVAC / electrical / plumbing capex.
- Climate carrying-cost: severe wind risk, 80% chance of damaging wind over 30y; extreme-heat days projected 7→19/yr by 2055 (HVAC capex compounding) — expect insurance premiums to compound above CPI over the hold.
Questions for the listing agent
- It's been on market 46 days. Have you received any prior offers? Is the seller open to a 3% concession, seller financing, or rate buy-down credit?
- Built in 1930 — when were the roof, HVAC, electrical panel, plumbing, and water heater last replaced?
- Is there a deadline driving the sale (1031 exchange, divorce, estate, relocation)? That informs how much negotiation room exists.
- Crime grade is F in this area — have there been break-ins, vandalism, or insurance claims at this property in the last 3 years? What carrier currently insures it and at what premium?
- What's the average days-on-market for RENTAL listings here right now (not sales)? A rising rental-DOM trend means longer vacancies and softer asking-rent achievability than the comps imply.
- What's the recent tenant-quality profile in this submarket — average credit score on applications, eviction rate, late-payment / NSF rate, and stable-employment percentage? A property-management company in the area should have these aggregated.
- How much new for-sale + rental construction is in the pipeline within 1–3 miles? Heavy new supply typically softens prices + rents 12–24 months out; constrained supply supports both.
Investment metrics
- 1% rule
- 2.49% ✓
- Cap rate
- 22.55%
- Cash-on-cash
- 58.04%
- DSCR
- 3.58
- GRM
- 3.3
CMA / ARV
- ARV (median comp)
- $41,395
- List price
- $45,000
- Delta
- 8.71%
- Verdict
- FAIR
- Comps
- 20 within 1.0 mi
Show comp detail 12 sales within ~0.75 mi
| Address | Dist | Beds/Ba | Sqft | Sold | Price | $/sf | Match |
|---|---|---|---|---|---|---|---|
| 2468 Spruce Cur Curv | 0.37mi | 3/1.0 | 1,263 (+1%) | 6mo | $10,000 | $8 | 76 |
| 1813 W 3rd St | 0.29mi | 2/1.0 (-1) | 1,218 (-2%) | 6mo | $38,000 | $31 | 73 |
| 2441 Spruce Curv | 0.32mi | 3/1.0 | 1,290 (+3%) | 10mo | $71,400 | $55 | 71 |
| 2045 Gorgas St | 0.38mi | 3/1.0 | 1,337 (+7%) | 1mo | $120,000 | $90 | 70 |
| 1801 4th St | 0.28mi | 3/1.0 | 1,320 (+6%) | 10mo | $32,000 | $24 | 69 |
| 1934 Gorgas St | 0.24mi | 2/2.0 (-1) | 1,347 (+8%) | 2mo | $139,504 | $104 | 65 |
| 2301 Cherry St | 0.63mi | 3/1.0 | 1,248 (0%) | 9mo | $52,000 | $42 | 63 |
| 1221 Belmont St | 0.54mi | 3/1.0 | 1,185 (-5%) | 8mo | $86,000 | $73 | 60 |
| 1458 Watson Ave | 0.39mi | 3/2.0 | 1,412 (+13%) | 1mo | $160,000 | $113 | 55 |
| 1227 Woodward Ave | 0.57mi | 2/2.0 (-1) | 1,164 (-7%) | 4mo | $180,000 | $155 | 50 |
| 2430 Plum St | 0.71mi | 3/2.0 | 1,388 (+11%) | 6mo | $89,000 | $64 | 39 |
| 1820 Robison Hill Rd | 0.70mi | 3/2.0 | 1,423 (+14%) | 9mo | $115,000 | $81 | 33 |
Match score weights: distance 35% · size 25% · config 20% · recency 20%. Top-matched comps best support the ARV.
Projected returns pro-forma
-3.0% appreciation · 6.29% rent growth · sell at horizon
- IRR
- 60.2%
- Equity multiple
- 3.81×
- Total profit
- $35,359
- Equity at exit
- $6,710
- IRR
- 65.9%
- Equity multiple
- 8.75×
- Total profit
- $97,607
- Equity at exit
- $3,891
Cash invested: $12,600 (down + closing). Projections, not guarantees.
Landlord ↔ Tenant lean methodology
- Overall (STATE)
- 90 Strongly Landlord-Friendly
- State Alabama
- 90 Strongly Landlord-Friendly · R+15
- County
- — inherits STATE
- City
- — inherits STATE
ZIP-level market 36106
- Home prices YoY
- -13.1%
- Rents YoY
- 6.3%
- Active inventory
- 138
- Price-to-rent
- 3.3×
Monthly cashflow live
- Estimated rent
- $1,122 high interval (Pro) →
- Mortgage (P&I)
- −$236
- Tax from tax record
- −$22 /mo · $269/yr
- Insurance
- −$19
- HOA
- −$0
- Vacancy / Maint / Mgmt
- −$236
- Net cashflow
- $609
Break-even live
Sensitivity live
| Price | -10% $635 | -5% $622 | +0% $609 | +5% $597 | +10% $584 |
|---|---|---|---|---|---|
| Rent | -10% $521 | -5% $565 | +0% $609 | +5% $654 | +10% $698 |
| Rate | -1.0pp $632 | -0.5pp $621 | base $609 | +0.5pp $598 | +1.0pp $586 |
UW: 25.0% down · 7.5% · 30yr · 1.5% tax · 5.0% vac · 8.0% maint · 8.0% mgmt
Financing live
Cash to close
- Down payment
- $11,250
- Closing costs
- $1,350
- Reserves months
- —
- Total cash needed
- —
Loan-product check · same deal, 3 products live
Conventional
25% down · 7.5% · 30yr
- Down + closing
- —
- Monthly P&I
- —
- Monthly cashflow
- —
- DSCR
- —
- Eligible?
- —
Personal DTI + credit; lowest rate.
DSCR
20% down · 8.5% · 30yr
- Down + closing
- —
- Monthly P&I
- —
- Monthly cashflow
- —
- DSCR
- —
- Eligible?
- —
No personal income docs; deal must DSCR.
Hard money
10% down · 12.0% · 12mo
- Down + closing
- —
- Monthly P&I
- —
- Monthly cashflow
- —
- DSCR
- —
- Eligible?
- —
Short-term bridge; refi at stabilization.
Rent comps 33 comps
| Address | Beds | Baths | Sqft | Rent | $/sqft | DOM | Units | Dist |
|---|---|---|---|---|---|---|---|---|
| 2205 E 5th St Montgomery, AL | 3.0 | 1.0 | 1020 | $800 | $0.78 | 45d | 1 | 0.04mi |
| 2020 E 3rd St Montgomery, AL | 2.0 | 1.0 | 1186 | $750 | $0.63 | 23d | 1 | 0.18mi |
| 2454 Spruce Curv Montgomery, AL | 3.0 | 1.0 | 988 | $1,100 | $1.11 | 45d | 1 | 0.33mi |
| 1347 Felder Ave Montgomery, AL | 2.0 | 1.0 | 1000 | $1,095 | $1.09 | 15d | 1 | 0.42mi |
| 1343 Felder Ave Montgomery, AL | 2.0 | 1.0 | 1000 | $1,095 | $1.09 | 15d | 1 | 0.43mi |
| 2000 Cherry St Montgomery, AL | 2.0 | 1.0 | 1106 | $950 | $0.86 | 45d | 1 | 0.62mi |
| 1814 Pinecrest Dr Montgomery, AL | 3.0 | 1.0 | 1053 | $990 | $0.94 | 45d | 1 | 0.70mi |
| 1839 Robison Hill Rd Montgomery, AL | 4.0 | 2.0 | 1370 | $1,550 | $1.13 | 23d | 1 | 0.76mi |
| 2736 Chevy Chase Dr Montgomery, AL | 3.0 | 1.0 | 1100 | $1,300 | $1.18 | 45d | 1 | 0.79mi |
| 2727 Boultier St Montgomery, AL | 1.0–3.0 | 1.0–2.0 | 1070 | $1,582 | $1.48 | 15d | 3 | 0.80mi |
| 2009 Palmetto St Montgomery, AL | 3.0 | 1.0 | 1487 | $1,050 | $0.71 | 45d | 1 | 0.87mi |
| 3136 Harrison Rd Montgomery, AL | 3.0 | 1.5 | 1355 | $1,025 | $0.76 | 45d | 1 | 0.97mi |
| 2845 Zelda Rd Montgomery, AL | 2.0 | 2.0 | 1013 | $1,042 | $1.03 | 15d | 3 | 0.97mi |
| 906 E Fairview Ave Unit 902 Montgomery, AL | 2.0 | 1.0 | 1100 | $995 | $0.90 | 23d | 1 | 1.04mi |
| 2113 Brewton St Montgomery, AL | 3.0 | 1.0 | 1363 | $1,150 | $0.84 | 45d | 1 | 1.18mi |
| 3318 Habersham Rd Montgomery, AL | 3.0 | 2.0 | 1134 | $1,250 | $1.10 | 15d | 1 | 1.19mi |
| 311 Bradley Dr Montgomery, AL | 3.0 | 1.0 | 1104 | $825 | $0.75 | 45d | 1 | 1.24mi |
| 3356 Audubon Rd Montgomery, AL | 2.0 | 1.5 | 1340 | $950 | $0.71 | 45d | 1 | 1.26mi |
| 1827 Capitol Ave Montgomery, AL | 2.0 | 1.0 | 1068 | $1,600 | $1.50 | 45d | 1 | 1.27mi |
| 1827 Capitol Ave Montgomery, AL | 2.0 | 1.0 | 1068 | $1,600 | $1.50 | 15d | 1 | 1.27mi |
| 3323 Bedford Ln Montgomery, AL | 3.0 | 2.0 | 1134 | $1,200 | $1.06 | 23d | 1 | 1.28mi |
| 301 Bradley Dr Montgomery, AL | 2.0 | 1.0 | 841 | $935 | $1.11 | 15d | 1 | 1.28mi |
| 432 Clanton Ave Montgomery, AL | 2.0 | 1.0 | 800 | $995 | $1.24 | 15d | 1 | 1.29mi |
| 945 E Edgemont Ave Unit 951 Montgomery, AL | 2.0 | 1.0 | 841 | $750 | $0.89 | 45d | 1 | 1.29mi |
| 951 E Edgemont Ave Montgomery, AL | 2.0 | 1.0 | 841 | $750 | $0.89 | 45d | 1 | 1.30mi |
| 39 S Lewis St Montgomery, AL | 2.0 | 1.0 | 1209 | $950 | $0.79 | 45d | 1 | 1.30mi |
| 319 Olivia Ct Montgomery, AL | 2.0 | 1.0 | 850 | $700 | $0.82 | 23d | 1 | 1.31mi |
| 3346 Bedford Ln Montgomery, AL | 3.0 | 1.0 | 1134 | $1,295 | $1.14 | 15d | 1 | 1.32mi |
| 1008 Pelham St Montgomery, AL | 4.0 | 2.0 | 1288 | $1,300 | $1.01 | 45d | 1 | 1.40mi |
| 2229 Madison Ave Montgomery, AL | 2.0 | 1.0 | 1100 | $625 | $0.57 | 45d | 1 | 1.40mi |
| 3369 Montezuma Rd Montgomery, AL | 3.0 | 1.0 | 1281 | $1,150 | $0.90 | 45d | 1 | 1.40mi |
| 122 Oak Forest Dr Montgomery, AL | 3.0 | 1.0 | 1092 | $975 | $0.89 | 23d | 1 | 1.41mi |
| 1415 Madison Ave Apt E Montgomery, AL | 2.0 | 1.0 | 825 | $1,095 | $1.33 | 15d | 1 | 1.46mi |
Listing history 20 events
-
2026-06-21days on market $45,000 Active 46 DOM
-
2026-06-18days on market $45,000 Active 43 DOM
-
2026-06-17days on market $45,000 Active 42 DOM
-
2026-06-16days on market $45,000 Active 41 DOM
-
2026-06-15days on market $45,000 Active 40 DOM
-
2026-06-14days on market $45,000 Active 38 DOM
-
2026-06-13days on market $45,000 Active 37 DOM
-
2026-06-10days on market $45,000 Active 35 DOM
-
2026-06-09days on market $45,000 Active 34 DOM
-
2026-06-08days on market $45,000 Active 33 DOM
-
2026-06-07days on market $45,000 Active 32 DOM
-
2026-06-03days on market $45,000 Active 28 DOM
-
2026-06-02days on market $45,000 Active 27 DOM
-
2026-06-01days on market $45,000 Active 26 DOM
-
2026-05-31days on market $45,000 Active 25 DOM
-
2026-05-30days on market $45,000 Active 24 DOM
-
2026-05-04$45,000 Active 53-char remark
-
2025-02-28soldstatus $53,572
-
2018-05-04soldstatus $11,000 150-char remark
Show marketing remark (150 chars)
Great investment property. Has new mini blinds and painted floors. Central HVAC. Please verify schools if important. There has been some copper theft.
-
2018-03-29$17,900 150-char remark
Show marketing remark (150 chars)
Great investment property. Has new mini blinds and painted floors. Central HVAC. Please verify schools if important. There has been some copper theft.
ⓘ Source: listings_history table (triggers on properties + properties_extension) + one-shot
backfill from property_details.listing_events for pre-trigger history.
Tax reassessment forecast AL · Resets to sale price
- Current annual tax
- $269 · $22/mo
- Projected year-2 tax
- $269 · $22/mo
- Expected delta
- $0/yr ($0/mo · 0.0%)
ⓘ Screening estimate from a state-policy table — verify with the county assessor before closing.
Climate risk First Street
- Flood 1/10 Low FEMA zone X (unshaded) · 0% chance over 30 yrs
- Wildfire 1/10 Low
- Heat 7/10 Severe 7 d/yr ≥107°F today · 19 d/yr by 30 yrs out
- Wind 8/10 Severe 80% chance of damaging wind over 30 yrs
- Air quality 3/10 Moderate 4 unhealthy d/yr today · 4 by 30 yrs out
Nearby sold comps map
Loading sold comps map…
Walkable amenities ~0.75 mi
Loading nearby amenities…
Taxation est. · year 1
- Rental income
- $13,467
- − Mortgage interest
- −$2,521
- − Property taxes
- −$269
- − Insurance
- −$225
- − Repairs & maintenance
- −$1,077
- − Management
- −$1,077
- − Depreciation
- −$1,309
- Taxable income
- $6,989
- Est. tax owed @ 24.0%
- −$1,677
- After-tax cash flow
- $5,636/yr
For passive investors: Depreciation is non-cash, so a rental often shows a tax loss while cash-flowing — sheltering income. Rental losses are passive: they offset passive income freely, and up to $25,000/yr can offset ordinary (W-2) income if you actively participate and your MAGI is under $100k (phasing out to $0 by $150k); unused losses carry forward. On sale, claimed depreciation is recaptured at up to 25%, and gains may owe capital-gains tax (a 1031 exchange can defer both). Figures are a year-1 estimate at your 24.0% rate — not tax advice; consult a CPA.
Schools (NCES district)
- District
- Montgomery County
- NCES district ID
- 0102430
- Math proficiency
- 9% ▼ -21.00%
- Reading proficiency
- 31% ▼ -1.00%
- Median HH income
- $43,902
- Composite
- 17.24/100
- National rank
- #9093
- State rank
- #106 of 129 in AL
Livability — Montgomery
- Score
- 65/100
- State rank
- #138
- US rank
- #13416
Category grades
Schools grade is shown separately in the Schools card above.
Census & demographics
- Census place
- Montgomery, AL
- County
- Montgomery County · 190,016 people
- City population
- 175,913
- Metro
- Montgomery, AL
- Population (ZIP)
- 14,065
- Household income
- $69,087
- Rent vs Own
- Severe rent burden
- 876.0
Population outlook (Montgomery County) Hauer SSP2
- Today (2025)
- 224,008 people
- By 2030
- 221,460 · -1.1%
- By 2040
- 214,179 · -4.4%
- By 2050
- 204,912 · -8.5%
- By 2075
- 177,821 · -20.6%
- By 2100
- 145,134 · -35.2%
Race, ethnicity, and origin ACS 2023
- Neighborhood character
- Diverse neighborhood (Simpson 0.58)
- Race & ethnicity
- White 47% Black 43% Hispanic / Latino 5% Two or more races 4% Asian 1%
- Hispanic origin (detail)
- Mexican 3%
- Common ancestry
- Serbian 2% Slovak 2% Italian 1%
- Foreign-born
- 4% · Canada, China, South Korea
- Languages at home
- 94% English-only · Spanish 3%
Political lean MEDSL · Montgomery
- 2024 margin
- Solid D (+30.7) · D 64.8% · R 34.1% · Other 1.1%
- 2008→2024 swing
- +11.5pp toward D · 2008: 19.2pp · 2024: 30.7pp
- All cycles
- 2024: D+30.7 2020: D+31.5 2016: D+26.2 2012: D+24.3 2008: D+19.2
Not yet ingested
- Civics
- —
Market trends
- HPI YoY
- ▼ -22.82%
- Current HPI
- 151.1822
- Rent YoY
- ▲ 6.29%
- Metro
- Montgomery, AL
- State GDP YoY
- ▲ 2.94%
- F500 in state
- 4
Industry mix (Fortune 500 HQ in AL)
| Industry | F500 HQs | Revenue |
|---|---|---|
| Financial Services | 1 | $8B |
|
||
| Healthcare | 1 | $5B |
|
||
Price history
+151.4% since first listed4 events — show timeline
- 2026-05-04 Listed $45,000 MAAR
- 2025-02-28 Sold (Public Records) $53,572 Public Records
- 2018-05-04 Sold (MLS) $11,000 MAAR
- 2018-03-29 Listed $17,900 MAAR
Property tax history
+3.5%/yrLatest (2025): $269 · -2.8% YoY. Source: county tax records.
Cash-flow waterfall
monthlySold comps — $/sqft
last 12 mo · ≤1 miLoading sold comps…