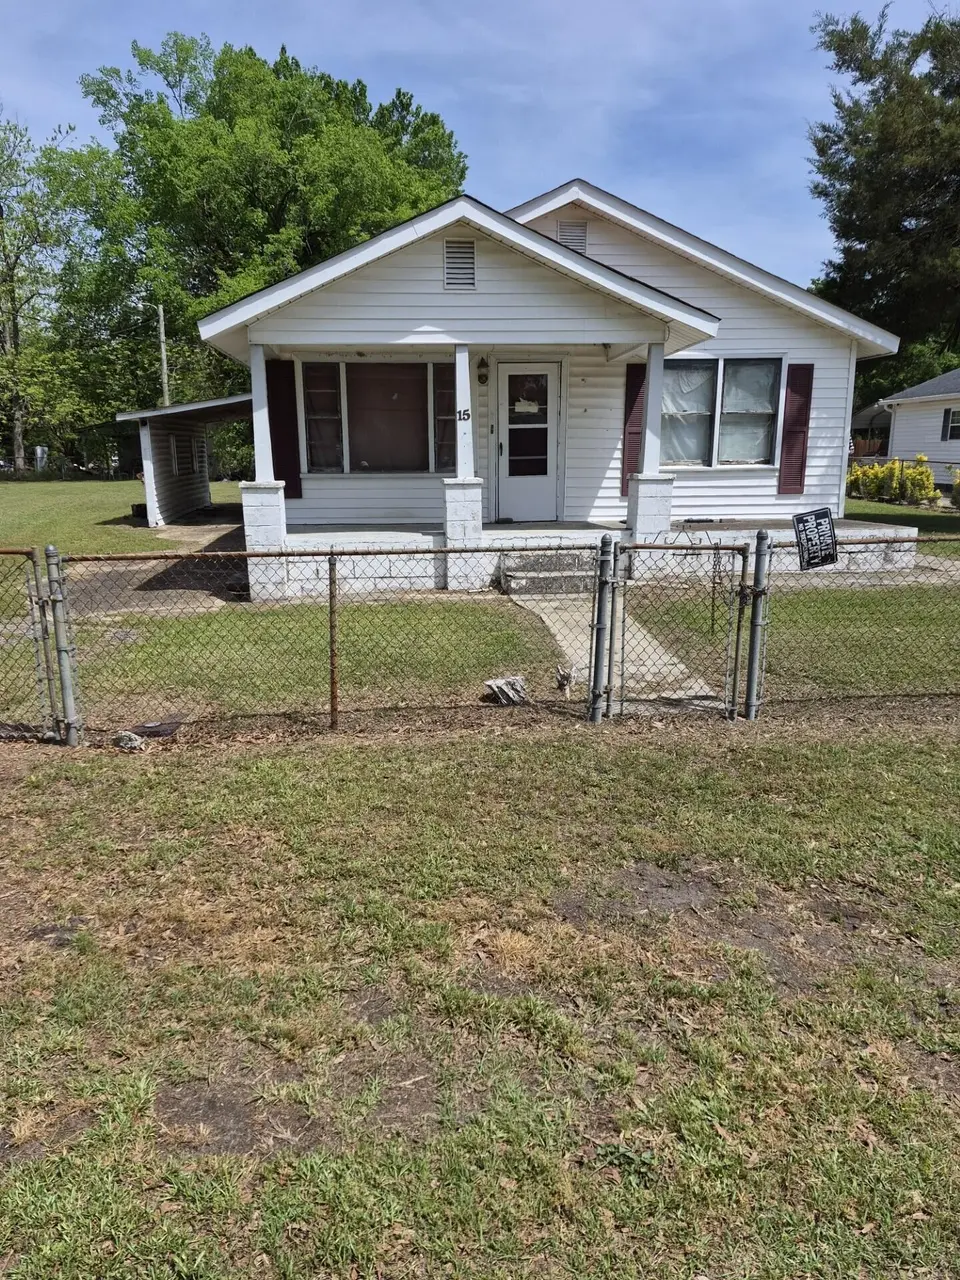
15 Liberty St · Mayesville, SC
Flood risk 3/10 · Minor
- FEMA flood zone
- X (unshaded)
- Chance of flooding over 30 yrs
- 0.2%
- Est. flood insurance / yr
- $507 – $1,088
Fire risk 5/10 · Moderate
- Est. fire insurance / yr
- $783 – $1,453
Heat risk 7/10 · Major
- Hot days now (above 109°F)
- 7 days/yr
- Hot days in 30 yrs
- 16 days/yr
Wind risk 8/10 · Major
- Chance of severe wind over 30 yrs
- 80.0%
Air-quality risk 2/10 · Minimal
- Unhealthy air days now
- 1 days/yr
- Unhealthy air days in 30 yrs
- 2 days/yr
Risk factors via First Street. Map © Google.
Why this score? — see what drove the B grade
The composite is a weighted blend of 9 inputs, each scored 0–100. Each bar is that input's sub-score; the figure is the points it added to the 100-point composite (weight × sub-score).
- Cash flow +30.0/30.0
- 1% rule +10.0/10.0
- DSCR +10.0/10.0
- ARV discount +7.5/15.0
- Appreciation +4.6/10.0
- Livability +2.8/5.0
- Rent growth +2.5/5.0
- Condition / age +2.5/5.0
- Schools +1.9/10.0
$59,500
🖨 Deal sheet 📄 Offer letter ✓ Due diligence
Listing remarks
House available. 4 bed, 1 bath. Home is being sold 'AS-IS'. Also included in this sale is tax map #308-09-02-019. The only way to access this land is through 15 Liberty St.
Key facts
- 9,583 sq ft lot
- Parking
- Built 1975
Property features AI
Exterior
- Parking: Attached carport; Carport (1 space)
- Utilities: Public water; Sewer available; Water available; Cable available; Septic tank
- Home design: Single family residence; One story; House
- Construction: Wood siding construction
- Exterior features: Front porch; Chain link fencing; Shingle roof; Paved road access; Lot includes other features
Interior
- Kitchen: Range; Refrigerator
- Flooring: Wood flooring
- Bathrooms: 1 full bathroom
- Heating & cooling: No heating specified; No cooling specified
- Interior features: Eat-in kitchen; Window coverings
- Laundry & utility: Washer hookup; Crawl space basement
Neighborhood map
What this means for you Summary
Snapshot
- This is a 4-bed/1.0-bath single-family listed at $60k.
Deal economics
- At list price, monthly cash flow is $515 ($6k/yr) — positive.
- The deal already cash-flows at list — no discount required.
- Meets the 1% rule at list price ($1k rent vs $60k).
- Recommended offer: $56k (6.0% below list) — sets the bar for market timing.
Location & tenants
- Location reads 55/100 on livability (#305 in SC) — a working-class tenant base; expect higher turnover. Strengths: cost of living A+, housing A; Watch: employment D, crime F, amenities F.
- Sumter 01 (urban): math 18% / reading 28% proficiency, ranked #64 of 80 in SC (top 80%) — low school quality limits family demand, transient renter base, plan for 1-2y turnover; 64% free/reduced lunch — lower-income household profile, screen leases tightly.
- Zoned schools: R. E. Davis College Preparatory Academy (math 2% / reading 12%, grade F, #594 of 597 statewide, top 100%, 369 students, 100% FRL); Crestwood High (math 32% / reading 71%, grade D+, #146 of 196 statewide, top 75%, 1,100 students, 100% FRL) — zoned schools average 100% FRL vs 64% district-wide (36 pts higher); higher-poverty schools than district average — tighter screening recommended.
- Market conditions: 9 active listings in the ZIP; 386 units permitted in Sumter County in 2024 (0 in 5+ unit buildings).
Forward outlook
- Local home prices are declining (-0.7%/yr); year-one equity from $411 of loan paydown is wiped out by about $432 of value loss. Plan a longer hold.
- Sumter County population projected at -14% by 2050 — secular population decline; favor cash flow + early exit over multi-decade hold.
- At projected returns (-0.7% appreciation + 3.0% rent growth), your $17k cash investment doubles in ~3 years — after that, you're playing with house money.
Negotiation context
- It's been on market 71 days — a 6% lower offer ($56k) is reasonable based on typical stale-listing flexibility.
Risks & watch-outs
- Climate carrying-cost: severe wind risk, 80% chance of damaging wind over 30y; moderate wildfire risk; extreme-heat days projected 7→16/yr by 2055 (HVAC capex compounding) — expect insurance premiums to compound above CPI over the hold.
Questions for the listing agent
- It's been on market 71 days. Have you received any prior offers? Is the seller open to a 6% concession, seller financing, or rate buy-down credit?
- Built in 1975 — when were the roof, HVAC, electrical panel, plumbing, and water heater last replaced?
- Why hasn't it sold? Are there any deal-killer items the seller is aware of (foundation, flood, title, zoning, code violations)?
- Is there a deadline driving the sale (1031 exchange, divorce, estate, relocation)? That informs how much negotiation room exists.
- Schools are F-rated, which usually means shorter tenancies and higher turnover. Who's the typical renter profile here, and what's been the actual vacancy rate?
- Crime grade is F in this area — have there been break-ins, vandalism, or insurance claims at this property in the last 3 years? What carrier currently insures it and at what premium?
- What's the average days-on-market for RENTAL listings here right now (not sales)? A rising rental-DOM trend means longer vacancies and softer asking-rent achievability than the comps imply.
- What's the recent tenant-quality profile in this submarket — average credit score on applications, eviction rate, late-payment / NSF rate, and stable-employment percentage? A property-management company in the area should have these aggregated.
- How much new for-sale + rental construction is in the pipeline within 1–3 miles? Heavy new supply typically softens prices + rents 12–24 months out; constrained supply supports both.
Investment metrics
- 1% rule
- 1.98% ✓
- Cap rate
- 16.67%
- Cash-on-cash
- 37.06%
- DSCR
- 2.65
- GRM
- 4.2
CMA / ARV
- ARV (on-the-fly)
- $201,807
- Comps found
- 1
Show comp detail 1 sale within ~0.75 mi
| Address | Dist | Beds/Ba | Sqft | Sold | Price | $/sf | Match |
|---|---|---|---|---|---|---|---|
| 8 Bland St | 0.33mi | 3/2.0 (-1) | 1,226 (-7%) | 17mo | $187,000 | $153 | 50 |
Match score weights: distance 35% · size 25% · config 20% · recency 20%. Top-matched comps best support the ARV.
Projected returns pro-forma
-0.73% appreciation · 3.0% rent growth · sell at horizon
- IRR
- 36.8%
- Equity multiple
- 2.74×
- Total profit
- $29,048
- Equity at exit
- $15,147
- IRR
- 40.8%
- Equity multiple
- 5.39×
- Total profit
- $73,193
- Equity at exit
- $16,584
Cash invested: $16,660 (down + closing). Projections, not guarantees.
Landlord ↔ Tenant lean methodology
- Overall (STATE)
- 90 Strongly Landlord-Friendly
- State South Carolina
- 90 Strongly Landlord-Friendly · R+6
- County
- — inherits STATE
- City
- — inherits STATE
ZIP-level market 29104
- Home prices YoY
- -0.7%
- Active inventory
- 9
- Price-to-rent
- 4.2×
Monthly cashflow live
- Estimated rent
- $1,179 medium interval (Pro) →
- Mortgage (P&I)
- −$312
- Tax from tax record
- −$80 /mo · $961/yr
- Insurance
- −$25
- HOA
- −$0
- Vacancy / Maint / Mgmt
- −$248
- Net cashflow
- $515
Break-even live
UW: 25.0% down · 7.5% · 30yr · 1.5% tax · 5.0% vac · 8.0% maint · 8.0% mgmt
Financing live
Cash to close
- Down payment
- $14,875
- Closing costs
- $1,785
- Reserves months
- —
- Total cash needed
- —
Loan-product check · same deal, 3 products live
Conventional
25% down · 7.5% · 30yr
- Down + closing
- —
- Monthly P&I
- —
- Monthly cashflow
- —
- DSCR
- —
- Eligible?
- —
Personal DTI + credit; lowest rate.
DSCR
20% down · 8.5% · 30yr
- Down + closing
- —
- Monthly P&I
- —
- Monthly cashflow
- —
- DSCR
- —
- Eligible?
- —
No personal income docs; deal must DSCR.
Hard money
10% down · 12.0% · 12mo
- Down + closing
- —
- Monthly P&I
- —
- Monthly cashflow
- —
- DSCR
- —
- Eligible?
- —
Short-term bridge; refi at stabilization.
Listing history 17 events
-
2026-06-19days on market $59,500 Active 71 DOM
-
2026-06-18days on market $59,500 Active 70 DOM
-
2026-06-17days on market $59,500 Active 69 DOM
-
2026-06-16days on market $59,500 Active 68 DOM
-
2026-06-15days on market $59,500 Active 67 DOM
-
2026-06-14days on market $59,500 Active 65 DOM
-
2026-06-13days on market $59,500 Active 64 DOM
-
2026-06-10days on market $59,500 Active 62 DOM
-
2026-06-09days on market $59,500 Active 61 DOM
-
2026-06-08days on market $59,500 Active 60 DOM
-
2026-06-07days on market $59,500 Active 59 DOM
-
2026-06-02days on market $59,500 Active 54 DOM
-
2026-06-01days on market $59,500 Active 53 DOM
-
2026-05-31days on market $59,500 Active 52 DOM
-
2026-05-30days on market $59,500 Active 51 DOM
-
2026-05-05price $59,500
-
2026-04-09$69,000 Active
ⓘ Source: listings_history table (triggers on properties + properties_extension) + one-shot
backfill from property_details.listing_events for pre-trigger history.
Tax reassessment forecast SC · Resets to sale price
- Current annual tax
- $961 · $80/mo
- Projected year-2 tax
- $961 · $80/mo
- Expected delta
- $0/yr ($0/mo · 0.0%)
ⓘ Screening estimate from a state-policy table — verify with the county assessor before closing.
Climate risk First Street
- Flood 3/10 Moderate FEMA zone X (unshaded) · 20% chance over 30 yrs
- Wildfire 5/10 Major
- Heat 7/10 Severe 7 d/yr ≥109°F today · 16 d/yr by 30 yrs out
- Wind 8/10 Severe 80% chance of damaging wind over 30 yrs
- Air quality 2/10 Low 1 unhealthy d/yr today · 2 by 30 yrs out
Nearby sold comps map
Loading sold comps map…
Walkable amenities ~0.75 mi
Loading nearby amenities…
Taxation est. · year 1
- Rental income
- $14,148
- − Mortgage interest
- −$3,333
- − Property taxes
- −$961
- − Insurance
- −$298
- − Repairs & maintenance
- −$1,132
- − Management
- −$1,132
- − Depreciation
- −$1,731
- Taxable income
- $5,562
- Est. tax owed @ 24.0%
- −$1,335
- After-tax cash flow
- $4,839/yr
For passive investors: Depreciation is non-cash, so a rental often shows a tax loss while cash-flowing — sheltering income. Rental losses are passive: they offset passive income freely, and up to $25,000/yr can offset ordinary (W-2) income if you actively participate and your MAGI is under $100k (phasing out to $0 by $150k); unused losses carry forward. On sale, claimed depreciation is recaptured at up to 25%, and gains may owe capital-gains tax (a 1031 exchange can defer both). Figures are a year-1 estimate at your 24.0% rate — not tax advice; consult a CPA.
Schools (NCES district)
- District
- Sumter 01
- NCES district ID
- 4503902
- Math proficiency
- 18% ▼ -13.00%
- Reading proficiency
- 28% ▼ -6.00%
- Median HH income
- $40,423
- Composite
- 19.45/100
- National rank
- #8775
- State rank
- #64 of 80 in SC
Livability — Mayesville
- Score
- 55/100
- State rank
- #305
- US rank
- #23372
Category grades
Schools grade is shown separately in the Schools card above.
Census & demographics
- Census place
- Mayesville, SC
- Population (ZIP)
- 1,559
Population outlook (Sumter County) Hauer SSP2
- Today (2025)
- 104,585 people
- By 2030
- 102,282 · -2.2%
- By 2040
- 96,258 · -8.0%
- By 2050
- 89,592 · -14.3%
- By 2075
- 74,715 · -28.6%
- By 2100
- 60,235 · -42.4%
Race, ethnicity, and origin ACS 2023
- Neighborhood character
- Predominantly Black (72%)
- Race & ethnicity
- Black 72% White 28%
- Common ancestry
- Serbian 2% Hispanic 1% Slovak 1%
- Foreign-born
- 1%
- Languages at home
- 98% English-only · Spanish 1% German/W. Germanic 1%
Political lean MEDSL · Sumter
- 2024 margin
- Toss-up / Even · D 51.9% · R 47.0% · Other 1.2%
- 2008→2024 swing
- -10.6pp toward R · 2008: 15.4pp · 2024: 4.9pp
- All cycles
- 2024: D+4.9 2020: D+13.0 2016: D+12.0 2012: D+17.5 2008: D+15.4
Not yet ingested
- Civics
- —
Market trends
- HPI YoY
- ▼ -0.73%
- Current HPI
- 102.3131
- Rent YoY
- —
- Metro
- —
- State GDP YoY
- ▲ 4.51%
- F500 in state
- 2
Industry mix (Fortune 500 HQ in SC)
| Industry | F500 HQs | Revenue |
|---|---|---|
| Packaging | 1 | $7B |
|
||
Price history
-13.8% since first listed2 events — show timeline
- 2026-05-05 Price Changed $59,500 SBOR
- 2026-04-09 Listed $69,000 SBOR
Property tax history
+0.3%/yrLatest (2025): $961 · +1.0% YoY. Source: county tax records.
Cash-flow waterfall
monthlySold comps — $/sqft
last 12 mo · ≤1 miLoading sold comps…