 Fourplex
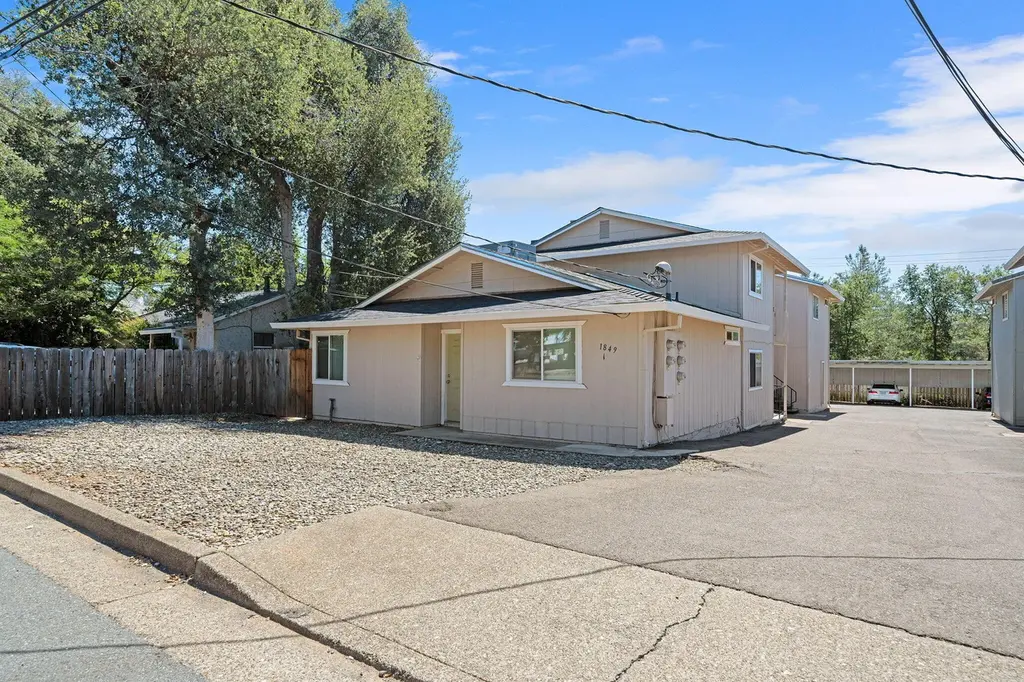
1849 Parallel St · Shasta Lake, CA
Flood risk 9/10 · Severe
- FEMA flood zone
- X (unshaded)
- Chance of flooding over 30 yrs
- 0.99%
- Est. flood insurance / yr
- $507 – $1,088
Fire risk 8/10 · Major
- Est. fire insurance / yr
- $659 – $1,223
Heat risk 8/10 · Major
- Hot days now (above 105°F)
- 7 days/yr
- Hot days in 30 yrs
- 18 days/yr
Wind risk 1/10 · Minimal
- Chance of severe wind over 30 yrs
- —
Air-quality risk 10/10 · Severe
- Unhealthy air days now
- 44 days/yr
- Unhealthy air days in 30 yrs
- 46 days/yr
Risk factors via First Street. Map © Google.
Why this score? — see what drove the C grade
The composite is a weighted blend of 9 inputs, each scored 0–100. Each bar is that input's sub-score; the figure is the points it added to the 100-point composite (weight × sub-score).
- Cash flow +24.2/30.0
- DSCR +7.8/10.0
- ARV discount +7.5/15.0
- 1% rule +6.3/10.0
- Condition / age +3.8/5.0
- Livability +3.2/5.0
- Rent growth +2.5/5.0
- Schools +2.5/10.0
- Appreciation +0.0/10.0
$499,900
🖨 Deal sheet 📄 Offer letter ✓ Due diligence
Multi-family units
County records classify this as Multi-Family (2-4 Unit). Listing-text estimate: 4 units. confirmed
Listing remarks MLS
Four-plex with paved driveway, 3 garages and 4 carports. Two units are two bedrooms, the other two units are one bedroom. Each unit has range/oven.
Key facts
- Recent upgrades
- On-site laundry room
- New hvac systems
Tags
Property features AI
Exterior
- Parking: Attached garage with 3 spaces; Carport with 3 spaces
- Home design: Residential income property
- Construction: Wood siding construction
- Exterior features: Wood siding; Located near Cascade (cross street) with directions: I-5, Shasta Dam Blvd Exit. Turn left on Cascade, left on 3rd Street, and left on Parallel.
Interior
- Interior features: Forced air heating; Central cooling
Neighborhood map
What this means for you Summary
Snapshot
- This is a 2×2bd/1.0ba + 2×1bd/1.0ba units multifamily listed at $500k. Condition is rated good.
Deal economics
- At list price, monthly cash flow is $934 ($11k/yr) — positive. Per door: $233/mo.
- The deal already cash-flows at list — no discount required.
- Meets the 1% rule at list price ($6k rent vs $500k).
- Cap rate 8.7% vs local median 3.8% in Shasta Lake — top-decile yield for the area; either an underpriced asset or a hidden risk that comps aren't pricing in. Stress-test before assuming the spread holds.
Location & tenants
- Location reads 65/100 on livability (#399 in CA) — a middle-class / working-renter tenant base. Strengths: housing A+, health & safety A+, commute A; Watch: employment C-, schools D-, crime F.
- Gateway Unified (suburban): math 25% / reading 35% proficiency, ranked #355 of 517 in CA (top 69%) — families likely to look elsewhere, expect single-tenant / working-renter base with shorter leases.
- Market conditions: 93 active listings in the ZIP; 10 comparable units currently listed for rent nearby; rentals lingering (median 44d on market — plan ~5-8 weeks vacancy on turnover, expect pricing pressure); 50% of comp listings sitting > 30 days — soft ceiling on asking rent; 246 units permitted in Shasta County in 2024 (0 in 5+ unit buildings).
- At $5,639/mo this rent would consume 100% of the median local household income ($67k/yr) (locally 260% of renters already pay >50% of income on rent) — very limited rent-growth headroom before tenants either downsize or default.
Forward outlook
- Local home prices are declining (-3.0%/yr); year-one equity from $3k of loan paydown is wiped out by about $15k of value loss. Plan a longer hold.
- Shasta County population projected to shrink 9% by 2050 — rents likely to lag national; underwrite the cash flow, not the appreciation.
Negotiation context
- Only 10 days on market — expect competitive offers; lowballing is unlikely to land.
- 4 sale attempts since 11y ago with the ask held roughly flat each time — persistent listings suggest the price (not the market) is what's stuck; bring a comps-based counter.
- Current owner paid $370k; 35% above their basis — modest negotiation headroom, anchor on the comps not their cost.
Risks & watch-outs
- Watch-outs: flood insurance adds $66/mo.
- Climate carrying-cost: severe flood risk; severe wildfire risk; extreme-heat days projected 7→18/yr by 2055 (HVAC capex compounding) — expect insurance premiums to compound above CPI over the hold.
Questions for the listing agent
- Can we see the unit-by-unit rent roll, current vacancy, and any below-market leases? What's the average tenancy length?
- What capital expenditures (roof, boiler, parking lot, exteriors) have been made in the last 5 years, and what's planned in the next 2?
- What's the actual annual flood-insurance premium (NFIP or private), and is the property in a SFHA with mandatory coverage?
- Is there a deadline driving the sale (1031 exchange, divorce, estate, relocation)? That informs how much negotiation room exists.
- Schools are D-rated, which usually means shorter tenancies and higher turnover. Who's the typical renter profile here, and what's been the actual vacancy rate?
- Crime grade is F in this area — have there been break-ins, vandalism, or insurance claims at this property in the last 3 years? What carrier currently insures it and at what premium?
- What's the average days-on-market for RENTAL listings here right now (not sales)? A rising rental-DOM trend means longer vacancies and softer asking-rent achievability than the comps imply.
- What's the recent tenant-quality profile in this submarket — average credit score on applications, eviction rate, late-payment / NSF rate, and stable-employment percentage? A property-management company in the area should have these aggregated.
- How much new apartment / multifamily construction is in the pipeline within 1–3 miles? Heavy new supply (>2% of stock underway) typically softens rents 12–24 months out; light construction supports rent growth.
Investment metrics
- 1% rule
- 1.13% ✓
- Cap rate
- 8.69%
- Cash-on-cash
- 8.57%
- DSCR
- 1.38
- GRM
- 7.4
CMA / ARV
No comps found within radius.
Show comp detail 2 sales within ~0.75 mi
| Address | Dist | Beds/Ba | Sqft | Sold | Price | $/sf | Match |
|---|---|---|---|---|---|---|---|
| 1843 Shasta St | 0.14mi | —/— | — | 10mo | $375,000 | — | 73 |
| 1934 Parallel St St | 0.07mi | —/— | — | 24mo | $425,000 | — | 64 |
Match score weights: distance 35% · size 25% · config 20% · recency 20%. Top-matched comps best support the ARV.
Projected returns pro-forma
-3.0% appreciation · 3.0% rent growth · sell at horizon
- IRR
- -4.1%
- Equity multiple
- 0.85×
- Total profit
- $-21,414
- Equity at exit
- $74,537
- IRR
- 5.6%
- Equity multiple
- 1.42×
- Total profit
- $58,435
- Equity at exit
- $43,222
Cash invested: $139,972 (down + closing). Projections, not guarantees.
Landlord ↔ Tenant lean methodology
- Overall (STATE)
- 18 Strongly Tenant-Friendly
- State California
- 18 Strongly Tenant-Friendly · D+13
- County
- — inherits STATE
- City
- — inherits STATE
ZIP-level market 96019
- Active inventory
- 93
- Price-to-rent
- 27.1×
Monthly cashflow live
- Estimated rent
- $5,639 high interval (Pro) →
- Mortgage (P&I)
- −$2,622
- Tax est. 1.5%
- −$625 /mo · $7,498/yr
- Insurance
- −$208
- Flood insurance flood zone
- −$66 /mo · $798/yr
- HOA
- −$0
- Vacancy / Maint / Mgmt
- −$1,184
- Net cashflow
- $934
Break-even live
4-unit breakdown (identical units grouped — click to expand)
| Units | Beds | Baths | Est. rent |
|---|---|---|---|
| 2× units | 2 | 1 | $3,076 |
| #1 | 2 | 1 | $1,538 |
| #2 | 2 | 1 | $1,538 |
| 2× units | 1 | 1 | $2,564 |
| #3 | 1 | 1 | $1,282 |
| #4 | 1 | 1 | $1,282 |
| Total (4 units) | $5,639 | ||
UW: 25.0% down · 7.5% · 30yr · 1.5% tax · 5.0% vac · 8.0% maint · 8.0% mgmt
Financing live
Cash to close
- Down payment
- $124,975
- Closing costs
- $14,997
- Reserves months
- —
- Total cash needed
- —
Loan-product check · same deal, 3 products live
Conventional
25% down · 7.5% · 30yr
- Down + closing
- —
- Monthly P&I
- —
- Monthly cashflow
- —
- DSCR
- —
- Eligible?
- —
Personal DTI + credit; lowest rate.
DSCR
20% down · 8.5% · 30yr
- Down + closing
- —
- Monthly P&I
- —
- Monthly cashflow
- —
- DSCR
- —
- Eligible?
- —
No personal income docs; deal must DSCR.
Hard money
10% down · 12.0% · 12mo
- Down + closing
- —
- Monthly P&I
- —
- Monthly cashflow
- —
- DSCR
- —
- Eligible?
- —
Short-term bridge; refi at stabilization.
Rent comps 10 comps
| Address | Beds | Baths | Sqft | Rent | $/sqft | DOM | Units | Dist |
|---|---|---|---|---|---|---|---|---|
| 1934 Parallel St Unit A Shasta Lake, CA | 1.0 | 1.0 | — | $1,350 | — | 13d | 1 | 0.05mi |
| 2061 Rosamond Ave Unit 2 Shasta Lake, CA | 2.0 | 1.0 | — | $1,350 | — | 44d | 1 | 0.20mi |
| 1833 Oregon St Shasta Lake, CA | 3.0 | 2.0 | 1292 | $1,850 | $1.43 | 13d | 1 | 0.28mi |
| 1840 Grand Coulee Blvd Shasta Lake, CA | 3.0 | 1.0 | 1344 | $1,850 | $1.38 | 44d | 1 | 0.35mi |
| 1707 Grand Coulee Blvd Unit B Shasta Lake, CA | 2.0 | 1.0 | 800 | $1,459 | $1.82 | 13d | 1 | 0.41mi |
| 4680 Meade St Shasta Lake, CA | 1.0 | 1.0 | 800 | $1,150 | $1.44 | 44d | 1 | 0.58mi |
| 2716 Virginia Ave Shasta Lake, CA | 1.0 | 1.0 | 392 | $1,095 | $2.79 | 13d | 1 | 0.89mi |
| 4325 Fort Peck St Shasta Lake, CA | 2.0 | 1.0 | 864 | $1,600 | $1.85 | 13d | 1 | 0.90mi |
| 4210 Main St Apt 6 Shasta Lake, CA | 1.0 | 1.0 | 600 | $1,050 | $1.75 | 44d | 1 | 1.07mi |
| 13497 Tierra Heights Rd Redding, CA | 3.0 | 3.5 | 3497 | $5,995 | $1.71 | 44d | 1 | 1.29mi |
Listing history 9 events
-
2026-06-19days on market $499,900 Active 10 DOM
-
2026-06-18days on market $499,900 Active 9 DOM
-
2026-06-17days on market $499,900 Active 8 DOM
-
2026-06-16days on market $499,900 Active 7 DOM
-
2026-06-15days on market $499,900 Active 6 DOM
-
2026-06-14days on market $499,900 Active 4 DOM
-
2026-06-13days on market $499,900 Active 3 DOM
-
2026-06-10remarks 699-char remark
-
2026-06-10$499,900 Active 1 DOM
ⓘ Source: listings_history table (triggers on properties + properties_extension) + one-shot
backfill from property_details.listing_events for pre-trigger history.
Climate risk First Street
- Flood 9/10 Extreme FEMA zone X (unshaded) · 99% chance over 30 yrs
- Wildfire 8/10 Severe
- Heat 8/10 Severe 7 d/yr ≥105°F today · 18 d/yr by 30 yrs out
- Wind 1/10 Low
- Air quality 10/10 Extreme 44 unhealthy d/yr today · 46 by 30 yrs out
Nearby sold comps map
Loading sold comps map…
Walkable amenities ~0.75 mi
Loading nearby amenities…
Taxation est. · year 1
- Rental income
- $67,668
- − Mortgage interest
- −$28,002
- − Property taxes
- −$7,498
- − Insurance
- −$3,297
- − Repairs & maintenance
- −$5,413
- − Management
- −$5,413
- − Depreciation
- −$14,543
- Taxable income
- $3,501
- Est. tax owed @ 24.0%
- −$840
- After-tax cash flow
- $10,364/yr
For passive investors: Depreciation is non-cash, so a rental often shows a tax loss while cash-flowing — sheltering income. Rental losses are passive: they offset passive income freely, and up to $25,000/yr can offset ordinary (W-2) income if you actively participate and your MAGI is under $100k (phasing out to $0 by $150k); unused losses carry forward. On sale, claimed depreciation is recaptured at up to 25%, and gains may owe capital-gains tax (a 1031 exchange can defer both). Figures are a year-1 estimate at your 24.0% rate — not tax advice; consult a CPA.
Condition & rehab AI · 13 photos
This fourplex is in good condition with recent major improvements, but the kitchen needs updating to maximize its value.
Repairs flagged
- Moderate kitchen cabinets — dated and in need of replacement
- Moderate kitchen appliances — dated and in need of replacement
- Moderate kitchen countertops — dated and in need of replacement
Value-add opportunities
- Both update kitchen cabinets and appliances — modernizing the kitchen will improve both resale and rental value
- Both paint exterior — painting the exterior will improve curb appeal and increase both resale and rental value
Renovation cost estimate screening
| Repair item | Severity | Est. cost |
|---|---|---|
| kitchen cabinets · dated and in need of replacement | Moderate | $3,000–15,000 |
| kitchen appliances · dated and in need of replacement | Moderate | $3,000–15,000 |
| kitchen countertops · dated and in need of replacement | Moderate | $3,000–15,000 |
| Total estimated repair cost · 3 items | $9,000–45,000 |
Value-add ROI direction
- Both update kitchen cabinets and appliances — modernizing the kitchen will improve both resale and rental value ↑
- Both paint exterior — painting the exterior will improve curb appeal and increase both resale and rental value ↑
ⓘ Cost ranges are severity-bucket heuristics (US national rule-of-thumb). Get contractor quotes + a written scope before underwriting a rehab budget.
Schools (NCES district)
- District
- Gateway Unified
- NCES district ID
- 0614950
- Math proficiency
- 25% ▼ -5.00%
- Reading proficiency
- 35% ▲ 2.00%
- Median HH income
- $41,888
- Composite
- 25.39/100
- National rank
- #7465
- State rank
- #355 of 517 in CA
Livability — Shasta Lake
- Score
- 65/100
- State rank
- #399
- US rank
- #13546
Category grades
Schools grade is shown separately in the Schools card above.
Census & demographics
- Census place
- Shasta Lake, CA
- County
- Shasta County · 147,641 people
- City population
- 10,350
- Metro
- Redding, CA
- Population (ZIP)
- 10,350
- Household income
- $67,446
- Rent vs Own
- Severe rent burden
- 260.0
Population outlook (Shasta County) Hauer SSP2
- Today (2025)
- 179,231 people
- By 2030
- 176,953 · -1.3%
- By 2040
- 169,982 · -5.2%
- By 2050
- 162,547 · -9.3%
- By 2075
- 145,649 · -18.7%
- By 2100
- 123,025 · -31.4%
Race, ethnicity, and origin ACS 2023
- Neighborhood character
- Predominantly White (77%)
- Race & ethnicity
- White 77% Two or more races 12% Hispanic / Latino 9% Asian 4% Native American 2%
- Hispanic origin (detail)
- Mexican 8%
- Common ancestry
- Russian 4% Romanian 4% Italian 4%
- Foreign-born
- 2% · Canada
- Languages at home
- 94% English-only · Spanish 4% Other Asian/Pacific 1%
Political lean MEDSL · Shasta
- 2024 margin
- Solid R (+36.5) · D 30.5% · R 67.0% · Other 2.5%
- 2008→2024 swing
- -10.7pp toward R · 2008: -25.8pp · 2024: -36.5pp
- All cycles
- 2024: R+36.5 2020: R+33.1 2016: R+37.4 2012: R+30.3 2008: R+25.8
Not yet ingested
- Civics
- —
Market trends
- HPI YoY
- ▼ -194.66%
- Current HPI
- 170.6085
- Rent YoY
- —
- Metro
- Redding, CA
- State GDP YoY
- ▲ 3.21%
- F500 in state
- 116
Industry mix (Fortune 500 HQ in CA)
| Industry | F500 HQs | Revenue |
|---|---|---|
| Technology | 27 | $1,492B |
|
||
| Financial Services | 3 | $174B |
|
||
| Retail | 3 | $44B |
|
||
| Insurance | 3 | $26B |
|
||
| Media / Entertainment | 2 | $115B |
|
||
| Pharmaceuticals / Biotech | 2 | $62B |
|
||
Price history
+128.3% since first listed9 events — show timeline
- 2026-06-09 Listed $499,900 SAOR
- 2024-01-23 Rental Removed $975 APPFOLIO
- 2024-01-18 Price Changed $975 APPFOLIO
- 2023-11-29 Listed for Rent — APPFOLIO
- 2023-06-19 Rental Removed — APPFOLIO
- 2020-03-02 Sold (MLS) $370,000 SAOR
- 2020-01-10 Listed $370,000 SAOR
- 2015-06-17 Sold (MLS) $205,000 SAOR
- 2015-04-02 Listed $219,000 SAOR
Cash-flow waterfall
monthlySold comps — $/sqft
last 12 mo · ≤1 miLoading sold comps…