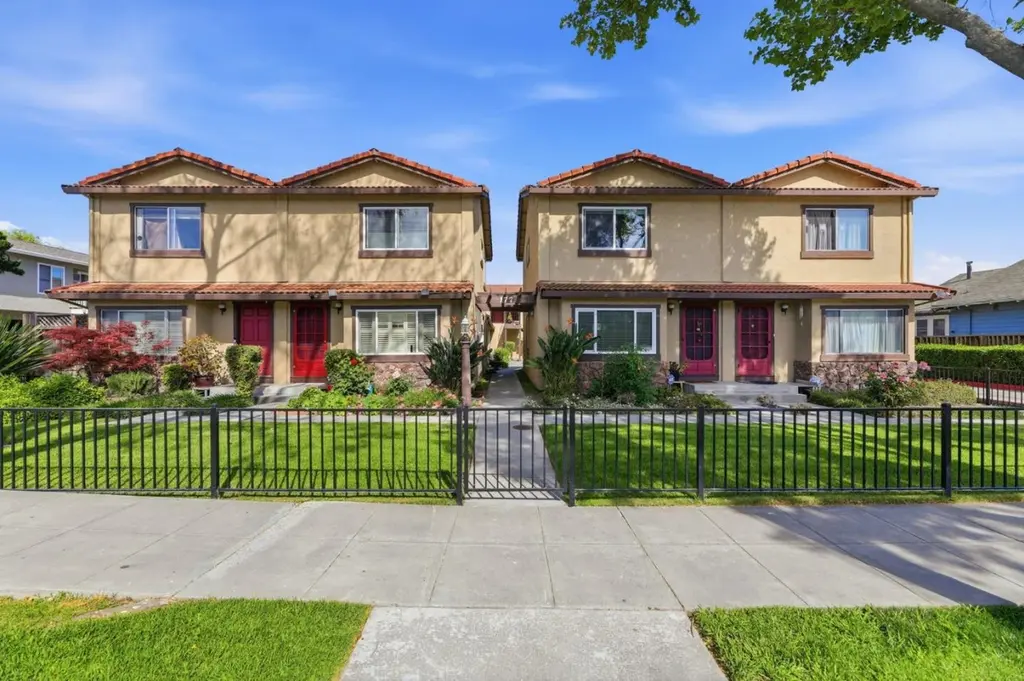
177 Monroe St #8 · Santa Clara, CA
Flood risk 1/10 · Minimal
- FEMA flood zone
- X (shaded)
- Chance of flooding over 30 yrs
- 0.0%
- Est. flood insurance / yr
- $507 – $1,088
Fire risk 1/10 · Minimal
- Est. fire insurance / yr
- $659 – $1,223
Heat risk 5/10 · Moderate
- Hot days now (above 93°F)
- 7 days/yr
- Hot days in 30 yrs
- 14 days/yr
Wind risk 1/10 · Minimal
- Chance of severe wind over 30 yrs
- —
Air-quality risk 9/10 · Severe
- Unhealthy air days now
- 17 days/yr
- Unhealthy air days in 30 yrs
- 17 days/yr
Risk factors via First Street. Map © Google.
Why this score? — see what drove the D- grade
The composite is a weighted blend of 9 inputs, each scored 0–100. Each bar is that input's sub-score; the figure is the points it added to the 100-point composite (weight × sub-score).
- ARV discount +15.0/15.0
- Schools +5.3/10.0
- Appreciation +4.4/10.0
- Rent growth +4.3/5.0
- Livability +3.9/5.0
- Cash flow +3.8/30.0
- Condition / age +2.5/5.0
- 1% rule +0.5/10.0
- DSCR +0.0/10.0
$598,000
🖨 Deal sheet 📄 Offer letter ✓ Due diligence
Listing remarks MLS
Located next to Washington Park, this Condo is priced to be affordable. Its in a nice area centrally located. Its has a one car garage and walk in closer.
Key facts
- $320 HOA
- Garage
- Built 1989
Neighborhood map
What this means for you Summary
Snapshot
- This is a 2-bed/1.0-bath condo listed at $598k.
Deal economics
- At list price, monthly cash flow is $-2k ($-21k/yr) — negative.
- To cash-flow at today's rent, offer at most $292k (51.1% below list).
- To meet the 1% rule (rent ≥ 1% of price), the offer needs to be $326k (45.5% below list).
- Recommended offer: $292k (51.1% below list) — sets the bar for cash-flow.
- Cap rate 2.8% vs local median 1.3% in Santa Clara — top-decile yield for the area; either an underpriced asset or a hidden risk that comps aren't pricing in. Stress-test before assuming the spread holds.
Location & tenants
- Location reads 78/100 on livability (#69 in CA, #2,627 nationally) — a middle-class / working-renter tenant base. Strengths: amenities A+, commute A+, employment A+; Watch: cost of living F.
- Santa Clara Unified (urban): math 49% / reading 66% proficiency, ranked #75 of 517 in CA (top 14%) — acceptable for families but not a draw, mixed tenant base, ~2y average lease.
- Market conditions: Rents rising fast (+7.3%/yr); 69 active listings in the ZIP; 37 comparable units currently listed for rent nearby; rentals leasing fast (median 8d on market — plan ~1-2 weeks tenant-placement turnaround); high-income renter base; 3,838 units permitted in Santa Clara County in 2024 (1,886 in 5+ unit buildings).
Forward outlook
- Local home prices are declining (-1.2%/yr); year-one equity from $4k of loan paydown is wiped out by about $7k of value loss. Plan a longer hold.
- Santa Clara County population projected at +24% by 2050 — long-run rental-demand tailwind backs the buy-and-hold thesis.
Negotiation context
- It's been on market 78 days — a 6% lower offer ($562k) is reasonable based on typical stale-listing flexibility.
- 3 sale attempts with the ask held roughly flat each time — persistent listings suggest the price (not the market) is what's stuck; bring a comps-based counter.
Risks & watch-outs
- Climate carrying-cost: extreme-heat days projected 7→14/yr by 2055 (HVAC capex compounding) — expect insurance premiums to compound above CPI over the hold.
Questions for the listing agent
- What do current leases actually rent for vs. the listed asking? Can we see a recent rent roll and the last 12 months of T-12 income?
- It's been on market 78 days. Have you received any prior offers? Is the seller open to a 51% concession, seller financing, or rate buy-down credit?
- What does the HOA fee cover, when was the last increase, and are there any pending special assessments or reserve-fund shortfalls?
- Any open or pending special assessments — roof, HVAC, plumbing, elevator, façade? What's the per-unit balance and payoff schedule, and is the seller paying it off at close or rolling it to the buyer?
- Why hasn't it sold? Are there any deal-killer items the seller is aware of (foundation, flood, title, zoning, code violations)?
- Is there a deadline driving the sale (1031 exchange, divorce, estate, relocation)? That informs how much negotiation room exists.
- Schools are B-rated — typically a magnet for longer-tenancy family renters. What's the average tenant stay here, and is there a school-zone premium baked into asking?
- The area grade is low — what's the realistic commute time and amenity access for the typical tenant pool here? Any planned neighborhood developments (good or bad) we should know about?
- What's the average days-on-market for RENTAL listings here right now (not sales)? A rising rental-DOM trend means longer vacancies and softer asking-rent achievability than the comps imply.
- What's the recent tenant-quality profile in this submarket — average credit score on applications, eviction rate, late-payment / NSF rate, and stable-employment percentage? A property-management company in the area should have these aggregated.
- How much new apartment / multifamily construction is in the pipeline within 1–3 miles? Heavy new supply (>2% of stock underway) typically softens rents 12–24 months out; light construction supports rent growth.
Investment metrics
- 1% rule
- 0.55% ✗
- Cap rate
- 2.82%
- Cash-on-cash
- -12.40%
- DSCR
- 0.45
- GRM
- 15.3
CMA / ARV
- ARV (median comp)
- $751,489
- List price
- $598,000
- Delta
- -20.42%
- Verdict
- UNDERPRICED
- Comps
- 11 within 1.0 mi
Projected returns pro-forma
-1.22% appreciation · 7.33% rent growth · sell at horizon
- IRR
- -20.7%
- Equity multiple
- 0.13×
- Total profit
- $-146,019
- Equity at exit
- $138,184
- IRR
- -10.0%
- Equity multiple
- 0.05×
- Total profit
- $-159,053
- Equity at exit
- $139,914
Cash invested: $167,440 (down + closing). Projections, not guarantees.
Landlord ↔ Tenant lean methodology
- Overall (STATE)
- 18 Strongly Tenant-Friendly
- State California
- 18 Strongly Tenant-Friendly · D+13
- County
- — inherits STATE
- City
- — inherits STATE
ZIP-level market 95050
- Home prices YoY
- -0.3%
- Rents YoY
- 7.3%
- Active inventory
- 69
- Price-to-rent
- 15.3×
Monthly cashflow live
- Estimated rent
- $3,262 high interval (Pro) →
- Mortgage (P&I)
- −$3,136
- Tax from tax record
- −$602 /mo · $7,218/yr
- Insurance
- −$249
- HOA
- −$320
- Vacancy / Maint / Mgmt
- −$685
- Net cashflow
- $-1,730
Break-even live
UW: 25.0% down · 7.5% · 30yr · 1.5% tax · 5.0% vac · 8.0% maint · 8.0% mgmt
Financing live
Cash to close
- Down payment
- $149,500
- Closing costs
- $17,940
- Reserves months
- —
- Total cash needed
- —
Loan-product check · same deal, 3 products live
Conventional
25% down · 7.5% · 30yr
- Down + closing
- —
- Monthly P&I
- —
- Monthly cashflow
- —
- DSCR
- —
- Eligible?
- —
Personal DTI + credit; lowest rate.
DSCR
20% down · 8.5% · 30yr
- Down + closing
- —
- Monthly P&I
- —
- Monthly cashflow
- —
- DSCR
- —
- Eligible?
- —
No personal income docs; deal must DSCR.
Hard money
10% down · 12.0% · 12mo
- Down + closing
- —
- Monthly P&I
- —
- Monthly cashflow
- —
- DSCR
- —
- Eligible?
- —
Short-term bridge; refi at stabilization.
Rent comps 37 comps
| Address | Beds | Baths | Sqft | Rent | $/sqft | DOM | Units | Dist |
|---|---|---|---|---|---|---|---|---|
| 104 Roxbury St Unit 2 Santa Clara, CA | 2.0 | 1.0 | 800 | $2,900 | $3.62 | 44d | 1 | 0.12mi |
| 2147 Newhall St Santa Clara, CA | 1.0–2.0 | 1.0–2.0 | 850 | $4,348 | $5.12 | 7d | 7 | 0.25mi |
| 856 Monroe St Santa Clara, CA | 2.0 | 1.0 | 775 | $3,200 | $4.13 | 44d | 1 | 0.46mi |
| 1260 N Bascom Ave San Jose, CA | 1.0–2.0 | 1.0 | 786 | $2,695 | $3.43 | 24d | 2 | 0.51mi |
| 2636 Newhall St Santa Clara, CA | 1.0 | 1.0 | 700 | $2,655 | $3.79 | 44d | 1 | 0.52mi |
| 450 California St Unit 1 Santa Clara, CA | 2.0 | 1.0 | 850 | $2,750 | $3.24 | 7d | 1 | 0.53mi |
| 480 California St Unit 1 Santa Clara, CA | 2.0 | 1.0 | 925 | $2,850 | $3.08 | 22d | 1 | 0.54mi |
| 390 N Winchester Blvd Unit 3 3D Santa Clara, CA | 1.0 | 1.0 | 530 | $2,079 | $3.92 | 3d | 1 | 0.71mi |
| 617 Enright Ave #1564 Santa Clara, CA | 3.0 | 2.0 | 1124 | $4,900 | $4.36 | 3d | 1 | 0.79mi |
| 588 El Camino Real Santa Clara, CA | 1.0–2.0 | 1.0–2.0 | 976 | $5,993 | $6.14 | 2d | 11 | 0.87mi |
| 1359 Lewis St Unit 3 Santa Clara, CA | 1.0 | 1.0 | 600 | $1,975 | $3.29 | 7d | 1 | 0.87mi |
| 1359 Lewis St Santa Clara, CA | 1.0 | 1.0 | 600 | $1,975 | $3.29 | 4d | 1 | 0.87mi |
| 1461 Main St #1 Santa Clara, CA | 2.0 | 2.0 | 1000 | $3,750 | $3.75 | 20d | 1 | 0.91mi |
| 2214 Serra Ave #1732 Santa Clara, CA | 1.0 | 1.0 | 576 | $2,680 | $4.65 | 7d | 1 | 0.93mi |
| 315 Bellerose Dr Apt 2 San Jose, CA | 1.0 | 1.0 | 800 | $2,495 | $3.12 | 2d | 1 | 0.99mi |
| 444 Saratoga Ave Santa Clara, CA | 1.0–2.0 | 1.0–2.0 | 972 | $4,000 | $4.11 | 2d | 21 | 1.05mi |
| 350 Chastain Pl Unit 2055 Santa Clara, CA | 1.0 | 1.0 | 698 | $4,710 | $6.75 | 44d | 1 | 1.15mi |
| 350 Chastain Pl Unit 2058 Santa Clara, CA | 1.0 | 1.0 | 698 | $3,550 | $5.09 | 7d | 1 | 1.15mi |
| 1200 Rickabaugh Way Santa Clara, CA | 3.0 | 1.0–2.0 | 910 | $5,485 | $6.02 | 2d | 103 | 1.19mi |
| 1700 Civic Center Dr #315 Santa Clara, CA | 1.0 | 1.0 | 650 | $2,900 | $4.46 | 44d | 1 | 1.22mi |
| 2327 Pruneridge Ave Apt 8 Santa Clara, CA | 2.0 | 1.0 | 750 | $2,795 | $3.73 | 7d | 1 | 1.24mi |
| 1700 Civic Center Dr Santa Clara, CA | 1.0 | 1.0 | 651 | $2,698 | $4.14 | 20d | 2 | 1.24mi |
| 1946 Jackson St Santa Clara, CA | 3.0 | 1.0 | 985 | $4,250 | $4.31 | 7d | 1 | 1.24mi |
| 833 Maryann Dr Unit 2 Santa Clara, CA | 1.0 | 1.0 | 610 | $1,920 | $3.15 | 10d | 1 | 1.25mi |
| 334 Santana Row #349 San Jose, CA | 2.0 | 2.0 | 1099 | $4,650 | $4.23 | 3d | 1 | 1.31mi |
| 2365 Sutter Ave Unit 7 Santa Clara, CA | 1.0 | 1.0 | 550 | $2,095 | $3.81 | 10d | 1 | 1.32mi |
| 966 Parker Ct Unit 2 Santa Clara, CA | 1.0 | 1.0 | 600 | $2,000 | $3.33 | 7d | 1 | 1.34mi |
| 185 Tyler Ave Santa Clara, CA | 3.0 | 2.0 | 1050 | $5,000 | $4.76 | 3d | 1 | 1.35mi |
| 1495 Don Ave Santa Clara, CA | 1.0 | 1.0 | 536 | $2,377 | $4.43 | 3d | 2 | 1.36mi |
| 2492 Karen Dr Santa Clara, CA | 1.0 | 1.0 | 494 | $2,350 | $4.76 | 3d | 3 | 1.38mi |
| 2386 Sutter Ave Apt 8 Santa Clara, CA | 1.0 | 1.0 | 650 | $2,195 | $3.38 | 2d | 1 | 1.39mi |
| 1860 Scott Blvd #1524 Santa Clara, CA | 2.0 | 1.0 | 750 | $3,220 | $4.29 | 24d | 1 | 1.40mi |
| 1819 Joan Way Santa Clara, CA | 1.0 | 1.0 | 600 | $2,095 | $3.49 | 44d | 1 | 1.43mi |
| 367 Santana Hts San Jose, CA | 1.0–2.0 | 1.0–2.5 | 1859 | $6,672 | $3.59 | 2d | 5 | 1.45mi |
| 367 Santana Row #1327 San Jose, CA | 1.0–2.0 | 1.0–2.0 | 1059 | $5,450 | $5.15 | 17d | 2 | 1.47mi |
| 846 Emory St Unit 846-08 San Jose, CA | 1.0 | 1.0 | 650 | $1,995 | $3.07 | 24d | 1 | 1.48mi |
| 1375 Magnolia Ave Unit 1 San Jose, CA | 2.0 | 1.0 | 832 | $4,400 | $5.29 | 44d | 1 | 1.50mi |
HOA detail condo
- Monthly dues
- $320 · $3,840/yr
- Assessments
- None detected in remarks — confirm with the listing agent.
Listing history 18 events
-
2026-06-18days on market $598,000 Active 78 DOM
-
2026-06-17days on market $598,000 Active 77 DOM
-
2026-06-16days on market $598,000 Active 76 DOM
-
2026-06-15days on market $598,000 Active 75 DOM
-
2026-06-13days on market $598,000 Active 73 DOM
-
2026-06-13days on market $598,000 Active 72 DOM
-
2026-06-09days on market $598,000 Active 69 DOM
-
2026-06-08days on market $598,000 Active 68 DOM
-
2026-06-07days on market $598,000 Active 67 DOM
-
2026-06-05days on market $598,000 Active 64 DOM
-
2026-06-03days on market $598,000 Active 63 DOM
-
2026-06-02days on market $598,000 Active 62 DOM
-
2026-06-01days on market $598,000 Active 61 DOM
-
2026-05-31days on market $598,000 Active 60 DOM
-
2026-04-02$598,000 Active 154-char remark
Show marketing remark (154 chars)
Located next to Washington Park, this Condo is priced to be affordable. Its in a nice area centrally located. Its has a one car garage and walk in closer.
-
2026-04-02$598,000 Active 154-char remark
Show marketing remark (154 chars)
Located next to Washington Park, this Condo is priced to be affordable. Its in a nice area centrally located. Its has a one car garage and walk in closer.
-
2026-02-04historical
-
2025-09-12Active
ⓘ Source: listings_history table (triggers on properties + properties_extension) + one-shot
backfill from property_details.listing_events for pre-trigger history.
Tax reassessment forecast CA · Resets to sale price
- Current annual tax
- $7,218 · $602/mo
- Projected year-2 tax
- $7,218 · $602/mo
- Expected delta
- $0/yr ($0/mo · 0.0%)
ⓘ Screening estimate from a state-policy table — verify with the county assessor before closing.
Climate risk First Street
- Flood 1/10 Low FEMA zone X (shaded) · 0% chance over 30 yrs
- Wildfire 1/10 Low
- Heat 5/10 Major 7 d/yr ≥93°F today · 14 d/yr by 30 yrs out
- Wind 1/10 Low
- Air quality 9/10 Extreme 17 unhealthy d/yr today · 17 by 30 yrs out
Nearby sold comps map
Loading sold comps map…
Walkable amenities ~0.75 mi
Loading nearby amenities…
Taxation est. · year 1
- Rental income
- $39,140
- − Mortgage interest
- −$33,497
- − Property taxes
- −$7,218
- − Insurance
- −$2,990
- − Repairs & maintenance
- −$3,131
- − Management
- −$3,131
- − HOA
- −$3,840
- − Depreciation
- −$17,396
- Taxable loss
- −$32,064
- Est. tax savings @ 24.0%
- +$7,695
- After-tax cash flow
- $-13,064/yr
For passive investors: Depreciation is non-cash, so a rental often shows a tax loss while cash-flowing — sheltering income. Rental losses are passive: they offset passive income freely, and up to $25,000/yr can offset ordinary (W-2) income if you actively participate and your MAGI is under $100k (phasing out to $0 by $150k); unused losses carry forward. On sale, claimed depreciation is recaptured at up to 25%, and gains may owe capital-gains tax (a 1031 exchange can defer both). Figures are a year-1 estimate at your 24.0% rate — not tax advice; consult a CPA.
Schools (NCES district)
- District
- Santa Clara Unified
- NCES district ID
- 0635430
- Math proficiency
- 49% ▼ -3.00%
- Reading proficiency
- 66% ▲ 4.00%
- Median HH income
- $97,320
- Composite
- 53.46/100
- National rank
- #1459
- State rank
- #75 of 517 in CA
Livability — Santa Clara
- Score
- 78/100
- State rank
- #69
- US rank
- #2627
Category grades
Schools grade is shown separately in the Schools card above.
Census & demographics
- Census place
- Santa Clara, CA
- County
- Santa Clara County · 1,806,974 people
- City population
- 127,592
- Metro
- San Jose-Sunnyvale-Santa Clara, CA
- Population (ZIP)
- 39,834
- Household income
- $138,466
- Rent vs Own
- Severe rent burden
- 2356.0
Population outlook (Santa Clara County) Hauer SSP2
- Today (2025)
- 2,179,074 people
- By 2030
- 2,301,297 · +5.6%
- By 2040
- 2,528,195 · +16.0%
- By 2050
- 2,712,135 · +24.5%
- By 2075
- 2,998,701 · +37.6%
- By 2100
- 2,931,429 · +34.5%
Race, ethnicity, and origin ACS 2023
- Neighborhood character
- Highly diverse neighborhood (Simpson 0.71)
- Race & ethnicity
- White 37% Asian 33% Hispanic / Latino 22% Two or more races 9% Black 2% Pacific Islander 1%
- Hispanic origin (detail)
- Mexican 17%
- Common ancestry
- Russian 4% Italian 2% Romanian 2%
- Foreign-born
- 37% · Canada, China, Vietnam
- Languages at home
- 50% English-only · Spanish 13% Other Indo-European 11% Other Asian/Pacific 7%
Political lean MEDSL · Santa Clara
- 2024 margin
- Solid D (+40.0) · D 68.1% · R 28.1% · Other 3.8%
- 2008→2024 swing
- -0.9pp no change · 2008: 40.9pp · 2024: 40.0pp
- All cycles
- 2024: D+40.0 2020: D+47.4 2016: D+52.5 2012: D+42.1 2008: D+40.9
Not yet ingested
- Civics
- —
Market trends
- HPI YoY
- ▼ -1.22%
- Current HPI
- 388.663
- Rent YoY
- ▲ 7.33%
- Metro
- San Jose-Sunnyvale-Santa Clara, CA
- State GDP YoY
- ▲ 3.21%
- F500 in state
- 116
Industry mix (Fortune 500 HQ in CA)
| Industry | F500 HQs | Revenue |
|---|---|---|
| Technology | 27 | $1,492B |
|
||
| Financial Services | 3 | $174B |
|
||
| Retail | 3 | $44B |
|
||
| Insurance | 3 | $26B |
|
||
| Media / Entertainment | 2 | $115B |
|
||
| Pharmaceuticals / Biotech | 2 | $62B |
|
||
Price history
+0.0% since first listed4 events — show timeline
- 2026-04-02 Listed $598,000 bridgeMLS, Bay East AOR, or Contra Costa AOR
- 2026-04-02 Listed $598,000 MLSListings
- 2026-02-04 Listing Removed — bridgeMLS, Bay East AOR, or Contra Costa AOR
- 2025-09-12 Listed — bridgeMLS, Bay East AOR, or Contra Costa AOR
Property tax history
+10.8%/yrLatest (2025): $7,218 · +330.9% YoY. Source: county tax records.
Cash-flow waterfall
monthlySold comps — $/sqft
last 12 mo · ≤1 miLoading sold comps…