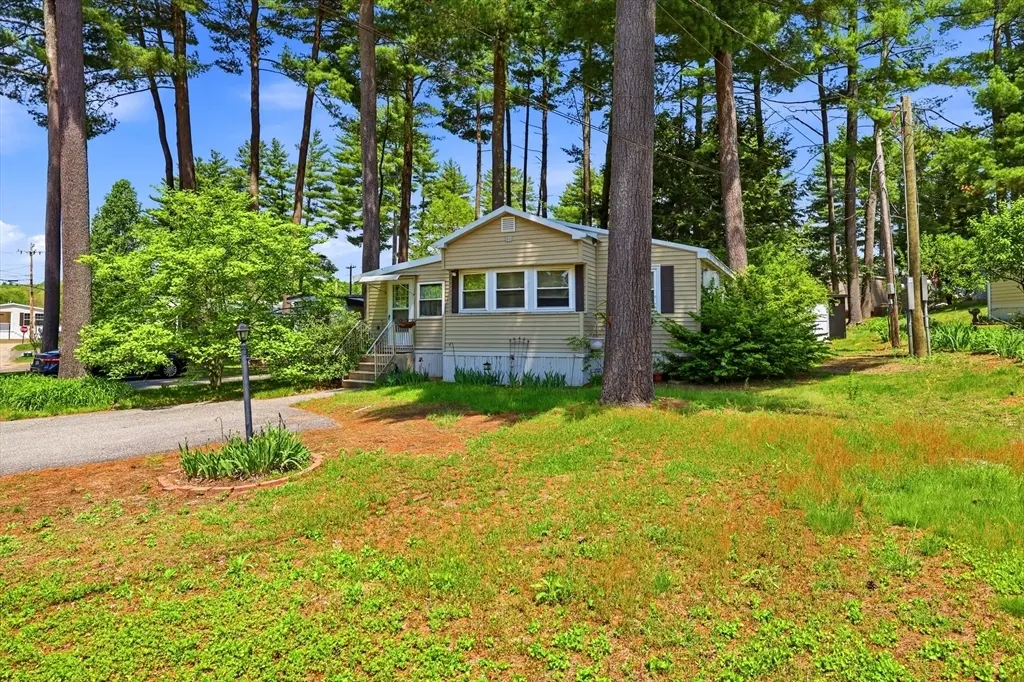
281 Chauncey Walker St Unit 86B · Belchertown, MA
Flood risk 1/10 · Minimal
- FEMA flood zone
- X
- Chance of flooding over 30 yrs
- 0.0%
- Est. flood insurance / yr
- $507 – $1,088
Fire risk 3/10 · Minor
- Est. fire insurance / yr
- $915 – $1,699
Heat risk 4/10 · Minor
- Hot days now (above 95°F)
- 7 days/yr
- Hot days in 30 yrs
- 17 days/yr
Wind risk 5/10 · Moderate
- Chance of severe wind over 30 yrs
- 23.0%
Air-quality risk 3/10 · Minor
- Unhealthy air days now
- 2 days/yr
- Unhealthy air days in 30 yrs
- 4 days/yr
Risk factors via First Street. Map © Google.
Why this score? — see what drove the B+ grade
The composite is a weighted blend of 9 inputs, each scored 0–100. Each bar is that input's sub-score; the figure is the points it added to the 100-point composite (weight × sub-score).
- Cash flow +30.0/30.0
- ARV discount +15.0/15.0
- 1% rule +10.0/10.0
- DSCR +10.0/10.0
- Schools +3.9/10.0
- Livability +3.9/5.0
- Rent growth +2.5/5.0
- Condition / age +2.0/5.0
- Appreciation +0.0/10.0
$119,900
🖨 Deal sheet 📄 Offer letter ✓ Due diligence
Listing remarks MLS
Wonderful 2 bedroom mobile with dinnig area and a 3 season enclosed porch. This mobile has been updated in 2004.......roof new tillt windows, and siding.. Large livingroom open to kitchen and dinning area. Call listing agent for appointment.......Easy to show.........On Lockbox. Owner wants offer.....
Key facts
- Newer furnace
- Updated water pipes
- 6,600 sq ft lot
Tags
Property features AI
Finance
- Other: Lot size about 0.15 acres; Directions: Use GPS to Pine Valley Plantation to Ave B to lot 86
- Financial info: No additional financial details provided
- HOA & community: Homeowners association with a fee (approximately $344); Senior community; Community has walk/jog trails and bike path
Exterior
- Parking: 2 off-street paved parking spaces; Open parking
- Security: No security features listed
- Utilities: Public sewer; Well water; Electric supply available for electric oven
- Home design: Mobile home; Single-level (entry level not specified)
- Construction: Metal roof; Slab foundation; Built (year per public records)
- Exterior features: Wooded lot; Porch
Interior
- Kitchen: Range; Dishwasher; Refrigerator
- Bedrooms: No bedroom count provided
- Flooring: Vinyl; Carpet
- Bathrooms: 1 full bathroom
- Heating & cooling: Oil heating; Ductless heating; Ductless cooling; Has heating and cooling
- Interior features: Total of 4 rooms; Porch
- Laundry & utility: Washer and dryer included; Washer hookup
Neighborhood map
What this means for you Summary
Snapshot
- This is a 2-bed/1.0-bath manufactured listed at $120k. Condition is rated fair.
Deal economics
- At list price, monthly cash flow is $468 ($6k/yr) — positive.
- The deal already cash-flows at list — no discount required.
- Meets the 1% rule at list price ($2k rent vs $120k).
- Recommended offer: $118k (1.5% below list) — sets the bar for market timing.
- Cap rate 11.0% vs local median 3.0% in Belchertown — top-decile yield for the area; either an underpriced asset or a hidden risk that comps aren't pricing in. Stress-test before assuming the spread holds.
Location & tenants
- Location reads 77/100 on livability (#56 in MA, #2,946 nationally) — a middle-class / working-renter tenant base. Strengths: housing A+, health & safety A+, crime A; Watch: cost of living D+, amenities F.
- Belchertown (rural): math 35% / reading 49% proficiency, ranked #176 of 302 in MA (top 58%) — families likely to look elsewhere, expect single-tenant / working-renter base with shorter leases; only 18% free/reduced lunch — higher-income household profile.
- Market conditions: 55 active listings in the ZIP; solid renter incomes; 349 units permitted in Hampshire County in 2024 (185 in 5+ unit buildings).
Forward outlook
- Local home prices are declining (-3.0%/yr); year-one equity from $829 of loan paydown is wiped out by about $4k of value loss. Plan a longer hold.
- Hampshire County population projected at +5% by 2050 — modest demand growth; plan on rents tracking national, not racing it.
- At projected returns (-3.0% appreciation + 3.0% rent growth), your $34k cash investment doubles in ~8 years — after that, you're playing with house money.
Negotiation context
- It's been on market 20 days — a 2% lower offer ($118k) is reasonable based on typical stale-listing flexibility.
- 2 sale attempts since 15y ago with the ask held roughly flat each time — persistent listings suggest the price (not the market) is what's stuck; bring a comps-based counter.
- Current owner paid $15k; list at $120k implies a 699% gain — meaningful room to come down on a strong offer.
Risks & watch-outs
- Climate carrying-cost: moderate wind risk, 23% chance of damaging wind over 30y — expect insurance premiums to compound above CPI over the hold.
Questions for the listing agent
- Have any recent inspections been done? Can we get a copy of the seller's disclosures and any deferred-maintenance estimates?
- Built in 1973 — when were the roof, HVAC, electrical panel, plumbing, and water heater last replaced?
- What does the HOA fee cover, when was the last increase, and are there any pending special assessments or reserve-fund shortfalls?
- Is there a deadline driving the sale (1031 exchange, divorce, estate, relocation)? That informs how much negotiation room exists.
- What's the average days-on-market for RENTAL listings here right now (not sales)? A rising rental-DOM trend means longer vacancies and softer asking-rent achievability than the comps imply.
- What's the recent tenant-quality profile in this submarket — average credit score on applications, eviction rate, late-payment / NSF rate, and stable-employment percentage? A property-management company in the area should have these aggregated.
- How much new for-sale + rental construction is in the pipeline within 1–3 miles? Heavy new supply typically softens prices + rents 12–24 months out; constrained supply supports both.
Investment metrics
- 1% rule
- 1.73% ✓
- Cap rate
- 10.98%
- Cash-on-cash
- 16.74%
- DSCR
- 1.74
- GRM
- 4.8
CMA / ARV
- ARV (on-the-fly)
- $184,080
- Comps found
- 1
Show comp detail 1 sale within ~0.75 mi
| Address | Dist | Beds/Ba | Sqft | Sold | Price | $/sf | Match |
|---|---|---|---|---|---|---|---|
| 281 Chauncey Walker #185 | 0.30mi | 2/1.0 | 720 (-8%) | 12mo | $170,000 | $236 | 63 |
Match score weights: distance 35% · size 25% · config 20% · recency 20%. Top-matched comps best support the ARV.
Projected returns pro-forma
-3.0% appreciation · 3.0% rent growth · sell at horizon
- IRR
- 8.1%
- Equity multiple
- 1.32×
- Total profit
- $10,636
- Equity at exit
- $17,877
- IRR
- 17.4%
- Equity multiple
- 2.45×
- Total profit
- $48,648
- Equity at exit
- $10,367
Cash invested: $33,572 (down + closing). Projections, not guarantees.
Landlord ↔ Tenant lean methodology
- Overall (STATE)
- 20 Strongly Tenant-Friendly
- State Massachusetts
- 20 Strongly Tenant-Friendly · D+15
- County
- — inherits STATE
- City
- — inherits STATE
ZIP-level market 01007
- Home prices YoY
- -28.1%
- Active inventory
- 55
- Price-to-rent
- 4.8×
Monthly cashflow live
- Estimated rent
- $2,077 medium interval (Pro) →
- Mortgage (P&I)
- −$629
- Tax est. 1.5%
- −$150 /mo · $1,798/yr
- Insurance
- −$50
- HOA
- −$344
- Vacancy / Maint / Mgmt
- −$436
- Net cashflow
- $468
Break-even live
UW: 25.0% down · 7.5% · 30yr · 1.5% tax · 5.0% vac · 8.0% maint · 8.0% mgmt
Financing live
Cash to close
- Down payment
- $29,975
- Closing costs
- $3,597
- Reserves months
- —
- Total cash needed
- —
Loan-product check · same deal, 3 products live
Conventional
25% down · 7.5% · 30yr
- Down + closing
- —
- Monthly P&I
- —
- Monthly cashflow
- —
- DSCR
- —
- Eligible?
- —
Personal DTI + credit; lowest rate.
DSCR
20% down · 8.5% · 30yr
- Down + closing
- —
- Monthly P&I
- —
- Monthly cashflow
- —
- DSCR
- —
- Eligible?
- —
No personal income docs; deal must DSCR.
Hard money
10% down · 12.0% · 12mo
- Down + closing
- —
- Monthly P&I
- —
- Monthly cashflow
- —
- DSCR
- —
- Eligible?
- —
Short-term bridge; refi at stabilization.
HOA detail
- Monthly dues
- $344 · $4,128/yr
Listing history 16 events
-
2026-06-18days on market $119,900 Active 20 DOM
-
2026-06-17days on market $119,900 Active 19 DOM
-
2026-06-16days on market $119,900 Active 18 DOM
-
2026-06-15days on market $119,900 Active 17 DOM
-
2026-06-14days on market $119,900 Active 15 DOM
-
2026-06-10days on market $119,900 Active 12 DOM
-
2026-06-09days on market $119,900 Active 11 DOM
-
2026-06-08days on market $119,900 Active 10 DOM
-
2026-06-07days on market $119,900 Active 9 DOM
-
2026-06-05days on market $119,900 Active 6 DOM
-
2026-06-03days on market $119,900 Active 5 DOM
-
2026-06-02statusdays on market $119,900 Active 4 DOM
-
2026-06-01days on market $119,900 New 3 DOM
-
2026-05-31days on market $119,900 New 2 DOM
-
2026-05-30remarks 693-char remark
-
2026-05-30$119,900 New 1 DOM
ⓘ Source: listings_history table (triggers on properties + properties_extension) + one-shot
backfill from property_details.listing_events for pre-trigger history.
Climate risk First Street
- Flood 1/10 Low FEMA zone X · 0% chance over 30 yrs
- Wildfire 3/10 Moderate
- Heat 4/10 Moderate 7 d/yr ≥95°F today · 17 d/yr by 30 yrs out
- Wind 5/10 Major 23% chance of damaging wind over 30 yrs
- Air quality 3/10 Moderate 2 unhealthy d/yr today · 4 by 30 yrs out
Nearby sold comps map
Loading sold comps map…
Walkable amenities ~0.75 mi
Loading nearby amenities…
Taxation est. · year 1
- Rental income
- $24,924
- − Mortgage interest
- −$6,716
- − Property taxes
- −$1,798
- − Insurance
- −$600
- − Repairs & maintenance
- −$1,994
- − Management
- −$1,994
- − HOA
- −$4,128
- − Depreciation
- −$3,488
- Taxable income
- $4,206
- Est. tax owed @ 24.0%
- −$1,009
- After-tax cash flow
- $4,609/yr
For passive investors: Depreciation is non-cash, so a rental often shows a tax loss while cash-flowing — sheltering income. Rental losses are passive: they offset passive income freely, and up to $25,000/yr can offset ordinary (W-2) income if you actively participate and your MAGI is under $100k (phasing out to $0 by $150k); unused losses carry forward. On sale, claimed depreciation is recaptured at up to 25%, and gains may owe capital-gains tax (a 1031 exchange can defer both). Figures are a year-1 estimate at your 24.0% rate — not tax advice; consult a CPA.
Condition & rehab AI · 1 photo
This manufactured home requires significant exterior repairs and maintenance, including painting, roof replacement, and siding repair, to improve its condition and value.
Repairs flagged
- Major siding — Significant wear and tear
- Major roof — Aged appearance
- Major exterior paint — Peeling and weathered appearance
Value-add opportunities
- Both painting the exterior — Enhances curb appeal and value
- Both roof replacement — Critical for structural integrity and value
- Both exterior siding repair — Improves appearance and value
Renovation cost estimate screening
| Repair item | Severity | Est. cost |
|---|---|---|
| siding · Significant wear and tear | Major | $15,000–50,000 |
| roof · Aged appearance | Major | $15,000–50,000 |
| exterior paint · Peeling and weathered appearance | Major | $15,000–50,000 |
| Total estimated repair cost · 3 items | $45,000–150,000 |
Value-add ROI direction
- Both painting the exterior — Enhances curb appeal and value ↑
- Both roof replacement — Critical for structural integrity and value ↑
- Both exterior siding repair — Improves appearance and value ↑
ⓘ Cost ranges are severity-bucket heuristics (US national rule-of-thumb). Get contractor quotes + a written scope before underwriting a rehab budget.
Schools (NCES district)
- District
- Belchertown
- NCES district ID
- 2502430
- Math proficiency
- 35% ▼ -9.00%
- Reading proficiency
- 49% ▲ 2.00%
- Median HH income
- $77,349
- Composite
- 38.71/100
- National rank
- #4136
- State rank
- #176 of 302 in MA
Livability — Belchertown
- Score
- 77/100
- State rank
- #56
- US rank
- #2946
Category grades
Schools grade is shown separately in the Schools card above.
Census & demographics
- County
- Hampshire County · 76,035 people
- City population
- 15,419
- Metro
- Springfield, MA
- Population (ZIP)
- 15,419
- Household income
- $108,125
- Rent vs Own
- Severe rent burden
- 191.0
Population outlook (Hampshire County) Hauer SSP2
- Today (2025)
- 166,577 people
- By 2030
- 168,928 · +1.4%
- By 2040
- 171,197 · +2.8%
- By 2050
- 175,542 · +5.4%
- By 2075
- 199,884 · +20.0%
- By 2100
- 211,819 · +27.2%
Race, ethnicity, and origin ACS 2023
- Neighborhood character
- Predominantly White (85%)
- Race & ethnicity
- White 85% Hispanic / Latino 6% Two or more races 5% Asian 3% Black 2%
- Hispanic origin (detail)
- Mexican 2% Puerto Rican 2%
- Common ancestry
- Lithuanian 14% Romanian 14% Italian 3%
- Foreign-born
- 5% · China, Canada
- Languages at home
- 91% English-only · Spanish 4% French/Haitian/Cajun 2% Other Asian/Pacific 1%
Political lean MEDSL · Hampshire
- 2024 margin
- Solid D (+41.9) · D 69.5% · R 27.6% · Other 2.9%
- 2008→2024 swing
- -3.6pp toward R · 2008: 45.6pp · 2024: 41.9pp
- All cycles
- 2024: D+41.9 2020: D+46.8 2016: D+39.5 2012: D+43.8 2008: D+45.6
Not yet ingested
- Civics
- —
Market trends
- HPI YoY
- ▼ -107.42%
- Current HPI
- 274.6244
- Rent YoY
- —
- Metro
- Springfield, MA
- State GDP YoY
- ▲ 2.28%
- F500 in state
- 38
Industry mix (Fortune 500 HQ in MA)
| Industry | F500 HQs | Revenue |
|---|---|---|
| Technology | 3 | $17B |
|
||
| Insurance | 2 | $84B |
|
||
| Retail | 2 | $76B |
|
||
| Life Sciences | 1 | $43B |
|
||
| Energy Technology | 1 | $31B |
|
||
| Aerospace / Defense | 1 | $18B |
|
||
Price history
+499.5% since first listed3 events — show timeline
- 2026-05-29 Listed $119,900 MLS PIN
- 2013-04-30 Sold (MLS) $15,000 MLS PIN
- 2011-08-01 Listed $19,999 MLS PIN
Cash-flow waterfall
monthlySold comps — $/sqft
last 12 mo · ≤1 miLoading sold comps…