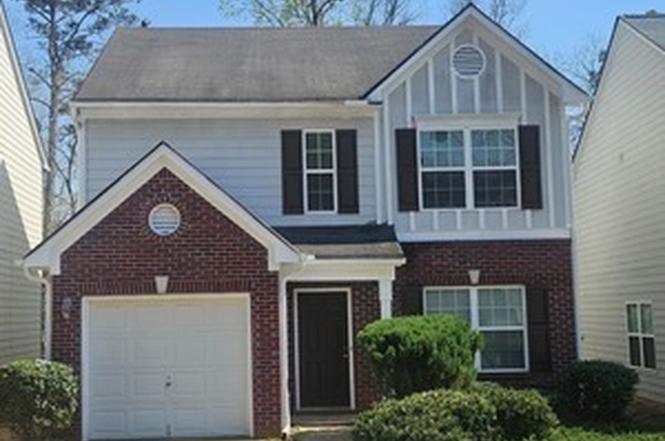
9432 Lakeview Rd #53 · Union City, GA
Flood risk 1/10 · Minimal
- FEMA flood zone
- X (unshaded)
- Chance of flooding over 30 yrs
- 0.0%
- Est. flood insurance / yr
- $507 – $1,088
Fire risk 3/10 · Minor
- Est. fire insurance / yr
- $963 – $1,789
Heat risk 6/10 · Moderate
- Hot days now (above 103°F)
- 7 days/yr
- Hot days in 30 yrs
- 18 days/yr
Wind risk 6/10 · Moderate
- Chance of severe wind over 30 yrs
- 27.0%
Air-quality risk 3/10 · Minor
- Unhealthy air days now
- 3 days/yr
- Unhealthy air days in 30 yrs
- 4 days/yr
Risk factors via First Street. Map © Google.
Why this score? — see what drove the C- grade
The composite is a weighted blend of 9 inputs, each scored 0–100. Each bar is that input's sub-score; the figure is the points it added to the 100-point composite (weight × sub-score).
- ARV discount +14.2/15.0
- Cash flow +10.9/30.0
- Appreciation +10.0/10.0
- Schools +4.5/10.0
- DSCR +3.2/10.0
- 1% rule +3.1/10.0
- Rent growth +3.1/5.0
- Livability +2.9/5.0
- Condition / age +2.5/5.0
$255,000
🖨 Deal sheet (PDF) 📄 Offer letter ✓ Due diligence
Listing remarks
Unlock the potential in this 4-bedroom, 2.5-bath home-an ideal opportunity for investors or homeowners ready to add their personal touch and build equity. Featuring a spacious open floor plan, the main living area flows seamlessly into the dining space and kitchen, offering a solid foundation for modern updates and future value. Natural light fills the home, enhancing the generous layout and highlighting the possibilities throughout. The well-sized bedrooms provide flexibility for rental income, guest accommodations, or a home office, while the primary suite offers a private retreat with room to elevate and customize. With fresh paint, new carpet, vinyl flooring and new roof already in plac
Key facts
- 3,615 sq ft lot
- Garage
- Built 2006
Property features AI
Finance
- Financial info: Investor-owned; Listing accepts Cash, Conventional, FHA, and VA financing
- HOA & community: Has association; Association fee covers maintenance of grounds
Exterior
- Parking: Has garage
- Utilities: Public water; Public sewer; Electricity available
- Home design: Single family residence; House; Two levels; Resale property
- Construction: Built in 2006
- Exterior features: Composition roof; Vinyl siding; Located on a cul-de-sac; Level lot; Lake in the community
Interior
- Kitchen: Pantry; Dishwasher; Microwave; Refrigerator
- Bedrooms: 4 bedrooms total; 1 bedroom on the main level
- Flooring: Carpet; Vinyl
- Bathrooms: 2 full bathrooms; 1 half bathroom (2.5 total)
- Heating & cooling: Central heating; Central air conditioning
- Interior features: Separate shower; Walk-in closet(s); Fireplace
- Laundry & utility: Laundry located in the kitchen
Neighborhood map
What this means for you Summary
Snapshot
- This is a 3-bed/2.5-bath single-family listed at $255k.
Deal economics
- At list price, monthly cash flow is $-112 ($-1k/yr) — negative.
- To cash-flow at today's rent, offer at most $235k (7.8% below list).
- To meet the 1% rule (rent ≥ 1% of price), the offer needs to be $207k (18.9% below list).
- Recommended offer: $207k (18.9% below list) — sets the bar for 1% rule.
Location & tenants
- Location reads 58/100 on livability (#443 in GA) — a working-class tenant base; expect higher turnover. Strengths: cost of living A+, housing A+; Watch: crime D+, amenities F, commute F.
- Fulton County (suburban): math 49% / reading 53% proficiency, ranked #12 of 174 in GA (top 7%) — acceptable for families but not a draw, mixed tenant base, ~2y average lease.
- Zoned schools: Liberty Point Elementary School (math 37% / reading 31%, grade F, #554 of 1,228 statewide, top 46%, 694 students, 100% FRL); Renaissance Middle School (math 22% / reading 27%, grade F, #301 of 470 statewide, top 66%, 1,166 students, 71% FRL); Langston Hughes High School (math 8% / reading 17%, grade F, #336 of 424 statewide, top 80%, 1,964 students, 65% FRL) — zoned schools average 78% FRL vs 41% district-wide (37 pts higher); higher-poverty schools than district average — tighter screening recommended.
- Zoned-school proficiency averages 24% at this address vs 51% district-wide (-27 pts) — the specific schools serving this property underperform the Fulton County average; the district grade overstates school quality for this exact location.
- Market conditions: Rents rising (+2.2%/yr); 174 active listings in the ZIP; 40 comparable units currently listed for rent nearby; rentals at typical pace (median 25d on market — plan ~3-4 weeks tenant-placement turnaround); 11,565 units permitted in Fulton County in 2024 (8,159 in 5+ unit buildings).
- At $2,068/mo this rent would consume 52% of the median local household income ($48k/yr) (locally 1778% of renters already pay >50% of income on rent) — very limited rent-growth headroom before tenants either downsize or default.
Forward outlook
- In year one you build about $27k of equity ($2k loan paydown + $26k appreciation (10.0% local appreciation)).
- Fulton County population projected at +38% by 2050 — long-run rental-demand tailwind backs the buy-and-hold thesis.
- By year 2, paydown + projected appreciation supports a ~$44k cash-out refi (75% LTV) — recoverable capital for the next deal without selling this one.
Negotiation context
- It's been on market 17 days — a 2% lower offer ($251k) is reasonable based on typical stale-listing flexibility.
- 2 sale attempts with the ask held roughly flat each time — persistent listings suggest the price (not the market) is what's stuck; bring a comps-based counter.
Risks & watch-outs
- Climate carrying-cost: major wind risk, 27% chance of damaging wind over 30y; extreme-heat days projected 7→18/yr by 2055 (HVAC capex compounding) — expect insurance premiums to compound above CPI over the hold.
Questions for the listing agent
- What do current leases actually rent for vs. the listed asking? Can we see a recent rent roll and the last 12 months of T-12 income?
- Is there a deadline driving the sale (1031 exchange, divorce, estate, relocation)? That informs how much negotiation room exists.
- Schools are F-rated, which usually means shorter tenancies and higher turnover. Who's the typical renter profile here, and what's been the actual vacancy rate?
- Crime grade is D in this area — have there been break-ins, vandalism, or insurance claims at this property in the last 3 years? What carrier currently insures it and at what premium?
- What's the average days-on-market for RENTAL listings here right now (not sales)? A rising rental-DOM trend means longer vacancies and softer asking-rent achievability than the comps imply.
- What's the recent tenant-quality profile in this submarket — average credit score on applications, eviction rate, late-payment / NSF rate, and stable-employment percentage? A property-management company in the area should have these aggregated.
- How much new for-sale + rental construction is in the pipeline within 1–3 miles? Heavy new supply typically softens prices + rents 12–24 months out; constrained supply supports both.
Investment metrics
- 1% rule
- 0.81% ✗
- Cap rate
- 5.76%
- Cash-on-cash
- -1.89%
- DSCR
- 0.92
- GRM
- 10.3
CMA / ARV
- ARV (median comp)
- $299,826
- List price
- $255,000
- Delta
- -16.62%
- Verdict
- UNDERPRICED
- Comps
- 4 within 1.0 mi
Show comp detail 12 sales within ~0.75 mi
| Address | Dist | Beds/Ba | Sqft | Sold | Price | $/sf | Match |
|---|---|---|---|---|---|---|---|
| 4121 Ravenwood Ct | 0.35mi | 3/3.0 | 1,556 (-4%) | 4mo | $232,000 | $149 | 71 |
| 4410 Roche St | 0.43mi | 3/3.5 | 1,680 (+3%) | 6mo | $235,000 | $140 | 66 |
| 4654 Ravenwood Loop | 0.57mi | 3/2.5 | 1,711 (+5%) | 3mo | $230,000 | $134 | 62 |
| 4510 Swan Trce | 0.48mi | 3/2.5 | 1,744 (+7%) | 4mo | $200,000 | $115 | 62 |
| 4108 Robin Cir | 0.46mi | 3/2.5 | 1,786 (+10%) | 3mo | $240,000 | $134 | 60 |
| 10314 Deep Creek Cv | 0.59mi | 3/2.5 | 1,721 (+6%) | 7mo | $210,000 | $122 | 58 |
| 3426 Newgold Trce | 0.39mi | 3/2.5 | 1,832 (+12%) | 5mo | $265,000 | $145 | 57 |
| 3218 Diamond Blf | 0.48mi | 3/2.5 | 1,805 (+11%) | 4mo | $249,000 | $138 | 56 |
| 5920 Rock Rd | 0.74mi | 4/2.0 (+1) | 1,620 (-1%) | 1mo | $265,000 | $164 | 56 |
| 5953 Armour Dr | 0.74mi | 3/2.5 | 1,536 (-6%) | 5mo | $229,000 | $149 | 52 |
| 8236 Eastshore Dr | 0.55mi | 3/2.0 | 1,830 (+12%) | 12mo | $261,300 | $143 | 42 |
| 5225 Koweta Rd | 0.66mi | 3/2.0 | 1,839 (+13%) | 9mo | $170,000 | $92 | 38 |
Match score weights: distance 35% · size 25% · config 20% · recency 20%. Top-matched comps best support the ARV.
Projected returns pro-forma
10.0% appreciation · 2.2% rent growth · sell at horizon
- IRR
- 22.7%
- Equity multiple
- 2.82×
- Total profit
- $130,097
- Equity at exit
- $229,724
- IRR
- 20.1%
- Equity multiple
- 6.40×
- Total profit
- $385,538
- Equity at exit
- $495,409
Cash invested: $71,400 (down + closing). Projections, not guarantees.
Landlord ↔ Tenant lean methodology
- Overall (STATE)
- 90 Strongly Landlord-Friendly
- State Georgia
- 90 Strongly Landlord-Friendly · R+3
- County
- — inherits STATE
- City
- — inherits STATE
ZIP-level market 30291
- Home prices YoY
- 11.1%
- Rents YoY
- 2.2%
- Active inventory
- 174
- Price-to-rent
- 10.3×
Monthly cashflow live
- Estimated rent
- $2,068 high interval (Pro) →
- Mortgage (P&I)
- −$1,337
- Tax from tax record
- −$303 /mo · $3,632/yr
- Insurance
- −$106
- HOA
- −$0
- Vacancy / Maint / Mgmt
- −$434
- Net cashflow
- $-112
Break-even live
Sensitivity live
| Price | -10% $32 | -5% $-40 | +0% $-112 | +5% $-184 | +10% $-257 |
|---|---|---|---|---|---|
| Rent | -10% $-276 | -5% $-194 | +0% $-112 | +5% $-31 | +10% $51 |
| Rate | -1.0pp $16 | -0.5pp $-47 | base $-112 | +0.5pp $-178 | +1.0pp $-246 |
UW: 25.0% down · 7.5% · 30yr · 1.5% tax · 5.0% vac · 8.0% maint · 8.0% mgmt
Financing live
Cash to close
- Down payment
- $63,750
- Closing costs
- $7,650
- Reserves months
- —
- Total cash needed
- —
Loan-product check · same deal, 3 products live
Conventional
25% down · 7.5% · 30yr
- Down + closing
- —
- Monthly P&I
- —
- Monthly cashflow
- —
- DSCR
- —
- Eligible?
- —
Personal DTI + credit; lowest rate.
DSCR
20% down · 8.5% · 30yr
- Down + closing
- —
- Monthly P&I
- —
- Monthly cashflow
- —
- DSCR
- —
- Eligible?
- —
No personal income docs; deal must DSCR.
Hard money
10% down · 12.0% · 12mo
- Down + closing
- —
- Monthly P&I
- —
- Monthly cashflow
- —
- DSCR
- —
- Eligible?
- —
Short-term bridge; refi at stabilization.
Rent comps 40 comps
| Address | Beds | Baths | Sqft | Rent | $/sqft | DOM | Units | Dist |
|---|---|---|---|---|---|---|---|---|
| 4037 Ravenwood Ct Union City, GA | 2.0 | 2.5 | 1394 | $1,595 | $1.14 | 2d | 1 | 0.28mi |
| 4037 Ravenwood Ct Union City, GA | 2.0 | 2.5 | 1394 | $1,625 | $1.17 | 44d | 1 | 0.28mi |
| 4037 Ravenwood Ct Union City, GA | 2.0 | 2.5 | 1394 | $1,595 | $1.14 | 16d | 1 | 0.28mi |
| 4037 Ravenwood Ct Union City, GA | 2.0 | 2.5 | 1394 | $1,595 | $1.14 | 25d | 1 | 0.28mi |
| 4122 Ravenwood Ct Union City, GA | 3.0 | 3.0 | 1394 | $1,849 | $1.33 | 25d | 1 | 0.36mi |
| 4509 Ravenwood Pl Union City, GA | 3.0 | 2.5 | 1394 | $1,970 | $1.41 | 13d | 1 | 0.36mi |
| 4407 Roche St Atlanta, GA | 3.0 | 2.0 | 1650 | $1,875 | $1.14 | 44d | 1 | 0.44mi |
| 4223 Reeshemah St Atlanta, GA | 3.0 | 2.5 | 1843 | $1,995 | $1.08 | 6d | 1 | 0.46mi |
| 4108 Robin Cir Atlanta, GA | 3.0 | 2.5 | 1786 | $2,400 | $1.34 | 44d | 1 | 0.46mi |
| 4420 Roche St Atlanta, GA | 3.0 | 2.5 | 1622 | $2,130 | $1.31 | 44d | 1 | 0.47mi |
| 4062 Robin Cir Atlanta, GA | 3.0 | 3.0 | 1874 | $1,910 | $1.02 | 25d | 1 | 0.51mi |
| 4095 Robin Cir Atlanta, GA | 3.0 | 2.5 | 2196 | $2,023 | $0.92 | 44d | 1 | 0.51mi |
| 4056 Robin Cir Atlanta, GA | 3.0 | 2.5 | 1174 | $1,895 | $1.61 | 25d | 1 | 0.52mi |
| 4064 Robin Cir Atlanta, GA | 3.0 | 2.5 | 1874 | $1,895 | $1.01 | 25d | 1 | 0.52mi |
| 3228 Diamond Blf Union City, GA | 4.0 | 2.5 | 1922 | $2,195 | $1.14 | 44d | 1 | 0.54mi |
| 4407 Sparrow Cir Atlanta, GA | 3.0–5.0 | 2.5–3.0 | 2055 | $2,335 | $1.14 | 2d | 10 | 0.57mi |
| 3234 Diamond Blf Union City, GA | 4.0 | 2.5 | 1922 | $2,360 | $1.23 | 6d | 1 | 0.57mi |
| 4666 Ravenwood Loop Union City, GA | 4.0 | 3.0 | 1916 | $2,175 | $1.14 | 25d | 1 | 0.61mi |
| 4681 Ravenwood Loop Union City, GA | 4.0 | 2.5 | 1593 | $1,999 | $1.25 | 44d | 1 | 0.65mi |
| 3416 Stonewall Ct Atlanta, GA | 3.0 | 2.5 | 1690 | $2,450 | $1.45 | 25d | 1 | 0.73mi |
| 4497 Ravenwood Dr Union City, GA | 3.0 | 2.5 | 1694 | $2,000 | $1.18 | 44d | 1 | 0.73mi |
| 4497 Ravenwood Dr Union City, GA | 3.0 | 2.5 | 1694 | $2,000 | $1.18 | 21d | 1 | 0.73mi |
| 4812 Station Ln Atlanta, GA | 3.0 | 2.5 | 1695 | $2,100 | $1.24 | 2d | 1 | 0.87mi |
| 12076 Crosswicks Rd Union City, GA | 3.0–4.0 | 2.0–2.5 | 1617 | $2,731 | $1.69 | 2d | 6 | 0.88mi |
| 5950 Stonewall Dr Unit 2 Union City, GA | 3.0 | 1.5 | 1320 | $1,495 | $1.13 | 16d | 1 | 0.96mi |
| 5950 Stonewall Dr Unit 4 Union City, GA | 3.0 | 1.0 | 1320 | $1,445 | $1.09 | 3d | 1 | 0.96mi |
| 12006 Crosswicks Rd Unit Sunshine Union City, GA | 4.0 | 2.5 | 1821 | $2,770 | $1.52 | 4d | 1 | 0.98mi |
| 12006 Crosswicks Rd Union City, GA | 4.0 | 3.0 | 1821 | $3,468 | $1.90 | 45d | 1 | 1.03mi |
| 12006 Crosswicks Rd Union City, GA | 3.0 | 2.0 | 1413 | $2,545 | $1.80 | 16d | 1 | 1.03mi |
| 12006 Crosswicks Rd Unit 105 Union City, GA | 3.0 | 2.5 | 1413 | $2,455 | $1.74 | 44d | 1 | 1.03mi |
| 5140 Highpoint Rd Apt 27 Union City, GA | 2.0 | 2.5 | 1290 | $1,295 | $1.00 | 13d | 1 | 1.05mi |
| 5131 Forest Downs Ln Atlanta, GA | 4.0 | 2.0 | 2112 | $1,580 | $0.75 | 4d | 1 | 1.05mi |
| 6115 Forrest Ave Union City, GA | 4.0 | 2.0 | 1368 | $1,690 | $1.24 | 44d | 1 | 1.10mi |
| 5616 Union Pointe Dr Union City, GA | 2.0 | 2.5 | 1387 | $1,545 | $1.11 | 44d | 1 | 1.12mi |
| 5791 Blacktop Ct Fairburn, GA | 4.0 | 2.5 | 1991 | $2,423 | $1.22 | 44d | 1 | 1.12mi |
| 5480 Sierra Trl Atlanta, GA | 3.0 | 2.5 | 1400 | $1,845 | $1.32 | 44d | 1 | 1.15mi |
| 5458 Union Hill Ct Union City, GA | 3.0 | 2.5 | 1650 | $2,096 | $1.27 | 25d | 1 | 1.17mi |
| 5530 Union Pointe Pl Union City, GA | 3.0 | 2.0 | 1293 | $1,650 | $1.28 | 18d | 1 | 1.17mi |
| 5548 Union Pointe Pl Union City, GA | 4.0 | 2.5 | 1763 | $2,400 | $1.36 | 44d | 1 | 1.17mi |
| 4980 Stonewall Tell Rd Atlanta, GA | 3.0 | 2.0 | 1573 | $3,612 | $2.30 | 25d | 1 | 1.25mi |
Listing history 11 events
-
2026-06-21days on market $255,000 Active 17 DOM
-
2026-06-18statusdays on market $255,000 Active 14 DOM
-
2026-06-17days on market $255,000 New 13 DOM
-
2026-06-16days on market $255,000 New 12 DOM
-
2026-06-15days on market $255,000 New 11 DOM
-
2026-06-13days on market $255,000 New 9 DOM
-
2026-06-09days on market $255,000 New 5 DOM
-
2026-06-08days on market $255,000 New 4 DOM
-
2026-06-07pricestatusdays on market $255,000 New 3 DOM
-
2026-05-13historical
-
2026-03-23$250,000 New
ⓘ Source: listings_history table (triggers on properties + properties_extension) + one-shot
backfill from property_details.listing_events for pre-trigger history.
Tax reassessment forecast GA · Resets to sale price
- Current annual tax
- $3,632 · $303/mo
- Projected year-2 tax
- $3,632 · $303/mo
- Expected delta
- $0/yr ($0/mo · 0.0%)
ⓘ Screening estimate from a state-policy table — verify with the county assessor before closing.
Climate risk First Street
- Flood 1/10 Low FEMA zone X (unshaded) · 0% chance over 30 yrs
- Wildfire 3/10 Moderate
- Heat 6/10 Major 7 d/yr ≥103°F today · 18 d/yr by 30 yrs out
- Wind 6/10 Major 27% chance of damaging wind over 30 yrs
- Air quality 3/10 Moderate 3 unhealthy d/yr today · 4 by 30 yrs out
Nearby sold comps map
Loading sold comps map…
Walkable amenities ~0.75 mi
Loading nearby amenities…
Taxation est. · year 1
- Rental income
- $24,818
- − Mortgage interest
- −$14,284
- − Property taxes
- −$3,632
- − Insurance
- −$1,275
- − Repairs & maintenance
- −$1,985
- − Management
- −$1,985
- − Depreciation
- −$7,418
- Taxable loss
- −$5,762
- Est. tax savings @ 24.0%
- +$1,383
- After-tax cash flow
- $35/yr
For passive investors: Depreciation is non-cash, so a rental often shows a tax loss while cash-flowing — sheltering income. Rental losses are passive: they offset passive income freely, and up to $25,000/yr can offset ordinary (W-2) income if you actively participate and your MAGI is under $100k (phasing out to $0 by $150k); unused losses carry forward. On sale, claimed depreciation is recaptured at up to 25%, and gains may owe capital-gains tax (a 1031 exchange can defer both). Figures are a year-1 estimate at your 24.0% rate — not tax advice; consult a CPA.
Schools (NCES district)
- District
- Fulton County
- NCES district ID
- 1302280
- Math proficiency
- 49% ▼ -2.00%
- Reading proficiency
- 53% ▬ 0.00%
- Median HH income
- $68,035
- Composite
- 45.33/100
- National rank
- #2640
- State rank
- #12 of 174 in GA
Livability — Union City
- Score
- 58/100
- State rank
- #443
- US rank
- #21281
Category grades
Schools grade is shown separately in the Schools card above.
Census & demographics
- Census place
- Union City, GA
- County
- Fulton County · 1,094,430 people
- City population
- 25,130
- Metro
- Atlanta-Sandy Springs-Alpharetta, GA
- Population (ZIP)
- 25,130
- Household income
- $48,184
- Rent vs Own
- Severe rent burden
- 1778.0
Population outlook (Fulton County) Hauer SSP2
- Today (2025)
- 1,203,707 people
- By 2030
- 1,299,706 · +8.0%
- By 2040
- 1,488,256 · +23.6%
- By 2050
- 1,664,580 · +38.3%
- By 2075
- 2,036,072 · +69.2%
- By 2100
- 2,222,402 · +84.6%
Race, ethnicity, and origin ACS 2023
- Neighborhood character
- Predominantly Black (86%)
- Race & ethnicity
- Black 86% Hispanic / Latino 7% Two or more races 6% White 3%
- Hispanic origin (detail)
- Mexican 4%
- Common ancestry
- Italian 1%
- Foreign-born
- 5% · Canada
- Languages at home
- 92% English-only · Spanish 6%
Political lean MEDSL · Fulton
- 2024 margin
- Solid D (+44.9) · D 71.9% · R 27.0% · Other 1.1%
- 2008→2024 swing
- +9.8pp toward D · 2008: 35.0pp · 2024: 44.9pp
- All cycles
- 2024: D+44.9 2020: D+46.4 2016: D+42.1 2012: D+29.6 2008: D+35.0
Not yet ingested
- Civics
- —
Market trends
- HPI YoY
- ▲ 23.98%
- Current HPI
- 239.3471
- Rent YoY
- ▲ 2.20%
- Metro
- Atlanta-Sandy Springs-Alpharetta, GA
- State GDP YoY
- ▲ 2.66%
- F500 in state
- 28
Industry mix (Fortune 500 HQ in GA)
| Industry | F500 HQs | Revenue |
|---|---|---|
| Paper / Packaging | 2 | $29B |
|
||
| Retail | 1 | $160B |
|
||
| Transportation / Logistics | 1 | $91B |
|
||
| Airlines | 1 | $62B |
|
||
| Consumer Goods | 1 | $47B |
|
||
| Utilities | 1 | $25B |
|
||
Price history
+2.0% since first listed3 events — show timeline
- 2026-06-03 Listed $255,000 GAMLS
- 2026-05-13 Listing Removed — GAMLS
- 2026-03-23 Listed $250,000 GAMLS
Property tax history
+5.6%/yrLatest (2025): $3,632 · +38.9% YoY. Source: county tax records.
Cash-flow waterfall
monthlySold comps — $/sqft
last 12 mo · ≤1 miLoading sold comps…