3533 Rolling Park Rd · Edmond, OK
Flood risk No data
- FEMA flood zone
- —
- Chance of flooding over 30 yrs
- —
- Est. flood insurance / yr
- —
Fire risk No data
- Est. fire insurance / yr
- —
Heat risk No data
- Hot days now (above threshold)
- —
- Hot days in 30 yrs
- —
Wind risk No data
- Chance of severe wind over 30 yrs
- —
Air-quality risk No data
- Unhealthy air days now
- —
- Unhealthy air days in 30 yrs
- —
Risk factors via First Street. Map © Google.
Why this score? — see what drove the D- grade
The composite is a weighted blend of 9 inputs, each scored 0–100. Each bar is that input's sub-score; the figure is the points it added to the 100-point composite (weight × sub-score).
- Appreciation +10.0/10.0
- Cash flow +6.7/30.0
- ARV discount +4.6/15.0
- Livability +3.9/5.0
- Schools +3.6/10.0
- Rent growth +2.5/5.0
- Condition / age +2.5/5.0
- 1% rule +1.4/10.0
- DSCR +0.9/10.0
$585,000
🖨 Deal sheet 📄 Offer letter ✓ Due diligence
Listing remarks
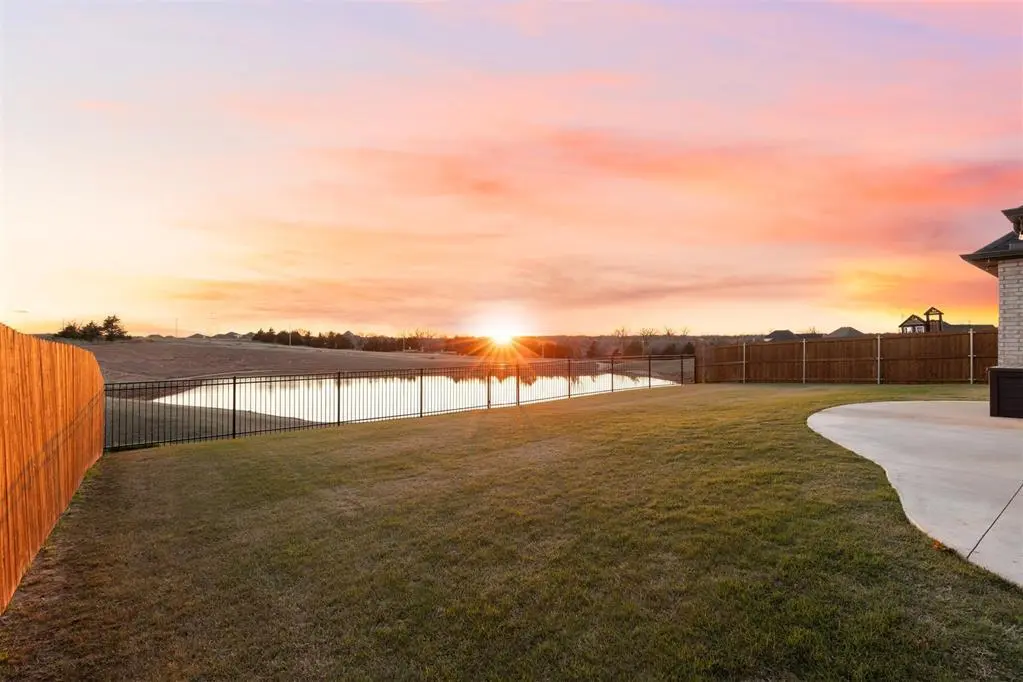
Imagine ending your day watching the sunset over the pond from your own backyard. This better-than-new 2023 home sits on a premium pond-view lot in Arcadia, just 2.5 miles from I-35, around the corner from Redbud Elementary, and minutes from the new upcoming Covell retail development offering the perfect balance of peaceful living and unbeatable convenience. The open-concept design features stained beams in the kitchen and dining, quartz countertops throughout, soft-close cabinetry, and upgraded stainless steel appliances, including a custom coffee bar with water line a perfect blend of style and function. The main floor offers 3 bedrooms, an office, and 3 full baths, while upstairs include
Key facts
- 9,100 sq ft lot
- 3 garage spots
- Community pool
Neighborhood map
What this means for you Summary
Snapshot
- This is a 5-bed/3.0-bath single-family listed at $585k.
Deal economics
- At list price, monthly cash flow is $-939 ($-11k/yr) — negative.
- To cash-flow at today's rent, offer at most $419k (28.3% below list).
- To meet the 1% rule (rent ≥ 1% of price), the offer needs to be $373k (36.2% below list).
- Recommended offer: $373k (36.2% below list) — sets the bar for 1% rule.
- Cap rate 4.4% vs local median 3.4% in Edmond — meaningfully above typical; check what's discounted (condition, days-on-market, listing class) to confirm the premium yield is real.
Location & tenants
- Location reads 78/100 on livability (#6 in OK, #2,383 nationally) — a middle-class / working-renter tenant base. Strengths: employment A+, housing A+, crime A-; Watch: health & safety C-, commute F.
- Edmond (suburban): math 38% / reading 40% proficiency, ranked #11 of 270 in OK (top 4%) — families likely to look elsewhere, expect single-tenant / working-renter base with shorter leases.
- Zoned schools: Redbud Es (616 students, 0% FRL); Memorial Hs (math 44% / reading 56%, grade D+, #4 of 447 statewide, top 1%, 2,605 students, 0% FRL) — zoned schools average 0% FRL vs 22% district-wide (22 pts lower); this property's tenant base skews higher-income than the district average.
- Market conditions: 192 active listings in the ZIP; 2 comparable units currently listed for rent nearby; 5,365 units permitted in Oklahoma County in 2024 (569 in 5+ unit buildings).
Forward outlook
- In year one you build about $63k of equity ($4k loan paydown + $58k appreciation (10.0% local appreciation)).
- Oklahoma County population projected at +41% by 2050 — long-run rental-demand tailwind backs the buy-and-hold thesis.
- By year 2, paydown + projected appreciation supports a ~$101k cash-out refi (75% LTV) — recoverable capital for the next deal without selling this one.
Negotiation context
- Only 5 days on market — expect competitive offers; lowballing is unlikely to land.
- 2 sale attempts with the ask held roughly flat each time — persistent listings suggest the price (not the market) is what's stuck; bring a comps-based counter.
Questions for the listing agent
- What do current leases actually rent for vs. the listed asking? Can we see a recent rent roll and the last 12 months of T-12 income?
- What does the HOA fee cover, when was the last increase, and are there any pending special assessments or reserve-fund shortfalls?
- Is there a deadline driving the sale (1031 exchange, divorce, estate, relocation)? That informs how much negotiation room exists.
- Schools are A-rated — typically a magnet for longer-tenancy family renters. What's the average tenant stay here, and is there a school-zone premium baked into asking?
- The area grade is low — what's the realistic commute time and amenity access for the typical tenant pool here? Any planned neighborhood developments (good or bad) we should know about?
- What's the average days-on-market for RENTAL listings here right now (not sales)? A rising rental-DOM trend means longer vacancies and softer asking-rent achievability than the comps imply.
- What's the recent tenant-quality profile in this submarket — average credit score on applications, eviction rate, late-payment / NSF rate, and stable-employment percentage? A property-management company in the area should have these aggregated.
- How much new for-sale + rental construction is in the pipeline within 1–3 miles? Heavy new supply typically softens prices + rents 12–24 months out; constrained supply supports both.
Investment metrics
- 1% rule
- 0.64% ✗
- Cap rate
- 4.37%
- Cash-on-cash
- -6.88%
- DSCR
- 0.69
- GRM
- 13.1
CMA / ARV
- ARV (on-the-fly)
- $549,900
- Comps found
- 12
Show comp detail 12 sales within ~0.75 mi
| Address | Dist | Beds/Ba | Sqft | Sold | Price | $/sf | Match |
|---|---|---|---|---|---|---|---|
| 3533 Rolling Park Rd | 0.00mi | 4/4.0 (-1) | 2,991 (+6%) | 0mo | $585,000 | $196 | 80 |
| 3432 Rolling Park Rd | 0.08mi | 5/3.0 | 2,563 (-9%) | 1mo | $510,000 | $199 | 80 |
| 8633 Beechgrove Dr | 0.09mi | 4/3.5 (-1) | 2,930 (+4%) | 4mo | $549,764 | $188 | 80 |
| 8809 Westlake Dr | 0.09mi | 4/4.0 (-1) | 2,668 (-5%) | 4mo | $499,900 | $187 | 75 |
| 3217 Mangrove Rd | 0.33mi | 5/3.0 | 2,950 (+5%) | 7mo | $534,990 | $181 | 71 |
| 8525 Maple Creek Rd | 0.21mi | 4/3.0 (-1) | 3,214 (+14%) | 2mo | $552,000 | $172 | 60 |
| 4224 Luke Ln | 0.57mi | 4/3.5 (-1) | 2,872 (+2%) | 7mo | $559,000 | $195 | 58 |
| 4109 Emery Dr | 0.75mi | 4/3.0 (-1) | 2,848 (+1%) | 2mo | $539,999 | $190 | 57 |
| 8133 Mountain Oak Dr | 0.38mi | 4/3.0 (-1) | 2,450 (-13%) | 6mo | $476,840 | $195 | 50 |
| 8901 Cherry Blossom Rd | 0.43mi | 4/3.5 (-1) | 3,206 (+14%) | 7mo | $699,999 | $218 | 44 |
| 8117 Amber Ridge Dr | 0.73mi | 4/3.5 (-1) | 3,070 (+9%) | 3mo | $643,500 | $210 | 42 |
| 8109 Amber Ridge Dr | 0.74mi | 4/3.5 (-1) | 3,109 (+10%) | 2mo | $619,000 | $199 | 40 |
Match score weights: distance 35% · size 25% · config 20% · recency 20%. Top-matched comps best support the ARV.
Projected returns pro-forma
10.0% appreciation · 3.0% rent growth · sell at horizon
- IRR
- 19.4%
- Equity multiple
- 2.58×
- Total profit
- $258,786
- Equity at exit
- $527,014
- IRR
- 17.9%
- Equity multiple
- 5.94×
- Total profit
- $809,016
- Equity at exit
- $1,136,526
Cash invested: $163,800 (down + closing). Projections, not guarantees.
Landlord ↔ Tenant lean methodology
- Overall (STATE)
- 83 Strongly Landlord-Friendly
- State Oklahoma
- 83 Strongly Landlord-Friendly · R+20
- County
- — inherits STATE
- City
- — inherits STATE
ZIP-level market 73007
- Home prices YoY
- 4.0%
- Active inventory
- 192
- Price-to-rent
- 13.1×
Monthly cashflow live
- Estimated rent
- $3,733 medium interval (Pro) →
- Mortgage (P&I)
- −$3,068
- Tax from tax record
- −$513 /mo · $6,159/yr
- Insurance
- −$244
- HOA
- −$63
- Vacancy / Maint / Mgmt
- −$784
- Net cashflow
- $-939
Break-even live
UW: 25.0% down · 7.5% · 30yr · 1.5% tax · 5.0% vac · 8.0% maint · 8.0% mgmt
Financing live
Cash to close
- Down payment
- $146,250
- Closing costs
- $17,550
- Reserves months
- —
- Total cash needed
- —
Loan-product check · same deal, 3 products live
Conventional
25% down · 7.5% · 30yr
- Down + closing
- —
- Monthly P&I
- —
- Monthly cashflow
- —
- DSCR
- —
- Eligible?
- —
Personal DTI + credit; lowest rate.
DSCR
20% down · 8.5% · 30yr
- Down + closing
- —
- Monthly P&I
- —
- Monthly cashflow
- —
- DSCR
- —
- Eligible?
- —
No personal income docs; deal must DSCR.
Hard money
10% down · 12.0% · 12mo
- Down + closing
- —
- Monthly P&I
- —
- Monthly cashflow
- —
- DSCR
- —
- Eligible?
- —
Short-term bridge; refi at stabilization.
Rent comps 2 comps
| Address | Beds | Baths | Sqft | Rent | $/sqft | DOM | Units | Dist |
|---|---|---|---|---|---|---|---|---|
| 7901 Behr Dr Edmond, OK | 5.0 | 4.0 | 2829 | $4,000 | $1.41 | 20d | 1 | 0.76mi |
| 3116 Drake Crest Dr Edmond, OK | 5.0 | 3.0 | 2950 | $3,250 | $1.10 | 1d | 1 | 1.33mi |
HOA detail
- Monthly dues
- $63 · $756/yr
- Likely covers
- water
Listing history 4 events
-
2026-04-13status Pending
-
2026-04-10status Active
-
2026-03-29status Pending
-
2026-03-26$585,000 Active
ⓘ Source: listings_history table (triggers on properties + properties_extension) + one-shot
backfill from property_details.listing_events for pre-trigger history.
Tax reassessment forecast OK · Resets to sale price
- Current annual tax
- $6,159 · $513/mo
- Projected year-2 tax
- $6,159 · $513/mo
- Expected delta
- $0/yr ($0/mo · 0.0%)
ⓘ Screening estimate from a state-policy table — verify with the county assessor before closing.
Nearby sold comps map
Loading sold comps map…
Walkable amenities ~0.75 mi
Loading nearby amenities…
Taxation est. · year 1
- Rental income
- $44,797
- − Mortgage interest
- −$32,769
- − Property taxes
- −$6,159
- − Insurance
- −$2,925
- − Repairs & maintenance
- −$3,584
- − Management
- −$3,584
- − HOA
- −$756
- − Depreciation
- −$17,018
- Taxable loss
- −$21,997
- Est. tax savings @ 24.0%
- +$5,279
- After-tax cash flow
- $-5,984/yr
For passive investors: Depreciation is non-cash, so a rental often shows a tax loss while cash-flowing — sheltering income. Rental losses are passive: they offset passive income freely, and up to $25,000/yr can offset ordinary (W-2) income if you actively participate and your MAGI is under $100k (phasing out to $0 by $150k); unused losses carry forward. On sale, claimed depreciation is recaptured at up to 25%, and gains may owe capital-gains tax (a 1031 exchange can defer both). Figures are a year-1 estimate at your 24.0% rate — not tax advice; consult a CPA.
Schools (NCES district)
- District
- Edmond
- NCES district ID
- 4010590
- Math proficiency
- 38% ▼ -12.00%
- Reading proficiency
- 40% ▼ -12.00%
- Median HH income
- $73,212
- Composite
- 35.88/100
- National rank
- #4814
- State rank
- #11 of 270 in OK
Livability — Edmond
- Score
- 78/100
- State rank
- #6
- US rank
- #2383
Category grades
Schools grade is shown separately in the Schools card above.
Census & demographics
- Census place
- Edmond, OK
- City population
- 177,083
- Population (ZIP)
- 2,945
Population outlook (Oklahoma County) Hauer SSP2
- Today (2025)
- 911,875 people
- By 2030
- 982,413 · +7.7%
- By 2040
- 1,130,468 · +24.0%
- By 2050
- 1,288,422 · +41.3%
- By 2075
- 1,711,482 · +87.7%
- By 2100
- 2,088,448 · +129.0%
Race, ethnicity, and origin ACS 2023
- Neighborhood character
- Predominantly White (80%)
- Race & ethnicity
- White 80% Two or more races 15% Hispanic / Latino 5% Black 2%
- Common ancestry
- Lithuanian 5% Romanian 3% Italian 2%
- Foreign-born
- 2% · Canada
- Languages at home
- 94% English-only · Spanish 2% Other Asian/Pacific 1%
Political lean MEDSL · Oklahoma
- 2024 margin
- Toss-up / Even · D 48.0% · R 49.7% · Other 2.3%
- 2008→2024 swing
- +15.1pp toward D · 2008: -16.8pp · 2024: -1.7pp
- All cycles
- 2024: R+1.7 2020: R+1.1 2016: R+10.5 2012: R+16.7 2008: R+16.8
Not yet ingested
- Civics
- —
Market trends
- HPI YoY
- ▲ 12.99%
- Current HPI
- 336.6015
- Rent YoY
- —
- Metro
- —
- State GDP YoY
- ▲ 1.55%
- F500 in state
- 6
Industry mix (Fortune 500 HQ in OK)
| Industry | F500 HQs | Revenue |
|---|---|---|
| Energy | 3 | $48B |
|
||
Price history
4 events — show timeline
- 2026-04-13 Pending — MLSOK
- 2026-04-10 Relisted — MLSOK
- 2026-03-29 Pending — MLSOK
- 2026-03-26 Listed $585,000 MLSOK
Property tax history
+506.0%/yrLatest (2025): $6,159 · -0.5% YoY. Source: county tax records.
Cash-flow waterfall
monthlySold comps — $/sqft
last 12 mo · ≤1 miLoading sold comps…