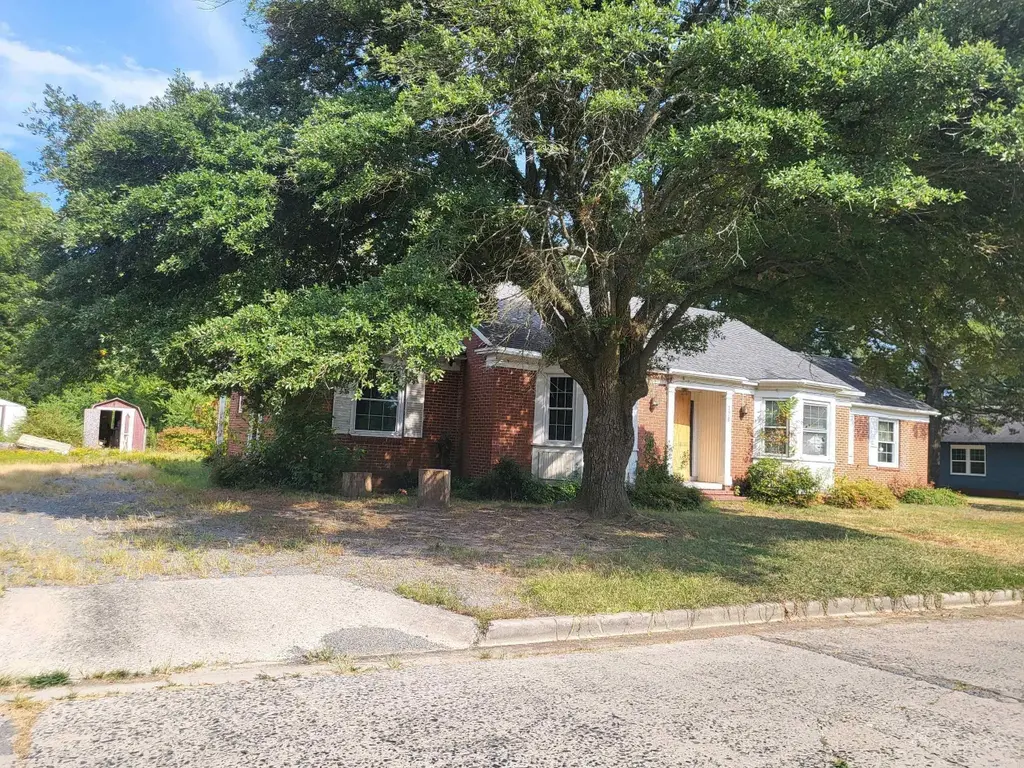
1707 S Oak St · Pine Bluff, AR
Flood risk 1/10 · Minimal
- FEMA flood zone
- X (unshaded)
- Chance of flooding over 30 yrs
- 0.0%
- Est. flood insurance / yr
- $507 – $1,088
Fire risk 1/10 · Minimal
- Est. fire insurance / yr
- $1,499 – $2,785
Heat risk 6/10 · Moderate
- Hot days now (above 111°F)
- 7 days/yr
- Hot days in 30 yrs
- 19 days/yr
Wind risk 4/10 · Minor
- Chance of severe wind over 30 yrs
- 19.0%
Air-quality risk 1/10 · Minimal
- Unhealthy air days now
- 0 days/yr
- Unhealthy air days in 30 yrs
- 0 days/yr
Risk factors via First Street. Map © Google.
Why this score? — see what drove the B grade
The composite is a weighted blend of 9 inputs, each scored 0–100. Each bar is that input's sub-score; the figure is the points it added to the 100-point composite (weight × sub-score).
- Cash flow +30.0/30.0
- ARV discount +15.0/15.0
- 1% rule +10.0/10.0
- DSCR +10.0/10.0
- Appreciation +3.2/10.0
- Rent growth +2.5/5.0
- Livability +2.5/5.0
- Condition / age +1.0/5.0
- Schools +0.6/10.0
$49,900
🖨 Deal sheet 📄 Offer letter ✓ Due diligence
Listing remarks
Back on market 2-in-1 investment special! Featuring a 3-bedroom, 2-bath main home plus an additional ~1,100 sq ft efficiency unit—offering the potential for dual rental income or house-hack strategy! Property sits on a spacious lot and is priced to sell, making it an ideal acquisition for investors seeking strong upside. Full renovation is needed, but the property offers solid structure, multiple living spaces, and significant income-producing potential once improved. Perfect for fix-and-flip, buy-and-hold, or owner-financed resale. Seller financing available, creating a rare opportunity for investors to acquire with low capital out of pocket. Property sold strictly AS-IS. No utilitie
Key facts
- Spacious lot
- Efficiency unit
- Dual rental income
Tags
Property features AI
Finance
- Financial info: Seller may consider conventional financing, owner financing, or cash
Exterior
- Parking: 2-car parking
- Utilities: Public sewer; Public water; Municipal electric (Entergy); Natural gas
- Home design: Brick exterior; Inside city limits
- Construction: Crawl space foundation; 3-tab shingle roof
- Exterior features: Guest house; Level, corner lot in a subdivision; Paved road access
Interior
- Bedrooms: Includes in-law quarters
- Flooring: Wood
- Bathrooms: 2 full bathrooms
- Heating & cooling: Central heat; Central cooling
- Interior features: Wood floors; Wood-burning site-built fireplace; Sheetrock walls and ceilings
Neighborhood map
What this means for you Summary
Snapshot
- This is a 3-bed/2.0-bath single-family listed at $50k. Condition is rated poor.
Deal economics
- At list price, monthly cash flow is $701 ($8k/yr) — positive.
- The deal already cash-flows at list — no discount required.
- Meets the 1% rule at list price ($1k rent vs $50k).
- Recommended offer: $48k (3.0% below list) — sets the bar for market timing.
- Cap rate 23.2% vs local median 9.0% in Pine Bluff — top-decile yield for the area; either an underpriced asset or a hidden risk that comps aren't pricing in. Stress-test before assuming the spread holds.
Location & tenants
- Location reads 50/100 on livability (#483 in AR) — a working-class tenant base; expect higher turnover. Strengths: cost of living A+, housing A; Watch: schools F, crime F, amenities F.
- Pine Bluff School District (urban): math 6% / reading 9% proficiency, ranked #236 of 238 in AR (top 99%) — low school quality limits family demand, transient renter base, plan for 1-2y turnover; 85% free/reduced lunch — lower-income household profile, screen leases tightly.
- Market conditions: 90 active listings in the ZIP; 62 units permitted in Jefferson County in 2024 (0 in 5+ unit buildings).
Forward outlook
- Local home prices are declining (-3.0%/yr); year-one equity from $345 of loan paydown is wiped out by about $1k of value loss. Plan a longer hold.
- Jefferson County population projected at -33% by 2050 — secular population decline; favor cash flow + early exit over multi-decade hold.
- At projected returns (-3.0% appreciation + 3.0% rent growth), your $14k cash investment doubles in ~2 years — after that, you're playing with house money.
Negotiation context
- It's been on market 56 days — a 3% lower offer ($48k) is reasonable based on typical stale-listing flexibility.
- 4 sale attempts; this cycle's ask has dropped $5k (9%) from the opening price — seller is motivated, your offer sets the floor, not the list.
Risks & watch-outs
- Watch-outs: built in 1945 — expect roof / HVAC / electrical / plumbing capex.
- Climate carrying-cost: extreme-heat days projected 7→19/yr by 2055 (HVAC capex compounding) — expect insurance premiums to compound above CPI over the hold.
Questions for the listing agent
- It's been on market 56 days. Have you received any prior offers? Is the seller open to a 3% concession, seller financing, or rate buy-down credit?
- Have any recent inspections been done? Can we get a copy of the seller's disclosures and any deferred-maintenance estimates?
- Built in 1945 — when were the roof, HVAC, electrical panel, plumbing, and water heater last replaced?
- Is there a deadline driving the sale (1031 exchange, divorce, estate, relocation)? That informs how much negotiation room exists.
- Schools are F-rated, which usually means shorter tenancies and higher turnover. Who's the typical renter profile here, and what's been the actual vacancy rate?
- Crime grade is F in this area — have there been break-ins, vandalism, or insurance claims at this property in the last 3 years? What carrier currently insures it and at what premium?
- What's the average days-on-market for RENTAL listings here right now (not sales)? A rising rental-DOM trend means longer vacancies and softer asking-rent achievability than the comps imply.
- What's the recent tenant-quality profile in this submarket — average credit score on applications, eviction rate, late-payment / NSF rate, and stable-employment percentage? A property-management company in the area should have these aggregated.
- How much new for-sale + rental construction is in the pipeline within 1–3 miles? Heavy new supply typically softens prices + rents 12–24 months out; constrained supply supports both.
Investment metrics
- 1% rule
- 2.65% ✓
- Cap rate
- 23.16%
- Cash-on-cash
- 60.24%
- DSCR
- 3.68
- GRM
- 3.1
CMA / ARV
- ARV (median comp)
- $62,455
- List price
- $49,900
- Delta
- -20.10%
- Verdict
- UNDERPRICED
- Comps
- 20 within 1.0 mi
Show comp detail 4 sales within ~0.75 mi
| Address | Dist | Beds/Ba | Sqft | Sold | Price | $/sf | Match |
|---|---|---|---|---|---|---|---|
| 1840 S Oak St | 0.13mi | 3/2.0 | 2,110 (-9%) | 3mo | $100,000 | $47 | 77 |
| 1610 S Olive St | 0.19mi | 3/1.5 | 2,354 (+2%) | 13mo | $162,500 | $69 | 76 |
| 1215 Beech | 0.33mi | 3/3.0 | 2,304 (-1%) | 9mo | $105,500 | $46 | 72 |
| 204 Linden Cir | 0.74mi | 3/2.0 | 2,186 (-6%) | 22mo | $150,000 | $69 | 38 |
Match score weights: distance 35% · size 25% · config 20% · recency 20%. Top-matched comps best support the ARV.
Projected returns pro-forma
-3.0% appreciation · 3.0% rent growth · sell at horizon
- IRR
- 59.0%
- Equity multiple
- 3.62×
- Total profit
- $36,610
- Equity at exit
- $7,440
- IRR
- 63.8%
- Equity multiple
- 7.40×
- Total profit
- $89,488
- Equity at exit
- $4,314
Cash invested: $13,972 (down + closing). Projections, not guarantees.
Landlord ↔ Tenant lean methodology
- Overall (STATE)
- 92 Strongly Landlord-Friendly
- State Arkansas
- 92 Strongly Landlord-Friendly · R+14
- County
- — inherits STATE
- City
- — inherits STATE
ZIP-level market 71601
- Home prices YoY
- -2.1%
- Active inventory
- 90
- Price-to-rent
- 3.1×
Monthly cashflow live
- Estimated rent
- $1,324 medium interval (Pro) →
- Mortgage (P&I)
- −$262
- Tax est. 1.5%
- −$62 /mo · $748/yr
- Insurance
- −$21
- HOA
- −$0
- Vacancy / Maint / Mgmt
- −$278
- Net cashflow
- $701
Break-even live
UW: 25.0% down · 7.5% · 30yr · 1.5% tax · 5.0% vac · 8.0% maint · 8.0% mgmt
Financing live
Cash to close
- Down payment
- $12,475
- Closing costs
- $1,497
- Reserves months
- —
- Total cash needed
- —
Loan-product check · same deal, 3 products live
Conventional
25% down · 7.5% · 30yr
- Down + closing
- —
- Monthly P&I
- —
- Monthly cashflow
- —
- DSCR
- —
- Eligible?
- —
Personal DTI + credit; lowest rate.
DSCR
20% down · 8.5% · 30yr
- Down + closing
- —
- Monthly P&I
- —
- Monthly cashflow
- —
- DSCR
- —
- Eligible?
- —
No personal income docs; deal must DSCR.
Hard money
10% down · 12.0% · 12mo
- Down + closing
- —
- Monthly P&I
- —
- Monthly cashflow
- —
- DSCR
- —
- Eligible?
- —
Short-term bridge; refi at stabilization.
Listing history 23 events
-
2026-06-19days on market $49,900 Active 56 DOM
-
2026-06-18days on market $49,900 Active 55 DOM
-
2026-06-17days on market $49,900 Active 54 DOM
-
2026-06-16days on market $49,900 Active 53 DOM
-
2026-06-15days on market $49,900 Active 52 DOM
-
2026-06-14days on market $49,900 Active 50 DOM
-
2026-06-12statusdays on market $49,900 Active 49 DOM
-
2026-06-09days on market $49,900 Price Change 46 DOM
-
2026-06-08days on market $49,900 Price Change 45 DOM
-
2026-06-07days on market $49,900 Price Change 44 DOM
-
2026-06-05pricestatusdays on market $49,900 Price Change 41 DOM
-
2026-06-03days on market $55,000 Back on Market 40 DOM
-
2026-06-02days on market $55,000 Back on Market 39 DOM
-
2026-06-01days on market $55,000 Back on Market 38 DOM
-
2026-05-31days on market $55,000 Back on Market 37 DOM
-
2026-05-30days on market $55,000 Back on Market 36 DOM
-
2026-04-24$55,000 New Listing 817-char remark
-
2026-04-09historical
-
2026-03-14price $55,000
-
2026-01-28price $58,500
-
2025-12-22status Back on Market
-
2025-11-20status Under Contract
-
2025-10-12$65,000 New Listing
ⓘ Source: listings_history table (triggers on properties + properties_extension) + one-shot
backfill from property_details.listing_events for pre-trigger history.
Climate risk First Street
- Flood 1/10 Low FEMA zone X (unshaded) · 0% chance over 30 yrs
- Wildfire 1/10 Low
- Heat 6/10 Major 7 d/yr ≥111°F today · 19 d/yr by 30 yrs out
- Wind 4/10 Moderate 19% chance of damaging wind over 30 yrs
- Air quality 1/10 Low 0 unhealthy d/yr today · 0 by 30 yrs out
Nearby sold comps map
Loading sold comps map…
Walkable amenities ~0.75 mi
Loading nearby amenities…
Taxation est. · year 1
- Rental income
- $15,893
- − Mortgage interest
- −$2,795
- − Property taxes
- −$748
- − Insurance
- −$250
- − Repairs & maintenance
- −$1,271
- − Management
- −$1,271
- − Depreciation
- −$1,452
- Taxable income
- $8,105
- Est. tax owed @ 24.0%
- −$1,945
- After-tax cash flow
- $6,472/yr
For passive investors: Depreciation is non-cash, so a rental often shows a tax loss while cash-flowing — sheltering income. Rental losses are passive: they offset passive income freely, and up to $25,000/yr can offset ordinary (W-2) income if you actively participate and your MAGI is under $100k (phasing out to $0 by $150k); unused losses carry forward. On sale, claimed depreciation is recaptured at up to 25%, and gains may owe capital-gains tax (a 1031 exchange can defer both). Figures are a year-1 estimate at your 24.0% rate — not tax advice; consult a CPA.
Condition & rehab AI · 12 photos
This property requires extensive renovations, including kitchen and bathroom updates, exterior and interior painting, and landscaping. It has significant potential for increasing both resale and rental value once improved.
Repairs flagged
- Major Kitchen appliances — Dirty and outdated
- Major Bathroom fixtures — Dirty and outdated
- Major Exterior siding — Worn and overgrown vegetation
- Major Flooring — Dirty and worn
- Major Paint — Dirty and peeling
Value-add opportunities
- Both Kitchen renovation — Modernizing the kitchen will increase both resale and rental value
- Both Bathroom renovation — Modernizing the bathroom will increase both resale and rental value
- Both Exterior renovation — Updating the exterior will improve curb appeal and increase both resale and rental value
- Both Painting — Fresh paint will improve the home's appearance and increase both resale and rental value
Renovation cost estimate screening
| Repair item | Severity | Est. cost |
|---|---|---|
| Kitchen appliances · Dirty and outdated | Major | $15,000–50,000 |
| Bathroom fixtures · Dirty and outdated | Major | $15,000–50,000 |
| Exterior siding · Worn and overgrown vegetation | Major | $15,000–50,000 |
| Flooring · Dirty and worn | Major | $15,000–50,000 |
| Paint · Dirty and peeling | Major | $15,000–50,000 |
| Total estimated repair cost · 5 items | $75,000–250,000 |
Value-add ROI direction
- Both Kitchen renovation — Modernizing the kitchen will increase both resale and rental value ↑
- Both Bathroom renovation — Modernizing the bathroom will increase both resale and rental value ↑
- Both Exterior renovation — Updating the exterior will improve curb appeal and increase both resale and rental value ↑
- Both Painting — Fresh paint will improve the home's appearance and increase both resale and rental value ↑
ⓘ Cost ranges are severity-bucket heuristics (US national rule-of-thumb). Get contractor quotes + a written scope before underwriting a rehab budget.
Schools (NCES district)
- District
- Pine Bluff School District
- NCES district ID
- 0500026
- Math proficiency
- 6% ▼ -9.00%
- Reading proficiency
- 9% ▼ -7.00%
- Median HH income
- $32,374
- Composite
- 5.86/100
- National rank
- #10014
- State rank
- #236 of 238 in AR
Livability — Pine Bluff
- Score
- 50/100
- State rank
- #483
- US rank
- #25645
Category grades
Schools grade is shown separately in the Schools card above.
Census & demographics
- Census place
- Pine Bluff, AR
- City population
- 29,578
- Population (ZIP)
- 13,981
Population outlook (Jefferson County) Hauer SSP2
- Today (2025)
- 63,110 people
- By 2030
- 58,519 · -7.3%
- By 2040
- 49,740 · -21.2%
- By 2050
- 42,331 · -32.9%
- By 2075
- 29,591 · -53.1%
- By 2100
- 21,047 · -66.7%
Race, ethnicity, and origin ACS 2023
- Neighborhood character
- Predominantly Black (81%)
- Race & ethnicity
- Black 81% White 13% Two or more races 4% Hispanic / Latino 2%
- Foreign-born
- 1% · Canada
- Languages at home
- 97% English-only · Spanish 2%
Political lean MEDSL · Jefferson
- 2024 margin
- Strong D (+20.1) · D 59.2% · R 39.2% · Other 1.6%
- 2008→2024 swing
- -6.2pp toward R · 2008: 26.3pp · 2024: 20.1pp
- All cycles
- 2024: D+20.1 2020: D+21.7 2016: D+25.3 2012: D+29.0 2008: D+26.3
Not yet ingested
- Civics
- —
Market trends
- HPI YoY
- ▼ -3.51%
- Current HPI
- 160.3064
- Rent YoY
- —
- Metro
- —
- State GDP YoY
- ▲ 3.80%
- F500 in state
- 10
Industry mix (Fortune 500 HQ in AR)
| Industry | F500 HQs | Revenue |
|---|---|---|
| Retail | 1 | $681B |
|
||
| Food / Agriculture | 1 | $53B |
|
||
| Retail / Energy | 1 | $22B |
|
||
| Transportation / Logistics | 1 | $12B |
|
||
| Energy | 1 | $4B |
|
||
Price history
-23.2% since first listed10 events — show timeline
- 2026-06-04 Price Changed $49,900 CARMLS
- 2026-05-29 Relisted — CARMLS
- 2026-05-26 Contingent — CARMLS
- 2026-04-24 Listed $55,000 CARMLS
- 2026-04-09 Listing Removed — CARMLS
- 2026-03-14 Price Changed $55,000 CARMLS
- 2026-01-28 Price Changed $58,500 CARMLS
- 2025-12-22 Relisted — CARMLS
- 2025-11-20 Pending — CARMLS
- 2025-10-12 Listed $65,000 CARMLS
Cash-flow waterfall
monthlySold comps — $/sqft
last 12 mo · ≤1 miLoading sold comps…