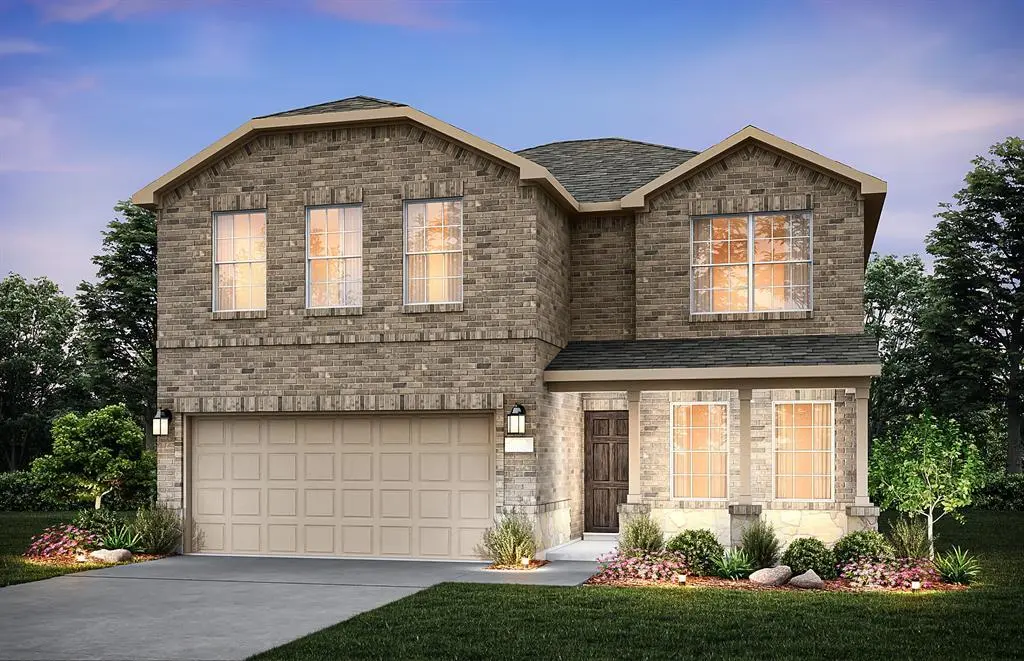
1080 Clear Dusk Ln · Forney, TX
Flood risk No data
- FEMA flood zone
- —
- Chance of flooding over 30 yrs
- —
- Est. flood insurance / yr
- —
Fire risk No data
- Est. fire insurance / yr
- —
Heat risk No data
- Hot days now (above threshold)
- —
- Hot days in 30 yrs
- —
Wind risk No data
- Chance of severe wind over 30 yrs
- —
Air-quality risk No data
- Unhealthy air days now
- —
- Unhealthy air days in 30 yrs
- —
Risk factors via First Street. Map © Google.
Why this score? — see what drove the D+ grade
The composite is a weighted blend of 9 inputs, each scored 0–100. Each bar is that input's sub-score; the figure is the points it added to the 100-point composite (weight × sub-score).
- Cash flow +17.2/30.0
- ARV discount +8.0/15.0
- DSCR +5.4/10.0
- Schools +4.0/10.0
- 1% rule +3.8/10.0
- Livability +3.8/5.0
- Rent growth +2.9/5.0
- Condition / age +2.5/5.0
- Appreciation +0.0/10.0
$329,990
🖨 Deal sheet 📄 Offer letter ✓ Due diligence
Listing remarks
NEW CONSTRUCTION: Welcome to Arbordale by Centex in Forney. The luxurious two-story Enloe plan features 5 bedrooms, 3 bathrooms, a decorative tray ceiling in the owner’s suite, an open kitchen with an island, and smart home system. With 2,520 sq. ft. , this spacious home is perfect for growing families or entertaining guests. Available May 2026! Schedule your tour today!
Key facts
- 5,663 sq ft lot
- 2 garage spots
- Built 2026
Property features AI
Finance
- Financial info: Second mortgage: none
- HOA & community: Mandatory HOA managed by Bluehawk; Quarterly HOA fee; HOA fee covers full use of facilities and maintenance of structures
Exterior
- Parking: Attached 2-car garage; Covered parking (2 covered spaces)
- Security: Carbon monoxide detector(s); Smoke detector(s)
- Utilities: MUD water; MUD sewer; Municipal Utility District
- Home design: Single family residence; Two-story; New construction (incomplete, year built 2026)
- Construction: Brick construction; Composition roof; Slab foundation
- Exterior features: Lot in a subdivision (Arbordale); Less than 0.5 acre lot
Interior
- Kitchen: Dishwasher; Disposal; Electric range; Microwave; Electric water heater
- Bedrooms: Primary bedroom on main level with dual sinks and walk-in closet; Two additional bedrooms on main level (one with walk-in closet); Three bedrooms on upper level; Five total bedrooms
- Flooring: Carpet; Luxury vinyl plank
- Bathrooms: Three full bathrooms
- Interior features: Cable TV available; Smart home system
- Laundry & utility: Smart home features (app or pass supported)
Neighborhood map
What this means for you Summary
Snapshot
- This is a 5-bed/3.0-bath land listed at $330k.
Deal economics
- At list price, monthly cash flow is $234 ($3k/yr) — positive.
- The deal already cash-flows at list — no discount required.
- To meet the 1% rule (rent ≥ 1% of price), the offer needs to be $290k (12.2% below list).
- Recommended offer: $290k (12.2% below list) — sets the bar for 1% rule.
- Cap rate 7.1% vs local median 4.1% in Forney — top-decile yield for the area; either an underpriced asset or a hidden risk that comps aren't pricing in. Stress-test before assuming the spread holds.
Location & tenants
- Location reads 76/100 on livability (#98 in TX, #3,339 nationally) — a middle-class / working-renter tenant base. Strengths: crime A+, employment A+, cost of living A+; Watch: amenities C-, commute F.
- Forney ISD (rural): math 41% / reading 44% proficiency, ranked #234 of 826 in TX (top 28%) — families likely to look elsewhere, expect single-tenant / working-renter base with shorter leases.
- Market conditions: Rents rising (+1.4%/yr); 2179 active listings in the ZIP; 40 comparable units currently listed for rent nearby; rentals at typical pace (median 19d on market — plan ~3-4 weeks tenant-placement turnaround); solid renter incomes; 1,747 units permitted in Kaufman County in 2024 (180 in 5+ unit buildings).
- This rent runs 34% of the median local income ($104k/yr) — at the standard rent-burdened threshold; future hikes will face affordability resistance.
Forward outlook
- Local home prices are declining (-3.0%/yr); year-one equity from $2k of loan paydown is wiped out by about $10k of value loss. Plan a longer hold.
- Kaufman County population projected at +43% by 2050 — long-run rental-demand tailwind backs the buy-and-hold thesis.
Negotiation context
- It's been on market 29 days — a 2% lower offer ($325k) is reasonable based on typical stale-listing flexibility.
Questions for the listing agent
- What does the HOA fee cover, when was the last increase, and are there any pending special assessments or reserve-fund shortfalls?
- Is there a deadline driving the sale (1031 exchange, divorce, estate, relocation)? That informs how much negotiation room exists.
- Schools are B-rated — typically a magnet for longer-tenancy family renters. What's the average tenant stay here, and is there a school-zone premium baked into asking?
- The area grade is low — what's the realistic commute time and amenity access for the typical tenant pool here? Any planned neighborhood developments (good or bad) we should know about?
- What's the average days-on-market for RENTAL listings here right now (not sales)? A rising rental-DOM trend means longer vacancies and softer asking-rent achievability than the comps imply.
- What's the recent tenant-quality profile in this submarket — average credit score on applications, eviction rate, late-payment / NSF rate, and stable-employment percentage? A property-management company in the area should have these aggregated.
- How much new for-sale + rental construction is in the pipeline within 1–3 miles? Heavy new supply typically softens prices + rents 12–24 months out; constrained supply supports both.
Investment metrics
- 1% rule
- 0.88% ✗
- Cap rate
- 7.14%
- Cash-on-cash
- 3.04%
- DSCR
- 1.14
- GRM
- 9.5
CMA / ARV
- ARV (median comp)
- $333,682
- List price
- $329,990
- Delta
- -1.11%
- Verdict
- FAIR
- Comps
- 20 within 1.0 mi
Projected returns pro-forma
-3.0% appreciation · 1.42% rent growth · sell at horizon
- IRR
- -13.2%
- Equity multiple
- 0.53×
- Total profit
- $-43,186
- Equity at exit
- $49,203
- IRR
- -6.7%
- Equity multiple
- 0.60×
- Total profit
- $-36,814
- Equity at exit
- $28,532
Cash invested: $92,397 (down + closing). Projections, not guarantees.
Landlord ↔ Tenant lean methodology
- Overall (STATE)
- 87 Strongly Landlord-Friendly
- State Texas
- 87 Strongly Landlord-Friendly · R+5
- County
- — inherits STATE
- City
- — inherits STATE
ZIP-level market 75126
- Rents YoY
- 1.4%
- Active inventory
- 2179
- Price-to-rent
- 9.5×
Monthly cashflow live
- Estimated rent
- $2,898 high interval (Pro) →
- Mortgage (P&I)
- −$1,731
- Tax from tax record
- −$138 /mo · $1,651/yr
- Insurance
- −$137
- HOA
- −$50
- Vacancy / Maint / Mgmt
- −$609
- Net cashflow
- $234
Break-even live
UW: 25.0% down · 7.5% · 30yr · 1.5% tax · 5.0% vac · 8.0% maint · 8.0% mgmt
Financing live
Cash to close
- Down payment
- $82,498
- Closing costs
- $9,900
- Reserves months
- —
- Total cash needed
- —
Loan-product check · same deal, 3 products live
Conventional
25% down · 7.5% · 30yr
- Down + closing
- —
- Monthly P&I
- —
- Monthly cashflow
- —
- DSCR
- —
- Eligible?
- —
Personal DTI + credit; lowest rate.
DSCR
20% down · 8.5% · 30yr
- Down + closing
- —
- Monthly P&I
- —
- Monthly cashflow
- —
- DSCR
- —
- Eligible?
- —
No personal income docs; deal must DSCR.
Hard money
10% down · 12.0% · 12mo
- Down + closing
- —
- Monthly P&I
- —
- Monthly cashflow
- —
- DSCR
- —
- Eligible?
- —
Short-term bridge; refi at stabilization.
Rent comps 40 comps
| Address | Beds | Baths | Sqft | Rent | $/sqft | DOM | Units | Dist |
|---|---|---|---|---|---|---|---|---|
| 1229 Autumn Mist Ln Forney, TX | 4.0 | 3.0 | 2609 | $2,795 | $1.07 | 4d | 1 | 0.16mi |
| 1129 Clear Dusk Ln Forney, TX | 5.0 | 3.0 | 2520 | $3,600 | $1.43 | 44d | 1 | 0.17mi |
| 4424 Lassen Trl Forney, TX | 4.0 | 2.0 | 1984 | $2,295 | $1.16 | 44d | 1 | 0.34mi |
| 1535 Calcot Ln Forney, TX | 4.0 | 3.0 | 2036 | $2,600 | $1.28 | 15d | 1 | 0.36mi |
| 1539 Wheatley Way Forney, TX | 4.0 | 3.0 | 2396 | $2,800 | $1.17 | 10d | 1 | 0.37mi |
| 1539 Wheatley Way Forney, TX | 4.0 | 3.0 | 2396 | $2,995 | $1.25 | 17d | 1 | 0.37mi |
| 4080 Dayton Dr Forney, TX | 4.0 | 2.5 | 1984 | $2,295 | $1.16 | 19d | 1 | 0.56mi |
| 1158 Barbary Fields St Forney, TX | 4.0 | 2.0 | 1780 | $2,300 | $1.29 | 44d | 1 | 0.59mi |
| 1120 Canterbury Ln Forney, TX | 4.0 | 3.0 | 2450 | $2,950 | $1.20 | 13d | 1 | 0.77mi |
| 2003 Cheshire Way Forney, TX | 5.0 | 4.0 | 3430 | $3,600 | $1.05 | 13d | 1 | 0.85mi |
| 1128 Queensdown Way Forney, TX | 4.0 | 3.0 | 2097 | $2,999 | $1.43 | 44d | 1 | 0.85mi |
| 1633 Briar Hunt Dr Forney, TX | 5.0 | 2.5 | 2470 | $2,500 | $1.01 | 21d | 1 | 0.86mi |
| 1636 Briar Hunt Dr Forney, TX | 4.0 | 2.5 | 2000 | $2,250 | $1.12 | 44d | 1 | 0.87mi |
| 1718 Cecil Crest Ln Forney, TX | 4.0 | 2.5 | 2147 | $2,395 | $1.12 | 44d | 1 | 0.90mi |
| 1448 Kingswell Ln Forney, TX | 4.0 | 3.0 | 2208 | $2,950 | $1.34 | 24d | 1 | 0.96mi |
| 1025 Dunhill Ln Forney, TX | 4.0 | 2.0 | 2273 | $2,450 | $1.08 | 2d | 1 | 1.05mi |
| 2287 Cliff Springs Dr Forney, TX | 4.0 | 2.0 | 2000 | $2,195 | $1.10 | 44d | 1 | 1.07mi |
| 2309 Albion Way Forney, TX | 5.0 | 4.5 | 3582 | $3,850 | $1.07 | 1d | 1 | 1.08mi |
| 5734 Roadhouse Forney, TX | 4.0 | 2.5 | 2121 | $2,350 | $1.11 | 1d | 1 | 1.11mi |
| 6231 Old Bridge Way Forney, TX | 4.0 | 3.0 | 2308 | $2,300 | $1.00 | 1d | 1 | 1.12mi |
| 1462 Everett Gardens Way Forney, TX | 4.0 | 2.0 | 1858 | $2,195 | $1.18 | 24d | 1 | 1.12mi |
| 1462 Everett Gardens Way Forney, TX | 4.0 | 2.0 | 1858 | $2,195 | $1.18 | 2d | 1 | 1.12mi |
| 6229 Old Bridge Way Forney, TX | 4.0 | 2.5 | 2121 | $1,950 | $0.92 | 13d | 1 | 1.12mi |
| 6075 Mojave Dr Forney, TX | 5.0 | 3.0 | 2777 | $2,595 | $0.93 | 15d | 1 | 1.15mi |
| 6076 Mojave Dr Forney, TX | 5.0 | 4.0 | 2962 | $2,900 | $0.98 | 44d | 1 | 1.17mi |
| 6076 Mojave Dr Forney, TX | 5.0 | 4.0 | 2962 | $2,595 | $0.88 | 3d | 1 | 1.17mi |
| 2029 Dovedale Dr Forney, TX | 4.0 | 3.0 | 2426 | $3,200 | $1.32 | 44d | 1 | 1.18mi |
| 6310 Tropicana Ln Forney, TX | 5.0 | 3.0 | 2580 | $2,685 | $1.04 | 1d | 1 | 1.22mi |
| 3109 Chillingham Dr Forney, TX | 4.0 | 2.5 | 2181 | $2,199 | $1.01 | 3d | 1 | 1.26mi |
| 3024 Chico Dr Forney, TX | 5.0 | 2.5 | 2694 | $2,350 | $0.87 | 13d | 1 | 1.28mi |
| 2116 Sunnymede Dr Forney, TX | 5.0 | 3.0 | 2854 | $3,300 | $1.16 | 21d | 1 | 1.30mi |
| 2027 Fair Crest Trl Forney, TX | 4.0 | 2.0 | 2108 | $1,975 | $0.94 | 44d | 1 | 1.31mi |
| 2214 Sumac Dr Forney, TX | 4.0 | 2.5 | 2055 | $2,070 | $1.01 | 44d | 1 | 1.38mi |
| 2136 Sunnymede Dr Forney, TX | 4.0 | 4.0 | 2805 | $3,200 | $1.14 | 1d | 1 | 1.39mi |
| 3017 Villegas Way Forney, TX | 4.0 | 2.5 | 2153 | $2,150 | $1.00 | 44d | 1 | 1.40mi |
| 3012 Villegas Way Forney, TX | 5.0 | 2.5 | 2725 | $2,400 | $0.88 | 2d | 1 | 1.40mi |
| 1421 Kirkhill Ln Unit 1421 Heath, TX | 4.0 | 3.0 | 2545 | $3,500 | $1.38 | 21d | 1 | 1.40mi |
| 1421 Kirkhill Ln Forney, TX | 4.0 | 3.0 | 2545 | $3,600 | $1.41 | 24d | 1 | 1.40mi |
| 2100 Aster Trl Forney, TX | 4.0 | 2.0 | 2284 | $2,190 | $0.96 | 4d | 1 | 1.47mi |
| 9245 Switchgrass Ln Forney, TX | 4.0 | 2.5 | 3326 | $2,700 | $0.81 | 44d | 1 | 1.48mi |
HOA detail
- Monthly dues
- $50 · $600/yr
Listing history 6 events
-
2026-05-14price $329,990 247-char remark
-
2026-05-12price $329,990 378-char remark
-
2026-05-08price $334,990 378-char remark
-
2026-05-07price $334,990 247-char remark
-
2026-05-01$343,440 Active 247-char remark
-
2026-04-28$343,440 Active 378-char remark
ⓘ Source: listings_history table (triggers on properties + properties_extension) + one-shot
backfill from property_details.listing_events for pre-trigger history.
Tax reassessment forecast TX · Resets to sale price
- Current annual tax
- $1,651 · $138/mo
- Projected year-2 tax
- $6,039 · $503/mo
- Expected delta
- +$4,388/yr (+$366/mo · 265.8%)
ⓘ Screening estimate from a state-policy table — verify with the county assessor before closing.
Nearby sold comps map
Loading sold comps map…
Walkable amenities ~0.75 mi
Loading nearby amenities…
Taxation est. · year 1
- Rental income
- $34,782
- − Mortgage interest
- −$18,485
- − Property taxes
- −$1,651
- − Insurance
- −$1,650
- − Repairs & maintenance
- −$2,783
- − Management
- −$2,783
- − HOA
- −$600
- − Depreciation
- −$9,600
- Taxable loss
- −$2,769
- Est. tax savings @ 24.0%
- +$664
- After-tax cash flow
- $3,475/yr
For passive investors: Depreciation is non-cash, so a rental often shows a tax loss while cash-flowing — sheltering income. Rental losses are passive: they offset passive income freely, and up to $25,000/yr can offset ordinary (W-2) income if you actively participate and your MAGI is under $100k (phasing out to $0 by $150k); unused losses carry forward. On sale, claimed depreciation is recaptured at up to 25%, and gains may owe capital-gains tax (a 1031 exchange can defer both). Figures are a year-1 estimate at your 24.0% rate — not tax advice; consult a CPA.
Schools (NCES district)
- District
- Forney ISD
- NCES district ID
- 4819560
- Math proficiency
- 41% ▼ -20.00%
- Reading proficiency
- 44% ▼ -12.00%
- Median HH income
- $86,679
- Composite
- 40.07/100
- National rank
- #3812
- State rank
- #234 of 826 in TX
Livability — Forney
- Score
- 76/100
- State rank
- #98
- US rank
- #3339
Category grades
Schools grade is shown separately in the Schools card above.
Census & demographics
- County
- Kaufman County · 122,338 people
- City population
- 84,799
- Metro
- Dallas-Fort Worth-Arlington, TX
- Population (ZIP)
- 84,799
- Household income
- $103,673
- Rent vs Own
- Severe rent burden
- 1306.0
Population outlook (Kaufman County) Hauer SSP2
- Today (2025)
- 138,716 people
- By 2030
- 150,815 · +8.7%
- By 2040
- 174,877 · +26.1%
- By 2050
- 198,020 · +42.8%
- By 2075
- 251,908 · +81.6%
- By 2100
- 285,325 · +105.7%
Race, ethnicity, and origin ACS 2023
- Neighborhood character
- Diverse neighborhood (Simpson 0.68)
- Race & ethnicity
- White 45% Black 25% Hispanic / Latino 23% Two or more races 14% Asian 3%
- Hispanic origin (detail)
- Mexican 18% Puerto Rican 1%
- Common ancestry
- Italian 2% Slovak 1% Portuguese 1%
- Foreign-born
- 12% · Canada, Vietnam
- Languages at home
- 79% English-only · Spanish 14% Arabic 1% Vietnamese 1%
Political lean MEDSL · Kaufman
- 2024 margin
- Strong R (+27.9) · D 35.6% · R 63.5%
- 2008→2024 swing
- +7.9pp toward D · 2008: -35.8pp · 2024: -27.9pp
- All cycles
- 2024: R+27.9 2020: R+33.9 2016: R+47.0 2012: R+44.4 2008: R+35.8
Not yet ingested
- Civics
- —
Market trends
- HPI YoY
- ▼ -102.93%
- Current HPI
- 148.5749
- Rent YoY
- ▲ 1.42%
- Metro
- Dallas-Fort Worth-Arlington, TX
- State GDP YoY
- ▲ 3.95%
- F500 in state
- 110
Industry mix (Fortune 500 HQ in TX)
| Industry | F500 HQs | Revenue |
|---|---|---|
| Energy | 16 | $1,198B |
|
||
| Technology | 5 | $198B |
|
||
| Engineering / Construction | 4 | $72B |
|
||
| Energy Services | 3 | $60B |
|
||
| Utilities | 3 | $41B |
|
||
| Healthcare | 2 | $330B |
|
||
Price history
-3.9% since first listed4 events — show timeline
- 2026-05-27 Pending — NTREIS
- 2026-05-12 Price Changed $329,990 NTREIS
- 2026-05-08 Price Changed $334,990 NTREIS
- 2026-04-28 Listed $343,440 NTREIS
Cash-flow waterfall
monthlySold comps — $/sqft
last 12 mo · ≤1 miLoading sold comps…