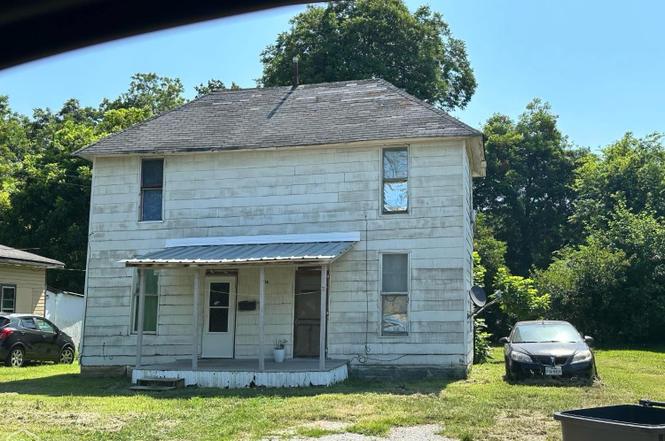
214 Miller St · Jonesboro, AR
Flood risk 1/10 · Minimal
- FEMA flood zone
- X
- Chance of flooding over 30 yrs
- 0.0%
- Est. flood insurance / yr
- $507 – $1,088
Fire risk 3/10 · Minor
- Est. fire insurance / yr
- $1,499 – $2,785
Heat risk 5/10 · Moderate
- Hot days now (above 109°F)
- 7 days/yr
- Hot days in 30 yrs
- 20 days/yr
Wind risk 3/10 · Minor
- Chance of severe wind over 30 yrs
- 7.0%
Air-quality risk 1/10 · Minimal
- Unhealthy air days now
- 0 days/yr
- Unhealthy air days in 30 yrs
- 0 days/yr
Risk factors via First Street. Map © Google.
Why this score? — see what drove the B- grade
The composite is a weighted blend of 9 inputs, each scored 0–100. Each bar is that input's sub-score; the figure is the points it added to the 100-point composite (weight × sub-score).
- Cash flow +30.0/30.0
- 1% rule +10.0/10.0
- DSCR +10.0/10.0
- ARV discount +7.5/15.0
- Rent growth +3.4/5.0
- Livability +3.2/5.0
- Condition / age +2.5/5.0
- Schools +2.3/10.0
- Appreciation +0.0/10.0
$66,000
🖨 Deal sheet 📄 Offer letter ✓ Due diligence
Listing remarks
This property is to be sold as package deal along with following additional single family properties located in Jonesboro, AR: 1007 Warren St, 1110 Warren St, 1206 Warren St, 207 Miller St, 214 Miller St, and 220 E Center. Total Package price is to be $350,500. The owner wants to sell this property as a package deal with 5 other single family homes located in Jonesboro that are listed in the MLS. Appointments for showing will be scheduled once proof of funds or pre approval is provided. Rent Roll is available upon request. 48 hour notice for showing.
Key facts
- 7,000 sq ft lot
- Listed 142 days
Property features AI
Exterior
- Utilities: Public water; Public sewer
- Home design: Single Family Residence; Residential property; 2 stories
- Exterior features: Lot in the Matthews subdivision
Interior
- Bathrooms: 1 full bathroom
- Interior features: Refrigerator
Neighborhood map
What this means for you Summary
Snapshot
- This is a 4-bed/1.0-bath single-family listed at $66k.
Deal economics
- At list price, monthly cash flow is $818 ($10k/yr) — positive.
- The deal already cash-flows at list — no discount required.
- Meets the 1% rule at list price ($2k rent vs $66k).
- Recommended offer: $58k (12.0% below list) — sets the bar for market timing.
- Cap rate 21.2% vs local median 4.4% in Jonesboro — top-decile yield for the area; either an underpriced asset or a hidden risk that comps aren't pricing in. Stress-test before assuming the spread holds.
Location & tenants
- Location reads 65/100 on livability (#145 in AR) — a middle-class / working-renter tenant base. Strengths: cost of living A+, housing A+, health & safety A+; Watch: crime F, amenities F, commute F.
- Jonesboro School District (urban): math 28% / reading 28% proficiency, ranked #169 of 238 in AR (top 71%) — low school quality limits family demand, transient renter base, plan for 1-2y turnover; 67% free/reduced lunch — lower-income household profile, screen leases tightly.
- Zoned schools: Douglas Macarthur Jhs (math 25% / reading 27%, grade F, #159 of 201 statewide, top 80%, 732 students, 100% FRL); The Academies At Jonesboro High School (math 16% / reading 27%, grade F, #225 of 292 statewide, top 78%, 1,386 students, 100% FRL) — zoned schools average 100% FRL vs 67% district-wide (33 pts higher); higher-poverty schools than district average — tighter screening recommended.
- Market conditions: Rents rising (+3.6%/yr); 295 active listings in the ZIP; 926 units permitted in Craighead County in 2024 (69 in 5+ unit buildings).
- This rent runs 41% of the median local income ($45k/yr) — at the standard rent-burdened threshold; future hikes will face affordability resistance.
Forward outlook
- Local home prices are declining (-3.0%/yr); year-one equity from $456 of loan paydown is wiped out by about $2k of value loss. Plan a longer hold.
- Craighead County population projected at +38% by 2050 — long-run rental-demand tailwind backs the buy-and-hold thesis.
- At projected returns (-3.0% appreciation + 3.6% rent growth), your $18k cash investment doubles in ~3 years — after that, you're playing with house money.
Negotiation context
- It's been on market 143 days — a 12% lower offer ($58k) is reasonable based on typical stale-listing flexibility.
- 3 sale attempts since 2y ago; this cycle's ask has dropped $15k (19%) from the opening price — seller is motivated, your offer sets the floor, not the list.
Risks & watch-outs
- Climate carrying-cost: extreme-heat days projected 7→20/yr by 2055 (HVAC capex compounding) — expect insurance premiums to compound above CPI over the hold.
Questions for the listing agent
- It's been on market 143 days. Have you received any prior offers? Is the seller open to a 12% concession, seller financing, or rate buy-down credit?
- Why hasn't it sold? Are there any deal-killer items the seller is aware of (foundation, flood, title, zoning, code violations)?
- Is there a deadline driving the sale (1031 exchange, divorce, estate, relocation)? That informs how much negotiation room exists.
- Schools are D-rated, which usually means shorter tenancies and higher turnover. Who's the typical renter profile here, and what's been the actual vacancy rate?
- Crime grade is F in this area — have there been break-ins, vandalism, or insurance claims at this property in the last 3 years? What carrier currently insures it and at what premium?
- What's the average days-on-market for RENTAL listings here right now (not sales)? A rising rental-DOM trend means longer vacancies and softer asking-rent achievability than the comps imply.
- What's the recent tenant-quality profile in this submarket — average credit score on applications, eviction rate, late-payment / NSF rate, and stable-employment percentage? A property-management company in the area should have these aggregated.
- How much new for-sale + rental construction is in the pipeline within 1–3 miles? Heavy new supply typically softens prices + rents 12–24 months out; constrained supply supports both.
Investment metrics
- 1% rule
- 2.32% ✓
- Cap rate
- 21.17%
- Cash-on-cash
- 53.13%
- DSCR
- 3.36
- GRM
- 3.6
CMA / ARV
- ARV (on-the-fly)
- $165,432
- Comps found
- 6
Show comp detail 6 sales within ~0.75 mi
| Address | Dist | Beds/Ba | Sqft | Sold | Price | $/sf | Match |
|---|---|---|---|---|---|---|---|
| 916 Creath | 0.45mi | 3/2.0 (-1) | 1,505 (+3%) | 9mo | $169,900 | $113 | 58 |
| 331 N Fisher St St | 0.22mi | 4/2.0 | 1,380 (-6%) | 22mo | $30,000 | $22 | 58 |
| 616 Creath | 0.35mi | 3/2.0 (-1) | 1,302 (-11%) | 9mo | $169,900 | $130 | 49 |
| 615 Krewson | 0.68mi | 4/2.0 | 1,380 (-6%) | 23mo | $85,000 | $62 | 36 |
| 1216 N Church | 0.71mi | 3/1.0 (-1) | 1,268 (-13%) | 10mo | $23,000 | $18 | 31 |
| 417 W Forrest St | 0.65mi | 3/2.0 (-1) | 1,680 (+15%) | 11mo | $195,000 | $116 | 27 |
Match score weights: distance 35% · size 25% · config 20% · recency 20%. Top-matched comps best support the ARV.
Projected returns pro-forma
-3.0% appreciation · 3.64% rent growth · sell at horizon
- IRR
- 51.9%
- Equity multiple
- 3.29×
- Total profit
- $42,394
- Equity at exit
- $9,841
- IRR
- 57.4%
- Equity multiple
- 6.85×
- Total profit
- $108,083
- Equity at exit
- $5,706
Cash invested: $18,480 (down + closing). Projections, not guarantees.
Landlord ↔ Tenant lean methodology
- Overall (STATE)
- 92 Strongly Landlord-Friendly
- State Arkansas
- 92 Strongly Landlord-Friendly · R+14
- County
- — inherits STATE
- City
- — inherits STATE
ZIP-level market 72401
- Home prices YoY
- -34.2%
- Rents YoY
- 3.6%
- Active inventory
- 295
- Price-to-rent
- 3.6×
Monthly cashflow live
- Estimated rent
- $1,533 medium interval (Pro) →
- Mortgage (P&I)
- −$346
- Tax from tax record
- −$19 /mo · $231/yr
- Insurance
- −$28
- HOA
- −$0
- Vacancy / Maint / Mgmt
- −$322
- Net cashflow
- $818
Break-even live
UW: 25.0% down · 7.5% · 30yr · 1.5% tax · 5.0% vac · 8.0% maint · 8.0% mgmt
Financing live
Cash to close
- Down payment
- $16,500
- Closing costs
- $1,980
- Reserves months
- —
- Total cash needed
- —
Loan-product check · same deal, 3 products live
Conventional
25% down · 7.5% · 30yr
- Down + closing
- —
- Monthly P&I
- —
- Monthly cashflow
- —
- DSCR
- —
- Eligible?
- —
Personal DTI + credit; lowest rate.
DSCR
20% down · 8.5% · 30yr
- Down + closing
- —
- Monthly P&I
- —
- Monthly cashflow
- —
- DSCR
- —
- Eligible?
- —
No personal income docs; deal must DSCR.
Hard money
10% down · 12.0% · 12mo
- Down + closing
- —
- Monthly P&I
- —
- Monthly cashflow
- —
- DSCR
- —
- Eligible?
- —
Short-term bridge; refi at stabilization.
Listing history 23 events
-
2026-06-19days on market $66,000 Active 143 DOM
-
2026-06-18days on market $66,000 Active 142 DOM
-
2026-06-17days on market $66,000 Active 141 DOM
-
2026-06-16days on market $66,000 Active 140 DOM
-
2026-06-15days on market $66,000 Active 139 DOM
-
2026-06-14days on market $66,000 Active 137 DOM
-
2026-06-13days on market $66,000 Active 136 DOM
-
2026-06-10days on market $66,000 Active 134 DOM
-
2026-06-09days on market $66,000 Active 133 DOM
-
2026-06-08days on market $66,000 Active 132 DOM
-
2026-06-07days on market $66,000 Active 131 DOM
-
2026-06-05days on market $66,000 Active 128 DOM
-
2026-06-02days on market $66,000 Active 126 DOM
-
2026-06-01days on market $66,000 Active 125 DOM
-
2026-05-31days on market $66,000 Active 124 DOM
-
2026-05-30days on market $66,000 Active 123 DOM
-
2026-05-05price $66,000
-
2026-01-27$81,000 Active
-
2025-06-19price $78,000
-
2024-10-20$80,000 Active
-
2024-10-18price $80,000
-
2024-09-24price $85,000
-
2024-07-22$93,000 Active
ⓘ Source: listings_history table (triggers on properties + properties_extension) + one-shot
backfill from property_details.listing_events for pre-trigger history.
Tax reassessment forecast AR · Resets to sale price
- Current annual tax
- $231 · $19/mo
- Projected year-2 tax
- $422 · $35/mo
- Expected delta
- +$191/yr (+$16/mo · 82.6%)
ⓘ Screening estimate from a state-policy table — verify with the county assessor before closing.
Climate risk First Street
- Flood 1/10 Low FEMA zone X · 0% chance over 30 yrs
- Wildfire 3/10 Moderate
- Heat 5/10 Major 7 d/yr ≥109°F today · 20 d/yr by 30 yrs out
- Wind 3/10 Moderate 7% chance of damaging wind over 30 yrs
- Air quality 1/10 Low 0 unhealthy d/yr today · 0 by 30 yrs out
Nearby sold comps map
Loading sold comps map…
Walkable amenities ~0.75 mi
Loading nearby amenities…
Taxation est. · year 1
- Rental income
- $18,396
- − Mortgage interest
- −$3,697
- − Property taxes
- −$231
- − Insurance
- −$330
- − Repairs & maintenance
- −$1,472
- − Management
- −$1,472
- − Depreciation
- −$1,920
- Taxable income
- $9,274
- Est. tax owed @ 24.0%
- −$2,226
- After-tax cash flow
- $7,592/yr
For passive investors: Depreciation is non-cash, so a rental often shows a tax loss while cash-flowing — sheltering income. Rental losses are passive: they offset passive income freely, and up to $25,000/yr can offset ordinary (W-2) income if you actively participate and your MAGI is under $100k (phasing out to $0 by $150k); unused losses carry forward. On sale, claimed depreciation is recaptured at up to 25%, and gains may owe capital-gains tax (a 1031 exchange can defer both). Figures are a year-1 estimate at your 24.0% rate — not tax advice; consult a CPA.
Schools (NCES district)
- District
- Jonesboro School District
- NCES district ID
- 0508280
- Math proficiency
- 28% ▼ -9.00%
- Reading proficiency
- 28% ▼ -8.00%
- Median HH income
- $34,347
- Composite
- 23.06/100
- National rank
- #7967
- State rank
- #169 of 238 in AR
Livability — Jonesboro
- Score
- 65/100
- State rank
- #145
- US rank
- #12692
Category grades
Schools grade is shown separately in the Schools card above.
Census & demographics
- Census place
- Jonesboro, AR
- County
- Craighead County · 97,185 people
- City population
- 91,245
- Metro
- Jonesboro, AR
- Population (ZIP)
- 42,602
- Household income
- $45,329
- Rent vs Own
- Severe rent burden
- 2606.0
Population outlook (Craighead County) Hauer SSP2
- Today (2025)
- 122,235 people
- By 2030
- 131,338 · +7.4%
- By 2040
- 149,862 · +22.6%
- By 2050
- 168,034 · +37.5%
- By 2075
- 208,094 · +70.2%
- By 2100
- 233,251 · +90.8%
Race, ethnicity, and origin ACS 2023
- Neighborhood character
- Diverse neighborhood (Simpson 0.56)
- Race & ethnicity
- White 60% Black 26% Hispanic / Latino 9% Two or more races 7%
- Hispanic origin (detail)
- Mexican 8%
- Common ancestry
- Slovak 2% Italian 1% Lithuanian 1%
- Foreign-born
- 4% · Canada
- Languages at home
- 92% English-only · Spanish 7%
Political lean MEDSL · Craighead
- 2024 margin
- Solid R (+37.4) · D 30.1% · R 67.5% · Other 2.4%
- 2008→2024 swing
- -12.9pp toward R · 2008: -24.5pp · 2024: -37.4pp
- All cycles
- 2024: R+37.4 2020: R+35.4 2016: R+35.2 2012: R+31.1 2008: R+24.5
Not yet ingested
- Civics
- —
Market trends
- HPI YoY
- ▼ -108.25%
- Current HPI
- 208.2079
- Rent YoY
- ▲ 3.64%
- Metro
- Jonesboro, AR
- State GDP YoY
- ▲ 3.80%
- F500 in state
- 10
Industry mix (Fortune 500 HQ in AR)
| Industry | F500 HQs | Revenue |
|---|---|---|
| Retail | 1 | $681B |
|
||
| Food / Agriculture | 1 | $53B |
|
||
| Retail / Energy | 1 | $22B |
|
||
| Transportation / Logistics | 1 | $12B |
|
||
| Energy | 1 | $4B |
|
||
Price history
-29.0% since first listed7 events — show timeline
- 2026-05-05 Price Changed $66,000 NEABOR MLS
- 2026-01-27 Listed $81,000 NEABOR MLS
- 2025-06-19 Price Changed $78,000 NEABOR MLS
- 2024-10-20 Listed $80,000 NEABOR MLS
- 2024-10-18 Price Changed $80,000 NEABOR MLS
- 2024-09-24 Price Changed $85,000 NEABOR MLS
- 2024-07-22 Listed $93,000 NEABOR MLS
Property tax history
+5.3%/yrLatest (2025): $231 · +0.0% YoY. Source: county tax records.
Cash-flow waterfall
monthlySold comps — $/sqft
last 12 mo · ≤1 miLoading sold comps…