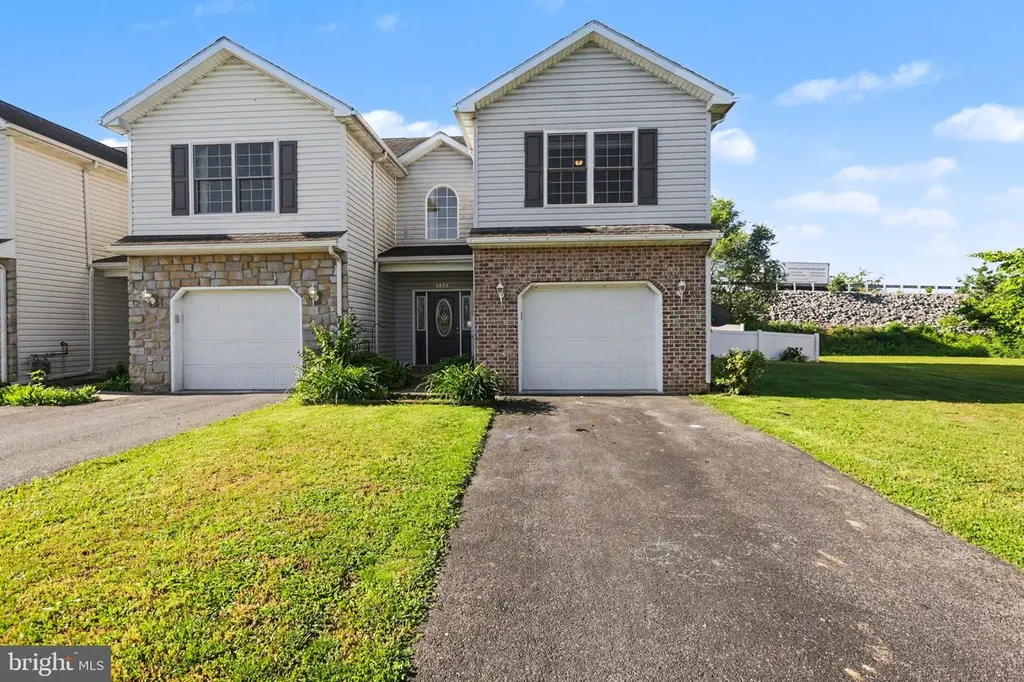
130 Sable Dr · South Middleton, PA
Flood risk 1/10 · Minimal
- FEMA flood zone
- X (unshaded)
- Chance of flooding over 30 yrs
- 0.0%
- Est. flood insurance / yr
- $507 – $1,088
Fire risk 1/10 · Minimal
- Est. fire insurance / yr
- $511 – $949
Heat risk 5/10 · Moderate
- Hot days now (above 101°F)
- 7 days/yr
- Hot days in 30 yrs
- 15 days/yr
Wind risk 3/10 · Minor
- Chance of severe wind over 30 yrs
- 4.0%
Air-quality risk 2/10 · Minimal
- Unhealthy air days now
- 1 days/yr
- Unhealthy air days in 30 yrs
- 3 days/yr
Risk factors via First Street. Map © Google.
Why this score? — see what drove the D grade
The composite is a weighted blend of 9 inputs, each scored 0–100. Each bar is that input's sub-score; the figure is the points it added to the 100-point composite (weight × sub-score).
- Cash flow +12.4/30.0
- ARV discount +8.9/15.0
- Schools +4.8/10.0
- DSCR +3.7/10.0
- 1% rule +3.3/10.0
- Rent growth +3.1/5.0
- Livability +2.5/5.0
- Condition / age +2.5/5.0
- Appreciation +0.0/10.0
$240,000
🖨 Deal sheet (PDF) 📄 Offer letter ✓ Due diligence
Listing remarks MLS
ATTRACTIVE BRICK & VINYL 3 BEDROOM, 2.5 BATH END UNIT TOWNHOUSE IN HIGHLY DESIRABLE S. MIDDLETON SCHOOL DISTRICT FEATURING 1 CAR GARAGE , OPEN STAIRCASE FOYER, LARGE LIVING ROOM, EAT-IN KITCHEN WITH GAS RANGE & PANTRY, ALL APPLIANCES CONVEY, FENCED IN PRIVATE BACKYARD WITH DECK, HUGE MASTER SUITE WITH WALK IN CLOSET & PRIVATE BATH AND CONVENIENT 2ND FLOOR LAUNDRY. SAVE MONEY ON UTILITIES WITH HIGHLY EFFICIENT GAS HEAT ALONG WITH CENTRAL AIR. LOW $40/MONTH HOA FEE.
Key facts
- $40 HOA
- Garage
- Built 2007
Property features AI
Finance
- Other: Land and improvement assessed values recorded
Exterior
- Parking: Attached covered garage (1 car)
- Utilities: Public water; Public sewer; Electric service
- Home design: End of row/townhouse design; Fee simple ownership
- Construction: Brick and vinyl siding exterior; Foundation described as other; Year built sourced from assessor
- Exterior features: End-of-row townhouse; Above-grade and below-grade structures noted; Not in a federal flood zone
Interior
- Kitchen: Kitchen (appliances not specified)
- Bedrooms: Three bedrooms on the upper level (master bedroom plus two additional bedrooms)
- Bathrooms: Two full bathrooms (on upper levels); One half bathroom on the main level
- Heating & cooling: Forced air heating (natural gas); Central air conditioning; Electric hot water
- Interior features: Estimated living area; 2+ access exits; No basement; Rooms include living room, dining room, foyer, utility room
- Laundry & utility: Laundry room; Utility room
Neighborhood map
What this means for you Summary
Snapshot
- This is a 3-bed/2.5-bath townhouse listed at $240k.
Deal economics
- At list price, monthly cash flow is $-41 ($-491/yr) — negative.
- To cash-flow at today's rent, offer at most $233k (3.0% below list).
- To meet the 1% rule (rent ≥ 1% of price), the offer needs to be $199k (17.3% below list).
- Recommended offer: $199k (17.3% below list) — sets the bar for 1% rule.
Location & tenants
- Location reads: area grade D — affects rentability + tenant quality, not the cash-flow math above.
- South Middleton SD (town): math 45% / reading 63% proficiency, ranked #106 of 539 in PA (top 20%) — acceptable for families but not a draw, mixed tenant base, ~2y average lease; only 16% free/reduced lunch — higher-income household profile.
- Zoned schools: W.G. Rice El Sch (432 students, 38% FRL); Yellow Breeches Ms (math 27% / reading 59%, grade D-, #214 of 512 statewide, top 42%, 474 students, 31% FRL); Boiling Springs Hs (math 72% / reading 72%, grade B+, #39 of 437 statewide, top 9%, 777 students, 22% FRL).
- Market conditions: Rents rising (+2.5%/yr); 312 active listings in the ZIP; 21 comparable units currently listed for rent nearby; rentals at typical pace (median 25d on market — plan ~3-4 weeks tenant-placement turnaround); 1,052 units permitted in Cumberland County in 2024 (310 in 5+ unit buildings).
- This rent runs 34% of the median local income ($71k/yr) — at the standard rent-burdened threshold; future hikes will face affordability resistance.
Forward outlook
- Local home prices are declining (-3.0%/yr); year-one equity from $2k of loan paydown is wiped out by about $7k of value loss. Plan a longer hold.
- Cumberland County population projected at +17% by 2050 — long-run rental-demand tailwind backs the buy-and-hold thesis.
Negotiation context
- Only 14 days on market — expect competitive offers; lowballing is unlikely to land.
- Current owner paid $150k; list at $240k implies a 60% gain — meaningful room to come down on a strong offer.
Risks & watch-outs
- Climate carrying-cost: extreme-heat days projected 7→15/yr by 2055 (HVAC capex compounding) — expect insurance premiums to compound above CPI over the hold.
Questions for the listing agent
- What do current leases actually rent for vs. the listed asking? Can we see a recent rent roll and the last 12 months of T-12 income?
- What does the HOA fee cover, when was the last increase, and are there any pending special assessments or reserve-fund shortfalls?
- Is there a deadline driving the sale (1031 exchange, divorce, estate, relocation)? That informs how much negotiation room exists.
- The area grade is low — what's the realistic commute time and amenity access for the typical tenant pool here? Any planned neighborhood developments (good or bad) we should know about?
- What's the average days-on-market for RENTAL listings here right now (not sales)? A rising rental-DOM trend means longer vacancies and softer asking-rent achievability than the comps imply.
- What's the recent tenant-quality profile in this submarket — average credit score on applications, eviction rate, late-payment / NSF rate, and stable-employment percentage? A property-management company in the area should have these aggregated.
- How much new for-sale + rental construction is in the pipeline within 1–3 miles? Heavy new supply typically softens prices + rents 12–24 months out; constrained supply supports both.
Investment metrics
- 1% rule
- 0.83% ✗
- Cap rate
- 6.09%
- Cash-on-cash
- -0.73%
- DSCR
- 0.97
- GRM
- 10.1
CMA / ARV
- ARV (on-the-fly)
- $247,608
- Comps found
- 8
Show comp detail 8 sales within ~0.75 mi
| Address | Dist | Beds/Ba | Sqft | Sold | Price | $/sf | Match |
|---|---|---|---|---|---|---|---|
| 134 Sable Dr | 0.01mi | 3/2.5 | 1,629 (0%) | 1mo | $223,000 | $137 | 99 |
| 315 Pelham Ct | 0.07mi | 3/2.5 | 1,584 (-3%) | 8mo | $316,725 | $200 | 86 |
| 319 Pelham Ct | 0.07mi | 3/2.5 | 1,584 (-3%) | 8mo | $307,000 | $194 | 85 |
| 317 Pelham Ct | 0.07mi | 3/2.5 | 1,584 (-3%) | 9mo | $240,000 | $152 | 85 |
| 313 Pelham Ct | 0.09mi | 3/2.5 | 1,584 (-3%) | 13mo | $329,700 | $208 | 80 |
| 202 Sable Dr | 0.07mi | 3/2.5 | 1,629 (0%) | 23mo | $240,200 | $147 | 78 |
| 116 Sable Dr | 0.05mi | 3/2.0 | 1,570 (-4%) | 18mo | $231,000 | $147 | 74 |
| 310 Fairview St | 0.69mi | 3/1.5 | 1,608 (-1%) | 0mo | $140,000 | $87 | 61 |
Match score weights: distance 35% · size 25% · config 20% · recency 20%. Top-matched comps best support the ARV.
Projected returns pro-forma
-3.0% appreciation · 2.54% rent growth · sell at horizon
- IRR
- -18.0%
- Equity multiple
- 0.37×
- Total profit
- $-42,411
- Equity at exit
- $35,785
- IRR
- -11.1%
- Equity multiple
- 0.35×
- Total profit
- $-44,005
- Equity at exit
- $20,751
Cash invested: $67,200 (down + closing). Projections, not guarantees.
Landlord ↔ Tenant lean methodology
- Overall (STATE)
- 62 Landlord-Friendly
- State Pennsylvania
- 62 Landlord-Friendly · EVEN
- County
- — inherits STATE
- City
- — inherits STATE
ZIP-level market 17013
- Rents YoY
- 2.5%
- Active inventory
- 312
- Price-to-rent
- 10.1×
Monthly cashflow live
- Estimated rent
- $1,986 high interval (Pro) →
- Mortgage (P&I)
- −$1,259
- Tax from tax record
- −$211 /mo · $2,531/yr
- Insurance
- −$100
- HOA
- −$40
- Vacancy / Maint / Mgmt
- −$417
- Net cashflow
- $-41
Break-even live
Sensitivity live
| Price | -10% $95 | -5% $27 | +0% $-41 | +5% $-109 | +10% $-177 |
|---|---|---|---|---|---|
| Rent | -10% $-198 | -5% $-119 | +0% $-41 | +5% $38 | +10% $116 |
| Rate | -1.0pp $80 | -0.5pp $20 | base $-41 | +0.5pp $-103 | +1.0pp $-166 |
UW: 25.0% down · 7.5% · 30yr · 1.5% tax · 5.0% vac · 8.0% maint · 8.0% mgmt
Financing live
Cash to close
- Down payment
- $60,000
- Closing costs
- $7,200
- Reserves months
- —
- Total cash needed
- —
Loan-product check · same deal, 3 products live
Conventional
25% down · 7.5% · 30yr
- Down + closing
- —
- Monthly P&I
- —
- Monthly cashflow
- —
- DSCR
- —
- Eligible?
- —
Personal DTI + credit; lowest rate.
DSCR
20% down · 8.5% · 30yr
- Down + closing
- —
- Monthly P&I
- —
- Monthly cashflow
- —
- DSCR
- —
- Eligible?
- —
No personal income docs; deal must DSCR.
Hard money
10% down · 12.0% · 12mo
- Down + closing
- —
- Monthly P&I
- —
- Monthly cashflow
- —
- DSCR
- —
- Eligible?
- —
Short-term bridge; refi at stabilization.
Rent comps 21 comps
| Address | Beds | Baths | Sqft | Rent | $/sqft | DOM | Units | Dist |
|---|---|---|---|---|---|---|---|---|
| 134 Sable Dr Carlisle, PA | 3.0 | 2.5 | 1629 | $2,100 | $1.29 | 15d | 1 | 0.04mi |
| 206 Alfalfa Dr CARLISLE BRKS, PA | 4.0 | 2.5 | 1625 | $2,050 | $1.26 | 25d | 1 | 0.41mi |
| 308 Alfalfa Dr CARLISLE BRKS, PA | 4.0 | 2.5 | 1625 | $2,150 | $1.32 | 25d | 1 | 0.41mi |
| 315 York Rd Carlisle, PA | 3.0 | 2.5 | 1604 | $2,100 | $1.31 | 15d | 1 | 0.50mi |
| 79 Dawn Ridge Loop Carlisle, PA | 2.0–3.0 | 1.0–1.5 | 1179 | $1,474 | $1.25 | 15d | 4 | 0.51mi |
| 495 S Spring Garden St #308 Carlisle, PA | 4.0 | 2.5 | 1625 | $1,835 | $1.13 | 45d | 1 | 0.64mi |
| 495 S Spring Garden St #202 Carlisle, PA | 4.0 | 2.5 | 1625 | $2,050 | $1.26 | 25d | 1 | 0.64mi |
| 495 S Spring Garden St #109 Carlisle, PA | 4.0 | 2.5 | 1625 | $2,150 | $1.32 | 25d | 1 | 0.64mi |
| 495 S Spring Garden St Unit 302 Carlisle, PA | 4.0 | 2.5 | 1625 | $1,735 | $1.07 | 45d | 1 | 0.64mi |
| 1 Rush Dr Carlisle, PA | 2.0 | 2.0 | 1033 | $1,650 | $1.60 | 15d | 3 | 0.68mi |
| 16 Brook Side Dr Carlisle, PA | 3.0 | 2.5 | 1632 | $1,975 | $1.21 | 15d | 1 | 1.08mi |
| 26 Spring View St Carlisle, PA | 2.0 | 2.5 | 1281 | $1,700 | $1.33 | 15d | 1 | 1.13mi |
| 34 S Hanover St Apt 3, Carlisle, PA 17013 Carlisle, PA | 2.0 | 1.0 | 1100 | $1,650 | $1.50 | 25d | 1 | 1.16mi |
| 156 E Penn St Carlisle, PA | 3.0 | 3.0 | 1808 | $1,850 | $1.02 | 25d | 1 | 1.19mi |
| 131 Nava CT Carlisle, PA | 2.0–3.0 | 2.0 | 1345 | $1,650 | $1.23 | 15d | 1 | 1.24mi |
| 50 W High St Unit 203 Carlisle, PA | 2.0 | 1.5 | 1100 | $2,180 | $1.98 | 25d | 1 | 1.29mi |
| 54 W High St Carlisle, PA | 2.0 | 1.0 | 1100 | $2,180 | $1.98 | 25d | 1 | 1.29mi |
| 219 N Hanover St Unit 3 Carlisle, PA | 2.0 | 1.0 | 1400 | $1,850 | $1.32 | 25d | 1 | 1.33mi |
| 7 Kerrs Ave Carlisle, PA | 4.0 | 1.5 | 1652 | $1,750 | $1.06 | 45d | 1 | 1.35mi |
| 15 Parker Spring Ave Carlisle, PA | 3.0 | 2.5 | 1810 | $2,300 | $1.27 | 15d | 1 | 1.38mi |
| 230 N Pitt St Carlisle, PA | 3.0 | 1.5 | 1408 | $1,300 | $0.92 | 45d | 1 | 1.46mi |
HOA detail
- Monthly dues
- $40 · $480/yr
- Likely covers
- gas
Listing history 13 events
-
2026-06-17status $240,000 Pending 14 DOM
-
2026-06-17days on market $240,000 Active 14 DOM
-
2026-06-16days on market $240,000 Active 13 DOM
-
2026-06-15days on market $240,000 Active 12 DOM
-
2026-06-14days on market $240,000 Active 10 DOM
-
2026-06-10days on market $240,000 Active 7 DOM
-
2026-06-09days on market $240,000 Active 6 DOM
-
2026-06-08days on market $240,000 Active 5 DOM
-
2026-06-07days on market $240,000 Active 4 DOM
-
2026-06-05statusdays on market $240,000 Active 1 DOM
-
2026-06-03days on market $240,000 Coming Soon 2 DOM
-
2026-06-01remarks 699-char remark
-
2026-06-01$240,000 Coming Soon 1 DOM
ⓘ Source: listings_history table (triggers on properties + properties_extension) + one-shot
backfill from property_details.listing_events for pre-trigger history.
Tax reassessment forecast PA · Partial reset (capped growth)
- Current annual tax
- $2,531 · $211/mo
- Projected year-2 tax
- $3,162 · $263/mo
- Expected delta
- +$630/yr (+$53/mo · 24.9%)
ⓘ Screening estimate from a state-policy table — verify with the county assessor before closing.
Climate risk First Street
- Flood 1/10 Low FEMA zone X (unshaded) · 0% chance over 30 yrs
- Wildfire 1/10 Low
- Heat 5/10 Major 7 d/yr ≥101°F today · 15 d/yr by 30 yrs out
- Wind 3/10 Moderate 4% chance of damaging wind over 30 yrs
- Air quality 2/10 Low 1 unhealthy d/yr today · 3 by 30 yrs out
Nearby sold comps map
Loading sold comps map…
Walkable amenities ~0.75 mi
Loading nearby amenities…
Taxation est. · year 1
- Rental income
- $23,827
- − Mortgage interest
- −$13,444
- − Property taxes
- −$2,531
- − Insurance
- −$1,200
- − Repairs & maintenance
- −$1,906
- − Management
- −$1,906
- − HOA
- −$480
- − Depreciation
- −$6,982
- Taxable loss
- −$4,622
- Est. tax savings @ 24.0%
- +$1,109
- After-tax cash flow
- $618/yr
For passive investors: Depreciation is non-cash, so a rental often shows a tax loss while cash-flowing — sheltering income. Rental losses are passive: they offset passive income freely, and up to $25,000/yr can offset ordinary (W-2) income if you actively participate and your MAGI is under $100k (phasing out to $0 by $150k); unused losses carry forward. On sale, claimed depreciation is recaptured at up to 25%, and gains may owe capital-gains tax (a 1031 exchange can defer both). Figures are a year-1 estimate at your 24.0% rate — not tax advice; consult a CPA.
Schools (NCES district)
- District
- South Middleton SD
- NCES district ID
- 4222050
- Math proficiency
- 45% ▼ -8.00%
- Reading proficiency
- 63% ▼ -7.00%
- Median HH income
- $67,822
- Composite
- 47.74/100
- National rank
- #2236
- State rank
- #106 of 539 in PA
Livability — South Middleton
No livability data for this city. (Only ~50 U.S. cities are tracked.)
Census & demographics
- County
- Cumberland County · 257,673 people
- Metro
- Harrisburg-Carlisle, PA
- Population (ZIP)
- 38,513
- Household income
- $71,042
- Rent vs Own
- Severe rent burden
- 1444.0
Population outlook (Cumberland County) Hauer SSP2
- Today (2025)
- 267,950 people
- By 2030
- 278,105 · +3.8%
- By 2040
- 296,552 · +10.7%
- By 2050
- 312,937 · +16.8%
- By 2075
- 349,233 · +30.3%
- By 2100
- 361,875 · +35.1%
Race, ethnicity, and origin ACS 2023
- Neighborhood character
- Predominantly White (79%)
- Race & ethnicity
- White 79% Black 8% Hispanic / Latino 7% Two or more races 6% Asian 3%
- Hispanic origin (detail)
- Puerto Rican 3% Dominican 1%
- Common ancestry
- Iranian 3% Romanian 3% Lithuanian 2%
- Foreign-born
- 7% · Canada, Vietnam
- Languages at home
- 91% English-only · Spanish 3% Russian/Polish/Slavic 1% Arabic 1%
Political lean MEDSL · Cumberland
- 2024 margin
- Lean R (+9.4) · D 44.6% · R 54.1% · Other 1.3%
- 2008→2024 swing
- +4.2pp toward D · 2008: -13.6pp · 2024: -9.4pp
- All cycles
- 2024: R+9.4 2020: R+10.6 2016: R+18.6 2012: R+18.5 2008: R+13.6
Not yet ingested
- Civics
- —
Market trends
- HPI YoY
- ▼ -140.48%
- Current HPI
- 247.337
- Rent YoY
- ▲ 2.54%
- Metro
- Harrisburg-Carlisle, PA
- State GDP YoY
- ▲ 1.68%
- F500 in state
- 34
Industry mix (Fortune 500 HQ in PA)
| Industry | F500 HQs | Revenue |
|---|---|---|
| Healthcare | 2 | $309B |
|
||
| Insurance | 2 | $27B |
|
||
| Telecommunications / Media | 1 | $124B |
|
||
| Industrial Distribution | 1 | $22B |
|
||
| Financial Services | 1 | $20B |
|
||
| Chemicals / Materials | 1 | $18B |
|
||
Price history
+60.0% since first listed6 events — show timeline
- 2026-06-01 Coming Soon $240,000 BRIGHT MLS
- 2017-02-21 Sold (Public Records) $149,900 Public Records
- 2017-02-17 Sold (MLS) $149,900 BRIGHT MLS
- 2017-01-06 Listing Removed — BRIGHT MLS
- 2016-07-20 Listed $149,900 BRIGHT MLS
- 2011-03-31 Sold (Public Records) $150,000 Public Records
Property tax history
+3.8%/yrLatest (2026): $2,531 · +4.5% YoY. Source: county tax records.
Cash-flow waterfall
monthlySold comps — $/sqft
last 12 mo · ≤1 miLoading sold comps…