100 Janin Rd · Broussard, LA
Flood risk 1/10 · Minimal
- FEMA flood zone
- X (unshaded)
- Chance of flooding over 30 yrs
- 0.0%
- Est. flood insurance / yr
- $507 – $1,088
Fire risk 1/10 · Minimal
- Est. fire insurance / yr
- $1,269 – $2,357
Heat risk 9/10 · Severe
- Hot days now (above 108°F)
- 7 days/yr
- Hot days in 30 yrs
- 22 days/yr
Wind risk 9/10 · Severe
- Chance of severe wind over 30 yrs
- 99.0%
Air-quality risk 2/10 · Minimal
- Unhealthy air days now
- 1 days/yr
- Unhealthy air days in 30 yrs
- 1 days/yr
Risk factors via First Street. Map © Google.
Why this score? — see what drove the B- grade
The composite is a weighted blend of 9 inputs, each scored 0–100. Each bar is that input's sub-score; the figure is the points it added to the 100-point composite (weight × sub-score).
- Cash flow +30.0/30.0
- 1% rule +10.0/10.0
- DSCR +10.0/10.0
- ARV discount +7.5/15.0
- Schools +3.6/10.0
- Livability +3.6/5.0
- Rent growth +2.5/5.0
- Condition / age +2.5/5.0
- Appreciation +0.0/10.0
$75,000
🖨 Deal sheet 📄 Offer letter ✓ Due diligence
Listing remarks
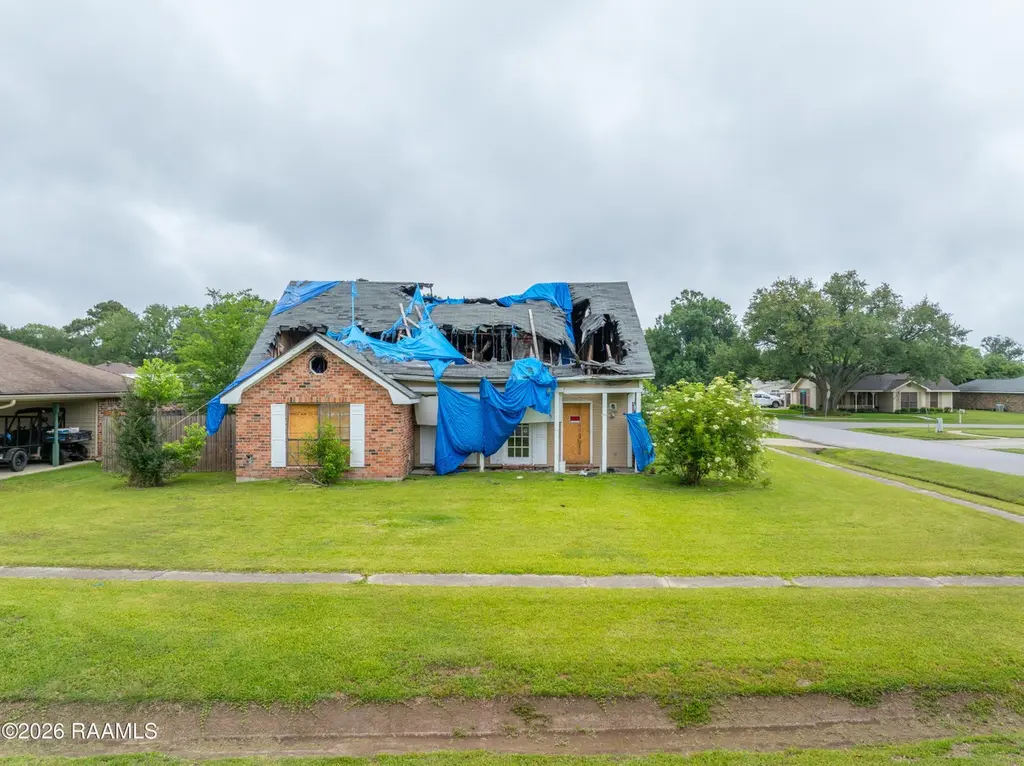
Opportunity knocks with this 3-bedroom, 2-bath home offering approximately 1756 square feet of potential in the heart of Broussard. This property has sustained fire damage and will require significant renovation, making it an ideal project for investors, flippers, or buyers looking to customize a home from the ground up. This property is a blank canvas for the right vision. Located in a desirable area with convenient access to shopping, dining, and schools, the after-repair value could make this a worthwhile investment. Property is being sold as-is, where-is. Cash or renovation financing may be required. Bring your contractor and imagination--don't miss this chance to transform this propert
Key facts
- 0.24 acre lot
- 2 parking spots
- Built 2008
Property features AI
Exterior
- Parking: Carport (2 covered spaces, total 2 parking spaces)
- Utilities: Public sewer; Electric service: SLEMCO
- Home design: Single-family residence; City street frontage; Paved road access
- Construction: Brick veneer and brick construction with vinyl siding accents; Tile roof
- Exterior features: Privacy wood fencing; Open porch/patio; Shed(s); Workshop
Interior
- Other: 1 fireplace
- Kitchen: Electric cooktop; Microwave; Refrigerator; Freezer
- Flooring: Carpet; Concrete; Tile
- Bathrooms: 2 full bathrooms
- Heating & cooling: Central heating; Central air conditioning; Has heating and cooling
- Interior features: Built-in bookcases; Non-wood countertops
- Laundry & utility: Washer included
Neighborhood map
What this means for you Summary
Snapshot
- This is a 3-bed/2.0-bath single-family listed at $75k.
Deal economics
- At list price, monthly cash flow is $1k ($14k/yr) — positive.
- The deal already cash-flows at list — no discount required.
- Meets the 1% rule at list price ($2k rent vs $75k).
- Recommended offer: $73k (3.0% below list) — sets the bar for market timing.
- Cap rate 24.6% vs local median 4.7% in Broussard — top-decile yield for the area; either an underpriced asset or a hidden risk that comps aren't pricing in. Stress-test before assuming the spread holds.
Location & tenants
- Location reads 71/100 on livability (#49 in LA) — a middle-class / working-renter tenant base. Strengths: housing A+, cost of living A-, employment B+; Watch: amenities F, commute F, health & safety F.
- Lafayette Parish (urban): math 38% / reading 46% proficiency, ranked #19 of 98 in LA (top 19%) — families likely to look elsewhere, expect single-tenant / working-renter base with shorter leases.
- Zoned schools: Katharine Drexel Elementary School (math 34% / reading 57%, grade D-, #169 of 646 statewide, top 27%, 646 students, 69% FRL); Broussard Middle School (math 38% / reading 51%, grade D, #49 of 218 statewide, top 23%, 581 students, 60% FRL); O. Comeaux High School (math 38% / reading 40%, grade F, #86 of 265 statewide, top 33%, 1,098 students, 56% FRL).
- Market conditions: 339 active listings in the ZIP; 4 comparable units currently listed for rent nearby; rentals at typical pace (median 21d on market — plan ~3-4 weeks tenant-placement turnaround); solid renter incomes; 1,585 units permitted in Lafayette Parish in 2024 (10 in 5+ unit buildings).
Forward outlook
- Local home prices are declining (-3.0%/yr); year-one equity from $519 of loan paydown is wiped out by about $2k of value loss. Plan a longer hold.
- Lafayette County population projected at +34% by 2050 — long-run rental-demand tailwind backs the buy-and-hold thesis.
- At projected returns (-3.0% appreciation + 3.0% rent growth), your $21k cash investment doubles in ~2 years — after that, you're playing with house money.
Negotiation context
- It's been on market 41 days — a 3% lower offer ($73k) is reasonable based on typical stale-listing flexibility.
Risks & watch-outs
- Climate carrying-cost: severe wind risk, 99% chance of damaging wind over 30y; extreme-heat days projected 7→22/yr by 2055 (HVAC capex compounding) — expect insurance premiums to compound above CPI over the hold.
Questions for the listing agent
- It's been on market 41 days. Have you received any prior offers? Is the seller open to a 3% concession, seller financing, or rate buy-down credit?
- Is there a deadline driving the sale (1031 exchange, divorce, estate, relocation)? That informs how much negotiation room exists.
- Schools are B-rated — typically a magnet for longer-tenancy family renters. What's the average tenant stay here, and is there a school-zone premium baked into asking?
- What's the average days-on-market for RENTAL listings here right now (not sales)? A rising rental-DOM trend means longer vacancies and softer asking-rent achievability than the comps imply.
- What's the recent tenant-quality profile in this submarket — average credit score on applications, eviction rate, late-payment / NSF rate, and stable-employment percentage? A property-management company in the area should have these aggregated.
- How much new for-sale + rental construction is in the pipeline within 1–3 miles? Heavy new supply typically softens prices + rents 12–24 months out; constrained supply supports both.
Investment metrics
- 1% rule
- 2.85% ✓
- Cap rate
- 24.56%
- Cash-on-cash
- 65.26%
- DSCR
- 3.90
- GRM
- 2.9
CMA / ARV
- ARV (median comp)
- $229,751
- List price
- $75,000
- Delta
- -67.36%
- Verdict
- UNDERPRICED
- Comps
- 20 within 1.0 mi
Show comp detail 12 sales within ~0.75 mi
| Address | Dist | Beds/Ba | Sqft | Sold | Price | $/sf | Match |
|---|---|---|---|---|---|---|---|
| 103 Chattanooga Pl | 0.18mi | 3/2.0 | 1,722 (-2%) | 3mo | $235,000 | $136 | 86 |
| 713 Burlington Cir | 0.08mi | 3/2.0 | 1,625 (-8%) | 2mo | $233,000 | $143 | 82 |
| 107 Gettysburg Dr | 0.16mi | 3/3.0 | 1,655 (-6%) | 9mo | $245,000 | $148 | 71 |
| 200 Bull Run Cir | 0.18mi | 3/2.0 | 1,594 (-9%) | 6mo | $248,000 | $156 | 71 |
| 120 Lake Ridge Dr | 0.40mi | 3/2.0 | 1,836 (+5%) | 5mo | $251,000 | $137 | 70 |
| 127 Lake Ridge Dr | 0.40mi | 4/2.0 (+1) | 1,836 (+5%) | 6mo | $251,000 | $137 | 64 |
| 136 Lake Ridge Dr | 0.49mi | 3/2.0 | 1,616 (-8%) | 3mo | $249,000 | $154 | 62 |
| 124 Lake Ridge Dr | 0.62mi | 4/2.0 (+1) | 1,786 (+2%) | 6mo | $250,500 | $140 | 58 |
| 123 Lake Ridge Dr | 0.62mi | 4/2.0 (+1) | 1,704 (-3%) | 6mo | $247,000 | $145 | 56 |
| 122 Lake Ridge Dr | 0.63mi | 3/2.0 | 1,616 (-8%) | 10mo | $242,500 | $150 | 49 |
| 126 Lake Ridge Dr | 0.62mi | 4/2.0 (+1) | 1,874 (+7%) | 8mo | $259,500 | $138 | 49 |
| 119 Lake Ridge Dr | 0.73mi | 4/2.0 (+1) | 1,874 (+7%) | 11mo | $260,500 | $139 | 41 |
Match score weights: distance 35% · size 25% · config 20% · recency 20%. Top-matched comps best support the ARV.
Projected returns pro-forma
-3.0% appreciation · 3.0% rent growth · sell at horizon
- IRR
- 64.5%
- Equity multiple
- 3.89×
- Total profit
- $60,630
- Equity at exit
- $11,183
- IRR
- 68.8%
- Equity multiple
- 7.98×
- Total profit
- $146,651
- Equity at exit
- $6,485
Cash invested: $21,000 (down + closing). Projections, not guarantees.
Landlord ↔ Tenant lean methodology
- Overall (STATE)
- 90 Strongly Landlord-Friendly
- State Louisiana
- 90 Strongly Landlord-Friendly · R+12
- County
- — inherits STATE
- City
- — inherits STATE
ZIP-level market 70518
- Home prices YoY
- -16.0%
- Active inventory
- 339
- Price-to-rent
- 2.9×
Monthly cashflow live
- Estimated rent
- $2,136 medium interval (Pro) →
- Mortgage (P&I)
- −$393
- Tax from tax record
- −$121 /mo · $1,447/yr
- Insurance
- −$31
- HOA
- −$0
- Vacancy / Maint / Mgmt
- −$448
- Net cashflow
- $1,142
Break-even live
UW: 25.0% down · 7.5% · 30yr · 1.5% tax · 5.0% vac · 8.0% maint · 8.0% mgmt
Financing live
Cash to close
- Down payment
- $18,750
- Closing costs
- $2,250
- Reserves months
- —
- Total cash needed
- —
Loan-product check · same deal, 3 products live
Conventional
25% down · 7.5% · 30yr
- Down + closing
- —
- Monthly P&I
- —
- Monthly cashflow
- —
- DSCR
- —
- Eligible?
- —
Personal DTI + credit; lowest rate.
DSCR
20% down · 8.5% · 30yr
- Down + closing
- —
- Monthly P&I
- —
- Monthly cashflow
- —
- DSCR
- —
- Eligible?
- —
No personal income docs; deal must DSCR.
Hard money
10% down · 12.0% · 12mo
- Down + closing
- —
- Monthly P&I
- —
- Monthly cashflow
- —
- DSCR
- —
- Eligible?
- —
Short-term bridge; refi at stabilization.
Rent comps 4 comps
| Address | Beds | Baths | Sqft | Rent | $/sqft | DOM | Units | Dist |
|---|---|---|---|---|---|---|---|---|
| 105 Harvest Hill Dr Broussard, LA | 4.0 | 2.0 | 1706 | $2,250 | $1.32 | 13d | 1 | 1.27mi |
| 711 E Main St #100 Broussard, LA | 3.0 | 2.0 | 1644 | $2,750 | $1.67 | 43d | 1 | 1.41mi |
| 711 E Main St #900 Broussard, LA | 3.0 | 3.0 | 2276 | $1,895 | $0.83 | 21d | 1 | 1.41mi |
| 231 Saint Nazaire Rd Broussard, LA | 1.0–3.0 | 1.0–2.0 | 1080 | $1,715 | $1.59 | 13d | 27 | 1.48mi |
Listing history 18 events
-
2026-06-18days on market $75,000 Active 41 DOM
-
2026-06-17days on market $75,000 Active 40 DOM
-
2026-06-16days on market $75,000 Active 39 DOM
-
2026-06-15days on market $75,000 Active 38 DOM
-
2026-06-14days on market $75,000 Active 36 DOM
-
2026-06-13days on market $75,000 Active 35 DOM
-
2026-06-10days on market $75,000 Active 33 DOM
-
2026-06-09days on market $75,000 Active 32 DOM
-
2026-06-09price $75,000 Active 31 DOM
-
2026-06-08days on market $87,000 Active 31 DOM
-
2026-06-07days on market $87,000 Active 30 DOM
-
2026-06-05days on market $87,000 Active 27 DOM
-
2026-06-03days on market $87,000 Active 26 DOM
-
2026-06-02days on market $87,000 Active 25 DOM
-
2026-06-01days on market $87,000 Active 24 DOM
-
2026-05-31days on market $87,000 Active 23 DOM
-
2026-05-30days on market $87,000 Active 22 DOM
-
2026-05-08$87,000 Active 758-char remark
ⓘ Source: listings_history table (triggers on properties + properties_extension) + one-shot
backfill from property_details.listing_events for pre-trigger history.
Tax reassessment forecast LA · Resets to sale price
- Current annual tax
- $1,447 · $121/mo
- Projected year-2 tax
- $1,447 · $121/mo
- Expected delta
- $0/yr ($0/mo · 0.0%)
ⓘ Screening estimate from a state-policy table — verify with the county assessor before closing.
Climate risk First Street
- Flood 1/10 Low FEMA zone X (unshaded) · 0% chance over 30 yrs
- Wildfire 1/10 Low
- Heat 9/10 Extreme 7 d/yr ≥108°F today · 22 d/yr by 30 yrs out
- Wind 9/10 Extreme 99% chance of damaging wind over 30 yrs
- Air quality 2/10 Low 1 unhealthy d/yr today · 1 by 30 yrs out
Nearby sold comps map
Loading sold comps map…
Walkable amenities ~0.75 mi
Loading nearby amenities…
Taxation est. · year 1
- Rental income
- $25,627
- − Mortgage interest
- −$4,201
- − Property taxes
- −$1,447
- − Insurance
- −$375
- − Repairs & maintenance
- −$2,050
- − Management
- −$2,050
- − Depreciation
- −$2,182
- Taxable income
- $13,322
- Est. tax owed @ 24.0%
- −$3,197
- After-tax cash flow
- $10,507/yr
For passive investors: Depreciation is non-cash, so a rental often shows a tax loss while cash-flowing — sheltering income. Rental losses are passive: they offset passive income freely, and up to $25,000/yr can offset ordinary (W-2) income if you actively participate and your MAGI is under $100k (phasing out to $0 by $150k); unused losses carry forward. On sale, claimed depreciation is recaptured at up to 25%, and gains may owe capital-gains tax (a 1031 exchange can defer both). Figures are a year-1 estimate at your 24.0% rate — not tax advice; consult a CPA.
Schools (NCES district)
- District
- Lafayette Parish
- NCES district ID
- 2200870
- Math proficiency
- 38% ▼ -32.00%
- Reading proficiency
- 46% ▼ -24.00%
- Median HH income
- $50,238
- Composite
- 36.15/100
- National rank
- #4741
- State rank
- #19 of 98 in LA
Livability — Broussard
- Score
- 71/100
- State rank
- #49
- US rank
- #7184
Category grades
Schools grade is shown separately in the Schools card above.
Census & demographics
- County
- Lafayette Parish · 207,544 people
- City population
- 17,263
- Metro
- Lafayette, LA
- Population (ZIP)
- 17,263
- Household income
- $106,710
- Rent vs Own
- Severe rent burden
- 117.0
Population outlook (Lafayette County) Hauer SSP2
- Today (2025)
- 280,930 people
- By 2030
- 301,092 · +7.2%
- By 2040
- 339,456 · +20.8%
- By 2050
- 375,156 · +33.5%
- By 2075
- 451,672 · +60.8%
- By 2100
- 497,203 · +77.0%
Race, ethnicity, and origin ACS 2023
- Neighborhood character
- Predominantly White (74%)
- Race & ethnicity
- White 74% Black 15% Two or more races 5% Hispanic / Latino 5% Asian 3%
- Hispanic origin (detail)
- Mexican 1%
- Common ancestry
- Lithuanian 20% Romanian 2% Portuguese 1%
- Foreign-born
- 4% · Canada
- Languages at home
- 93% English-only · Spanish 3% Other Asian/Pacific 2% French/Haitian/Cajun 1%
Political lean MEDSL · Lafayette
- 2024 margin
- Solid R (+31.4) · D 33.5% · R 64.8% · Other 1.7%
- 2008→2024 swing
- -0.1pp no change · 2008: -31.3pp · 2024: -31.4pp
- All cycles
- 2024: R+31.4 2020: R+28.7 2016: R+33.6 2012: R+33.7 2008: R+31.3
Not yet ingested
- Civics
- —
Market trends
- HPI YoY
- ▼ -30.65%
- Current HPI
- 160.4167
- Rent YoY
- —
- Metro
- Lafayette, LA
- State GDP YoY
- ▲ 3.29%
- F500 in state
- 10
Industry mix (Fortune 500 HQ in LA)
| Industry | F500 HQs | Revenue |
|---|---|---|
| Telecommunications | 2 | $23B |
|
||
| Utilities | 1 | $12B |
|
||
| Wholesale / Distribution | 1 | $5B |
|
||
| Advertising | 1 | $2B |
|
||
Price history
-13.8% since first listed2 events — show timeline
- 2026-06-08 Price Changed $75,000 AcadianaMLS
- 2026-05-08 Listed $87,000 AcadianaMLS
Property tax history
+6.2%/yrLatest (2025): $1,447 · -1.3% YoY. Source: county tax records.
Cash-flow waterfall
monthlySold comps — $/sqft
last 12 mo · ≤1 miLoading sold comps…