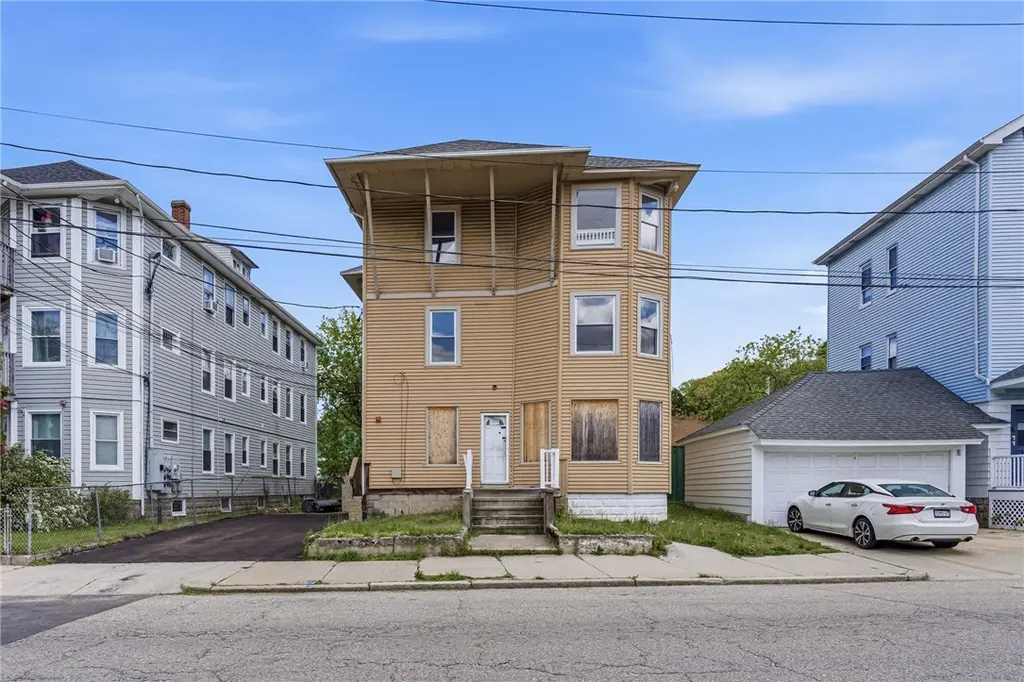
 Fourplex
651 Front St · Woonsocket, RI
Flood risk 1/10 · Minimal
- FEMA flood zone
- X (unshaded)
- Chance of flooding over 30 yrs
- 0.0%
- Est. flood insurance / yr
- $473 – $860
Fire risk 3/10 · Minor
- Est. fire insurance / yr
- $835 – $1,551
Heat risk 5/10 · Moderate
- Hot days now (above 95°F)
- 7 days/yr
- Hot days in 30 yrs
- 16 days/yr
Wind risk 6/10 · Moderate
- Chance of severe wind over 30 yrs
- 63.0%
Air-quality risk 2/10 · Minimal
- Unhealthy air days now
- 1 days/yr
- Unhealthy air days in 30 yrs
- 2 days/yr
Risk factors via First Street. Map © Google.
Why this score? — see what drove the B+ grade
The composite is a weighted blend of 9 inputs, each scored 0–100. Each bar is that input's sub-score; the figure is the points it added to the 100-point composite (weight × sub-score).
- Cash flow +30.0/30.0
- ARV discount +15.0/15.0
- DSCR +10.0/10.0
- 1% rule +9.8/10.0
- Rent growth +4.8/5.0
- Livability +3.2/5.0
- Condition / age +2.5/5.0
- Schools +0.8/10.0
- Appreciation +0.0/10.0
$495,000
🖨 Deal sheet (PDF) 📄 Offer letter ✓ Due diligence
Multi-family units
County records classify this as Multi-Family (5+ Unit). Listing-text estimate: 4 units. estimate disagrees with records
5+ unit building — per-unit beds/baths from public records are typically unavailable; the breakdown below (if shown) is an estimate from the listing text.
Listing remarks
4-family investment opportunity in Woonsocket offering excellent upside potential in a desirable location. Property features four spacious units with strong value-add possibilities for investors or contractors. Needs TLC and updating, including electrical upgrades and replacement of heating systems. Buyers to perform their own due diligence. Off-street parking adds convenience for tenants and guests. Conveniently located near shopping, dining, and everyday essentials. Minutes to Downtown Woonsocket for restaurants, entertainment, and community events. Close to River Island Art Park and World War II Veterans Memorial State Park for outdoor recreation and scenic green space. Easy access to Di
Key facts
- Near dining
- Near shopping
- Off-street parking
Tags
Property features AI
Finance
- Financial info: Property configured as a four-unit multifamily (income property)
Exterior
- Parking: No garage; 2 total off-street parking spaces
- Utilities: Sewer connected; Water connected; Electric with circuit breakers
- Home design: Multi-family building with 1 building containing 4 units; Above-grade finished area approx. 6,844
- Construction: Vinyl siding
- Exterior features: Lot approximately 0.11 acres
Interior
- Kitchen: Gas water heater (equipment listed)
- Bedrooms: Unit mix includes two 4+ bedroom units (one with 5 bedrooms, one with 4 bedrooms) and two 2-bedroom units
- Flooring: Hardwood
- Bathrooms: Total of 5 full bathrooms across the property; Individual units include two units with 2 full bathrooms and two units with 1 full bathroom each
- Heating & cooling: Gas heating; Hot water heating
- Interior features: Hardwood flooring; Full unfinished basement with interior entry
- Laundry & utility: Gas water heater
Neighborhood map
What this means for you Summary
Snapshot
- This is a 4 × 3-bed/1.2-bath units multifamily listed at $495k.
Deal economics
- At list price, monthly cash flow is $3k ($31k/yr) — positive. Per door: $642/mo.
- The deal already cash-flows at list — no discount required.
- Meets the 1% rule at list price ($7k rent vs $495k).
- Cap rate 12.5% vs local median 3.1% in Woonsocket — top-decile yield for the area; either an underpriced asset or a hidden risk that comps aren't pricing in. Stress-test before assuming the spread holds.
Location & tenants
- Location reads 65/100 on livability (#24 in RI) — a middle-class / working-renter tenant base. Strengths: housing A+, health & safety A+, cost of living A; Watch: crime C-, schools D-, amenities F.
- Woonsocket (suburban): math 5% / reading 14% proficiency, ranked #37 of 39 in RI (top 95%) — low school quality limits family demand, transient renter base, plan for 1-2y turnover; 68% free/reduced lunch — lower-income household profile, screen leases tightly.
- Market conditions: Rents rising fast (+9.2%/yr); 165 active listings in the ZIP; 776 units permitted in Providence County in 2024 (229 in 5+ unit buildings).
- At $7,328/mo this rent would consume 144% of the median local household income ($61k/yr) (locally 2658% of renters already pay >50% of income on rent) — very limited rent-growth headroom before tenants either downsize or default.
Forward outlook
- Local home prices are declining (-3.0%/yr); year-one equity from $3k of loan paydown is wiped out by about $15k of value loss. Plan a longer hold.
- Providence County population projected at +5% by 2050 — modest demand growth; plan on rents tracking national, not racing it.
- At projected returns (-3.0% appreciation + 8.0% rent growth), your $139k cash investment doubles in ~5 years — after that, you're playing with house money.
Negotiation context
- Only 8 days on market — expect competitive offers; lowballing is unlikely to land.
- 9 sale attempts since 24y ago with the ask held roughly flat each time — persistent listings suggest the price (not the market) is what's stuck; bring a comps-based counter.
- Current owner paid $190k; list at $495k implies a 161% gain — meaningful room to come down on a strong offer.
Risks & watch-outs
- Watch-outs: built in 1930 — expect roof / HVAC / electrical / plumbing capex.
- Climate carrying-cost: major wind risk, 63% chance of damaging wind over 30y; extreme-heat days projected 7→16/yr by 2055 (HVAC capex compounding) — expect insurance premiums to compound above CPI over the hold.
Questions for the listing agent
- Can we see the unit-by-unit rent roll, current vacancy, and any below-market leases? What's the average tenancy length?
- What capital expenditures (roof, boiler, parking lot, exteriors) have been made in the last 5 years, and what's planned in the next 2?
- Built in 1930 — when were the roof, HVAC, electrical panel, plumbing, and water heater last replaced?
- Is there a deadline driving the sale (1031 exchange, divorce, estate, relocation)? That informs how much negotiation room exists.
- Schools are D-rated, which usually means shorter tenancies and higher turnover. Who's the typical renter profile here, and what's been the actual vacancy rate?
- What's the average days-on-market for RENTAL listings here right now (not sales)? A rising rental-DOM trend means longer vacancies and softer asking-rent achievability than the comps imply.
- What's the recent tenant-quality profile in this submarket — average credit score on applications, eviction rate, late-payment / NSF rate, and stable-employment percentage? A property-management company in the area should have these aggregated.
- How much new apartment / multifamily construction is in the pipeline within 1–3 miles? Heavy new supply (>2% of stock underway) typically softens rents 12–24 months out; light construction supports rent growth.
Investment metrics
- 1% rule
- 1.48% ✓
- Cap rate
- 12.52%
- Cash-on-cash
- 22.25%
- DSCR
- 1.99
- GRM
- 5.6
CMA / ARV
- ARV (median comp)
- $656,261
- List price
- $495,000
- Delta
- -24.57%
- Verdict
- UNDERPRICED
- Comps
- 20 within 1.0 mi
Show comp detail 5 sales within ~0.75 mi
| Address | Dist | Beds/Ba | Sqft | Sold | Price | $/sf | Match |
|---|---|---|---|---|---|---|---|
| 75 South St | 0.26mi | 8/3.0 (-1) | 4,897 (-1%) | 6mo | $594,000 | $121 | 72 |
| 84 86 Northeast St | 0.40mi | 8/4.0 (-1) | 4,969 (+0%) | 15mo | $631,100 | $127 | 64 |
| 494 Grove St | 0.34mi | 8/4.0 (-1) | 4,434 (-11%) | 10mo | $625,000 | $141 | 54 |
| 209 Crawford St | 0.47mi | 10/3.0 (+1) | 4,892 (-1%) | 21mo | $550,000 | $112 | 50 |
| 149 6th Ave | 0.73mi | 9/3.0 | 5,523 (+11%) | 8mo | $615,000 | $111 | 36 |
Match score weights: distance 35% · size 25% · config 20% · recency 20%. Top-matched comps best support the ARV.
Projected returns pro-forma
-3.0% appreciation · 8.0% rent growth · sell at horizon
- IRR
- 20.4%
- Equity multiple
- 1.88×
- Total profit
- $122,179
- Equity at exit
- $73,806
- IRR
- 31.7%
- Equity multiple
- 4.56×
- Total profit
- $493,358
- Equity at exit
- $42,799
Cash invested: $138,600 (down + closing). Projections, not guarantees.
Landlord ↔ Tenant lean methodology
- Overall (STATE)
- 31 Tenant-Leaning
- State Rhode Island
- 31 Tenant-Leaning · D+8
- County
- — inherits STATE
- City
- — inherits STATE
ZIP-level market 02895
- Rents YoY
- 9.2%
- Active inventory
- 165
- Price-to-rent
- 22.5×
Monthly cashflow live
- Estimated rent
- $7,328 high interval (Pro) →
- Mortgage (P&I)
- −$2,596
- Tax from tax record
- −$417 /mo · $5,006/yr
- Insurance
- −$206
- HOA
- −$0
- Vacancy / Maint / Mgmt
- −$1,539
- Net cashflow
- $2,570
Break-even live
Sensitivity live
| Price | -10% $2,850 | -5% $2,710 | +0% $2,570 | +5% $2,430 | +10% $2,290 |
|---|---|---|---|---|---|
| Rent | -10% $1,991 | -5% $2,280 | +0% $2,570 | +5% $2,859 | +10% $3,149 |
| Rate | -1.0pp $2,819 | -0.5pp $2,696 | base $2,570 | +0.5pp $2,442 | +1.0pp $2,311 |
4-unit breakdown (identical units grouped — click to expand)
| Units | Beds | Baths | Est. rent |
|---|---|---|---|
| 4× units | 3 | 1.2 | $7,328 |
| #1 | 3 | 1.2 | $1,832 |
| #2 | 3 | 1.2 | $1,832 |
| #3 | 3 | 1.2 | $1,832 |
| #4 | 3 | 1.2 | $1,832 |
| Total (4 units) | $7,328 | ||
UW: 25.0% down · 7.5% · 30yr · 1.5% tax · 5.0% vac · 8.0% maint · 8.0% mgmt
Financing live
Cash to close
- Down payment
- $123,750
- Closing costs
- $14,850
- Reserves months
- —
- Total cash needed
- —
Loan-product check · same deal, 3 products live
Conventional
25% down · 7.5% · 30yr
- Down + closing
- —
- Monthly P&I
- —
- Monthly cashflow
- —
- DSCR
- —
- Eligible?
- —
Personal DTI + credit; lowest rate.
DSCR
20% down · 8.5% · 30yr
- Down + closing
- —
- Monthly P&I
- —
- Monthly cashflow
- —
- DSCR
- —
- Eligible?
- —
No personal income docs; deal must DSCR.
Hard money
10% down · 12.0% · 12mo
- Down + closing
- —
- Monthly P&I
- —
- Monthly cashflow
- —
- DSCR
- —
- Eligible?
- —
Short-term bridge; refi at stabilization.
Listing history 27 events
-
2026-05-14$495,000 Active 882-char remark
-
2025-10-15historical
-
2025-09-03$539,909 Active
-
2016-11-08price $219,900
-
2015-07-23soldstatus $190,000 Sold
-
2015-07-01status Pending
-
2015-06-10historical Contingent - Soliciting Back-up Offers
-
2015-03-06status Active - Back on Market
-
2015-01-14status Pending
-
2014-07-08$219,900 Active - New
-
2013-12-19price $108,000
-
2013-12-19price $164,900
-
2009-08-10soldstatus $101,000
-
2009-07-15historical
-
2009-01-18$169,900
-
2009-01-16historical
-
2008-09-21$184,900
-
2008-02-23historical
-
2007-09-01$349,900
-
2005-03-15soldstatus $327,500
-
2005-03-14soldstatus $330,000
-
2004-12-30historical
-
2004-12-23$334,711
-
2003-02-03soldstatus $223,500
-
2003-01-31soldstatus $223,500
-
2002-12-06historical
-
2002-11-19$224,900
ⓘ Source: listings_history table (triggers on properties + properties_extension) + one-shot
backfill from property_details.listing_events for pre-trigger history.
Tax reassessment forecast RI · Partial reset (capped growth)
- Current annual tax
- $5,006 · $417/mo
- Projected year-2 tax
- $6,537 · $545/mo
- Expected delta
- +$1,531/yr (+$128/mo · 30.6%)
ⓘ Screening estimate from a state-policy table — verify with the county assessor before closing.
Climate risk First Street
- Flood 1/10 Low FEMA zone X (unshaded) · 0% chance over 30 yrs
- Wildfire 3/10 Moderate
- Heat 5/10 Major 7 d/yr ≥95°F today · 16 d/yr by 30 yrs out
- Wind 6/10 Major 63% chance of damaging wind over 30 yrs
- Air quality 2/10 Low 1 unhealthy d/yr today · 2 by 30 yrs out
Nearby sold comps map
Loading sold comps map…
Walkable amenities ~0.75 mi
Loading nearby amenities…
Taxation est. · year 1
- Rental income
- $87,936
- − Mortgage interest
- −$27,728
- − Property taxes
- −$5,006
- − Insurance
- −$2,475
- − Repairs & maintenance
- −$7,035
- − Management
- −$7,035
- − Depreciation
- −$14,400
- Taxable income
- $24,258
- Est. tax owed @ 24.0%
- −$5,822
- After-tax cash flow
- $25,017/yr
For passive investors: Depreciation is non-cash, so a rental often shows a tax loss while cash-flowing — sheltering income. Rental losses are passive: they offset passive income freely, and up to $25,000/yr can offset ordinary (W-2) income if you actively participate and your MAGI is under $100k (phasing out to $0 by $150k); unused losses carry forward. On sale, claimed depreciation is recaptured at up to 25%, and gains may owe capital-gains tax (a 1031 exchange can defer both). Figures are a year-1 estimate at your 24.0% rate — not tax advice; consult a CPA.
Schools (NCES district)
- District
- Woonsocket
- NCES district ID
- 4401200
- Math proficiency
- 5% ▼ -7.00%
- Reading proficiency
- 14% ▼ -2.00%
- Median HH income
- $37,757
- Composite
- 8.01/100
- National rank
- #9923
- State rank
- #37 of 39 in RI
Livability — Woonsocket
- Score
- 65/100
- State rank
- #24
- US rank
- #12968
Category grades
Schools grade is shown separately in the Schools card above.
Census & demographics
- Census place
- Woonsocket, RI
- County
- Providence County · 548,917 people
- City population
- 43,521
- Metro
- Providence-Warwick, RI-MA
- Population (ZIP)
- 43,521
- Household income
- $61,059
- Rent vs Own
- Severe rent burden
- 2658.0
Population outlook (Providence County) Hauer SSP2
- Today (2025)
- 653,469 people
- By 2030
- 660,819 · +1.1%
- By 2040
- 672,747 · +3.0%
- By 2050
- 683,741 · +4.6%
- By 2075
- 720,435 · +10.2%
- By 2100
- 741,582 · +13.5%
Race, ethnicity, and origin ACS 2023
- Neighborhood character
- Diverse neighborhood (Simpson 0.64)
- Race & ethnicity
- White 54% Hispanic / Latino 26% Two or more races 18% Asian 7% Black 6% Native American 1%
- Hispanic origin (detail)
- Mexican 1% Puerto Rican 15% Dominican 4%
- Common ancestry
- Lithuanian 13% Romanian 3% Russian 3%
- Foreign-born
- 15% · Canada, Jamaica
- Languages at home
- 68% English-only · Spanish 17% Other Asian/Pacific 4% Other Indo-European 4%
Political lean MEDSL · Providence
- 2024 margin
- D (+14.4) · D 56.1% · R 41.7% · Other 2.2%
- 2008→2024 swing
- -20.0pp toward R · 2008: 34.4pp · 2024: 14.4pp
- All cycles
- 2024: D+14.4 2020: D+22.9 2016: D+21.2 2012: D+34.9 2008: D+34.4
Not yet ingested
- Civics
- —
Market trends
- HPI YoY
- ▼ -431.80%
- Current HPI
- 357.8858
- Rent YoY
- ▲ 9.15%
- Metro
- Providence-Warwick, RI-MA
- State GDP YoY
- ▲ 2.25%
- F500 in state
- 10
Industry mix (Fortune 500 HQ in RI)
| Industry | F500 HQs | Revenue |
|---|---|---|
| Healthcare | 1 | $373B |
|
||
| Food Distribution | 1 | $31B |
|
||
| Aerospace / Defense | 1 | $14B |
|
||
| Financial Services | 1 | $8B |
|
||
| Consumer Goods | 1 | $4B |
|
||
Price history
+120.1% since first listed28 events — show timeline
- 2026-05-22 Pending — RIS
- 2026-05-14 Listed $495,000 RIS
- 2025-10-15 Listing Removed — RIS
- 2025-09-03 Listed $539,909 RIS
- 2016-11-08 Price Changed $219,900 RIS
- 2015-07-23 Sold (MLS) $190,000 RIS
- 2015-07-01 Pending — RIS
- 2015-06-10 Contingent — RIS
- 2015-03-06 Relisted — RIS
- 2015-01-14 Pending — RIS
- 2014-07-08 Listed $219,900 RIS
- 2013-12-19 Price Changed $108,000 RIS
- 2013-12-19 Price Changed $164,900 RIS
- 2009-08-10 Sold (MLS) $101,000 RIS
- 2009-07-15 Listing Removed — RIS
- 2009-01-18 Listed $169,900 RIS
- 2009-01-16 Listing Removed — RIS
- 2008-09-21 Listed $184,900 RIS
- 2008-02-23 Listing Removed — RIS
- 2007-09-01 Listed $349,900 RIS
- 2005-03-15 Sold (Public Records) $327,500 Public Records
- 2005-03-14 Sold (MLS) $330,000 RIS
- 2004-12-30 Listing Removed — RIS
- 2004-12-23 Listed $334,711 RIS
- 2003-02-03 Sold (Public Records) $223,500 Public Records
- 2003-01-31 Sold (MLS) $223,500 RIS
- 2002-12-06 Listing Removed — RIS
- 2002-11-19 Listed $224,900 RIS
Property tax history
+1.1%/yrLatest (2025): $5,006 · -10.3% YoY. Source: county tax records.
Cash-flow waterfall
monthlySold comps — $/sqft
last 12 mo · ≤1 miLoading sold comps…