7052 Hoover Ave · Merrydale, LA
Flood risk 1/10 · Minimal
- FEMA flood zone
- X (unshaded)
- Chance of flooding over 30 yrs
- 0.0%
- Est. flood insurance / yr
- $507 – $1,088
Fire risk 1/10 · Minimal
- Est. fire insurance / yr
- $1,269 – $2,357
Heat risk 8/10 · Major
- Hot days now (above 108°F)
- 7 days/yr
- Hot days in 30 yrs
- 20 days/yr
Wind risk 9/10 · Severe
- Chance of severe wind over 30 yrs
- 99.0%
Air-quality risk 3/10 · Minor
- Unhealthy air days now
- 3 days/yr
- Unhealthy air days in 30 yrs
- 4 days/yr
Risk factors via First Street. Map © Google.
Why this score? — see what drove the B+ grade
The composite is a weighted blend of 9 inputs, each scored 0–100. Each bar is that input's sub-score; the figure is the points it added to the 100-point composite (weight × sub-score).
- Cash flow +30.0/30.0
- 1% rule +10.0/10.0
- DSCR +10.0/10.0
- Appreciation +8.0/10.0
- ARV discount +7.5/15.0
- Livability +2.9/5.0
- Rent growth +2.5/5.0
- Condition / age +2.5/5.0
- Schools +2.4/10.0
$34,900
🖨 Deal sheet (PDF) 📄 Offer letter ✓ Due diligence
Listing remarks MLS
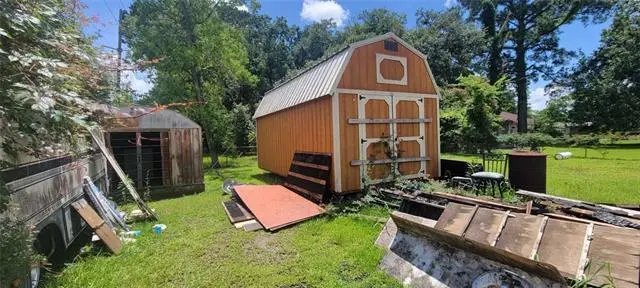
Located at Baton Rouge, this 3 bed 2 bath property offers massive potential. The 1,716 sq ft home features a solid structure that has already been cleanly gutted, saving you time and effort on your next project. Sitting on a spacious lot (up to 1 acre), the property includes a detached 2-car garage. Plus, an under 3-year-old HVAC unit is safely stored offsite and will be included with the sale to complete the climate control. Bring your vision to life and maximize your return on this blank canvas.
Key facts
- Spacious lot
- Cleanly gutted
- Solid structure
Tags
Property features AI
Exterior
- Parking: Two parking spaces
- Utilities: Public water; Septic tank sewer
- Home design: Single-story building
- Construction: Metal siding
- Exterior features: City lot
Interior
- Bathrooms: 2 full bathrooms
- Interior features: Total of 6 rooms; Average condition
Neighborhood map
What this means for you Summary
Snapshot
- This is a 3-bed/2.0-bath single-family listed at $35k.
Deal economics
- At list price, monthly cash flow is $843 ($10k/yr) — positive.
- The deal already cash-flows at list — no discount required.
- Meets the 1% rule at list price ($1k rent vs $35k).
- Recommended offer: $34k (1.5% below list) — sets the bar for market timing.
- Cap rate 35.3% vs local median 7.8% in Merrydale — top-decile yield for the area; either an underpriced asset or a hidden risk that comps aren't pricing in. Stress-test before assuming the spread holds.
Location & tenants
- Location reads 58/100 on livability (#301 in LA) — a working-class tenant base; expect higher turnover. Strengths: cost of living A+, housing A; Watch: crime F, amenities F, commute F.
- East Baton Rouge Parish (urban): math 22% / reading 34% proficiency, ranked #47 of 98 in LA (top 48%) — low school quality limits family demand, transient renter base, plan for 1-2y turnover; 77% free/reduced lunch — lower-income household profile, screen leases tightly.
- Zoned schools: Merrydale Elementary School (math 8% / reading 12%, grade F, #597 of 646 statewide, top 95%, 274 students, 95% FRL); Liberty High School (math 50% / reading 74%, grade B-, #15 of 265 statewide, top 6%, 1,208 students, 60% FRL) — zoned schools at 78% FRL track the district average.
- Market conditions: 39 active listings in the ZIP; 13 comparable units currently listed for rent nearby; rentals at typical pace (median 25d on market — plan ~3-4 weeks tenant-placement turnaround); 2,252 units permitted in East Baton Rouge Parish in 2024 (440 in 5+ unit buildings).
Forward outlook
- In year one you build about $2k of equity ($241 loan paydown + $2k appreciation (5.9% local appreciation)).
- East Baton Rouge County population projected at +4% by 2050 — modest demand growth; plan on rents tracking national, not racing it.
- At projected returns (5.9% appreciation + 3.0% rent growth), your $10k cash investment doubles in ~1 year — after that, you're playing with house money.
Negotiation context
- It's been on market 19 days — a 2% lower offer ($34k) is reasonable based on typical stale-listing flexibility.
- 2 sale attempts; this cycle's ask has dropped $15k (30%) from the opening price — seller is motivated, your offer sets the floor, not the list.
Risks & watch-outs
- Climate carrying-cost: severe wind risk, 99% chance of damaging wind over 30y; extreme-heat days projected 7→20/yr by 2055 (HVAC capex compounding) — expect insurance premiums to compound above CPI over the hold.
Questions for the listing agent
- Built in 1965 — when were the roof, HVAC, electrical panel, plumbing, and water heater last replaced?
- Is there a deadline driving the sale (1031 exchange, divorce, estate, relocation)? That informs how much negotiation room exists.
- Crime grade is F in this area — have there been break-ins, vandalism, or insurance claims at this property in the last 3 years? What carrier currently insures it and at what premium?
- What's the average days-on-market for RENTAL listings here right now (not sales)? A rising rental-DOM trend means longer vacancies and softer asking-rent achievability than the comps imply.
- What's the recent tenant-quality profile in this submarket — average credit score on applications, eviction rate, late-payment / NSF rate, and stable-employment percentage? A property-management company in the area should have these aggregated.
- How much new for-sale + rental construction is in the pipeline within 1–3 miles? Heavy new supply typically softens prices + rents 12–24 months out; constrained supply supports both.
Investment metrics
- 1% rule
- 3.93% ✓
- Cap rate
- 35.27%
- Cash-on-cash
- 103.50%
- DSCR
- 5.61
- GRM
- 2.1
CMA / ARV
- ARV (on-the-fly)
- $190,476
- Comps found
- 12
Show comp detail 12 sales within ~0.75 mi
| Address | Dist | Beds/Ba | Sqft | Sold | Price | $/sf | Match |
|---|---|---|---|---|---|---|---|
| 5960 W Fairlane Ct | 0.22mi | 3/2.0 | 1,700 (-1%) | 10mo | $195,000 | $115 | 79 |
| 6932 Maplewood Dr | 0.33mi | 3/2.0 | 1,726 (+1%) | 10mo | $179,900 | $104 | 76 |
| 5555 Silverleaf Ave | 0.36mi | 4/2.0 (+1) | 1,663 (-3%) | 6mo | $185,000 | $111 | 68 |
| 5233 Satinwood Dr | 0.43mi | 3/1.0 | 1,610 (-6%) | 4mo | $130,000 | $81 | 62 |
| 5575 Silverleaf Ave | 0.36mi | 4/2.0 (+1) | 1,530 (-11%) | 3mo | $170,000 | $111 | 58 |
| 5763 Grand Dr | 0.57mi | 3/2.0 | 1,614 (-6%) | 11mo | $219,000 | $136 | 54 |
| 6214 Buckeye Dr | 0.59mi | 3/2.0 | 1,792 (+4%) | 16mo | $96,000 | $54 | 52 |
| 6411 Landis Dr | 0.48mi | 3/1.5 | 1,508 (-12%) | 5mo | $79,900 | $53 | 52 |
| 6424 Glen Oaks Dr | 0.73mi | 3/2.0 | 1,680 (-2%) | 14mo | $198,500 | $118 | 51 |
| 5808 E Grand Ct | 0.47mi | 3/2.0 | 1,501 (-12%) | 11mo | $167,900 | $112 | 48 |
| 5125 E Brookstown Dr | 0.70mi | 4/2.0 (+1) | 1,758 (+2%) | 18mo | $110,000 | $63 | 43 |
| 7822 Phebus Dr | 0.63mi | 4/2.0 (+1) | 1,524 (-11%) | 14mo | $169,000 | $111 | 35 |
Match score weights: distance 35% · size 25% · config 20% · recency 20%. Top-matched comps best support the ARV.
Projected returns pro-forma
5.93% appreciation · 3.0% rent growth · sell at horizon
- IRR
- —
- Equity multiple
- 7.51×
- Total profit
- $63,631
- Equity at exit
- $21,785
- IRR
- —
- Equity multiple
- 15.86×
- Total profit
- $145,215
- Equity at exit
- $39,374
Cash invested: $9,772 (down + closing). Projections, not guarantees.
Landlord ↔ Tenant lean methodology
- Overall (STATE)
- 90 Strongly Landlord-Friendly
- State Louisiana
- 90 Strongly Landlord-Friendly · R+12
- County
- — inherits STATE
- City
- — inherits STATE
ZIP-level market 70812
- Home prices YoY
- 3.5%
- Active inventory
- 39
- Price-to-rent
- 2.1×
Monthly cashflow live
- Estimated rent
- $1,372 high interval (Pro) →
- Mortgage (P&I)
- −$183
- Tax est. 1.5%
- −$44 /mo · $524/yr
- Insurance
- −$15
- HOA
- −$0
- Vacancy / Maint / Mgmt
- −$288
- Net cashflow
- $843
Break-even live
Sensitivity live
| Price | -10% $867 | -5% $855 | +0% $843 | +5% $831 | +10% $819 |
|---|---|---|---|---|---|
| Rent | -10% $734 | -5% $789 | +0% $843 | +5% $897 | +10% $951 |
| Rate | -1.0pp $860 | -0.5pp $852 | base $843 | +0.5pp $834 | +1.0pp $825 |
UW: 25.0% down · 7.5% · 30yr · 1.5% tax · 5.0% vac · 8.0% maint · 8.0% mgmt
Financing live
Cash to close
- Down payment
- $8,725
- Closing costs
- $1,047
- Reserves months
- —
- Total cash needed
- —
Loan-product check · same deal, 3 products live
Conventional
25% down · 7.5% · 30yr
- Down + closing
- —
- Monthly P&I
- —
- Monthly cashflow
- —
- DSCR
- —
- Eligible?
- —
Personal DTI + credit; lowest rate.
DSCR
20% down · 8.5% · 30yr
- Down + closing
- —
- Monthly P&I
- —
- Monthly cashflow
- —
- DSCR
- —
- Eligible?
- —
No personal income docs; deal must DSCR.
Hard money
10% down · 12.0% · 12mo
- Down + closing
- —
- Monthly P&I
- —
- Monthly cashflow
- —
- DSCR
- —
- Eligible?
- —
Short-term bridge; refi at stabilization.
Rent comps 13 comps
| Address | Beds | Baths | Sqft | Rent | $/sqft | DOM | Units | Dist |
|---|---|---|---|---|---|---|---|---|
| 5255 Astoria Dr Baton Rouge, LA | 3.0 | 2.0 | 1463 | $1,295 | $0.89 | 45d | 1 | 0.34mi |
| 7745 S Maribel Ct Baton Rouge, LA | 3.0 | 2.0 | 1682 | $1,500 | $0.89 | 23d | 1 | 0.99mi |
| 7745 S Maribel Ct Baton Rouge, LA | 3.0 | 2.0 | 1682 | $1,500 | $0.89 | 46d | 1 | 0.99mi |
| 5315 McClelland Dr Baton Rouge, LA | 3.0 | 2.0 | 1369 | $1,000 | $0.73 | 25d | 1 | 1.04mi |
| 5423 Banyan Trace Dr Baton Rouge, LA | 4.0 | 2.0 | 1469 | $1,300 | $0.88 | 25d | 1 | 1.08mi |
| 5553 Banyan Ct Baton Rouge, LA | 4.0 | 2.0 | 1459 | $1,350 | $0.93 | 25d | 1 | 1.12mi |
| 8614 Forestwood Ave Baton Rouge, LA | 3.0 | 2.0 | 1313 | $1,700 | $1.29 | 16d | 1 | 1.23mi |
| 5115 Woodlawn Ave Baton Rouge, LA | 4.0 | 2.0 | 1789 | $1,550 | $0.87 | 16d | 1 | 1.23mi |
| 5540 Clayton Ct Baton Rouge, LA | 4.0 | 2.0 | 1500 | $1,350 | $0.90 | 21d | 1 | 1.25mi |
| 5350 Clayton Dr Baton Rouge, LA | 3.0 | 1.0 | 1050 | $850 | $0.81 | 45d | 1 | 1.32mi |
| 4963 Greenwell St Baton Rouge, LA | 3.0 | 2.0 | 1400 | $1,500 | $1.07 | 25d | 1 | 1.35mi |
| 5515 Paige St Baton Rouge, LA | 3.0 | 3.0 | 1238 | $1,400 | $1.13 | 16d | 1 | 1.40mi |
| 9173 Cedar Ct Baton Rouge, LA | 4.0 | 2.0 | 1405 | $1,596 | $1.14 | 16d | 1 | 1.47mi |
Listing history 13 events
-
2026-06-22days on market $34,900 Active 19 DOM
-
2026-06-18days on market $34,900 Active 16 DOM
-
2026-06-17days on market $34,900 Active 15 DOM
-
2026-06-16pricedays on market $34,900 Active 14 DOM
-
2026-06-15days on market $39,900 Active 13 DOM
-
2026-06-14days on market $39,900 Active 11 DOM
-
2026-06-10pricedays on market $39,900 Active 8 DOM
-
2026-06-09days on market $49,900 Active 7 DOM
-
2026-06-08days on market $49,900 Active 6 DOM
-
2026-06-07days on market $49,900 Active 5 DOM
-
2026-06-05days on market $49,900 Active 2 DOM
-
2026-06-03remarks 502-char remark
-
2026-06-03$49,900 Active 1 DOM
ⓘ Source: listings_history table (triggers on properties + properties_extension) + one-shot
backfill from property_details.listing_events for pre-trigger history.
Climate risk First Street
- Flood 1/10 Low FEMA zone X (unshaded) · 0% chance over 30 yrs
- Wildfire 1/10 Low
- Heat 8/10 Severe 7 d/yr ≥108°F today · 20 d/yr by 30 yrs out
- Wind 9/10 Extreme 99% chance of damaging wind over 30 yrs
- Air quality 3/10 Moderate 3 unhealthy d/yr today · 4 by 30 yrs out
Nearby sold comps map
Loading sold comps map…
Walkable amenities ~0.75 mi
Loading nearby amenities…
Taxation est. · year 1
- Rental income
- $16,466
- − Mortgage interest
- −$1,955
- − Property taxes
- −$524
- − Insurance
- −$174
- − Repairs & maintenance
- −$1,317
- − Management
- −$1,317
- − Depreciation
- −$1,015
- Taxable income
- $10,163
- Est. tax owed @ 24.0%
- −$2,439
- After-tax cash flow
- $7,675/yr
For passive investors: Depreciation is non-cash, so a rental often shows a tax loss while cash-flowing — sheltering income. Rental losses are passive: they offset passive income freely, and up to $25,000/yr can offset ordinary (W-2) income if you actively participate and your MAGI is under $100k (phasing out to $0 by $150k); unused losses carry forward. On sale, claimed depreciation is recaptured at up to 25%, and gains may owe capital-gains tax (a 1031 exchange can defer both). Figures are a year-1 estimate at your 24.0% rate — not tax advice; consult a CPA.
Schools (NCES district)
- District
- East Baton Rouge Parish
- NCES district ID
- 2200540
- Math proficiency
- 22% ▼ -36.00%
- Reading proficiency
- 34% ▼ -31.00%
- Median HH income
- $46,263
- Composite
- 24.14/100
- National rank
- #7745
- State rank
- #47 of 98 in LA
Livability — Merrydale
- Score
- 58/100
- State rank
- #301
- US rank
- #21115
Category grades
Schools grade is shown separately in the Schools card above.
Census & demographics
- Census place
- Merrydale, LA
- City population
- 11,124
- Population (ZIP)
- 11,124
Population outlook (East Baton Rouge County) Hauer SSP2
- Today (2025)
- 464,810 people
- By 2030
- 472,137 · +1.6%
- By 2040
- 480,243 · +3.3%
- By 2050
- 484,422 · +4.2%
- By 2075
- 492,069 · +5.9%
- By 2100
- 476,347 · +2.5%
Race, ethnicity, and origin ACS 2023
- Neighborhood character
- Predominantly Black (97%)
- Race & ethnicity
- Black 97% Hispanic / Latino 2% White 1%
- Foreign-born
- 1% · Canada
- Languages at home
- 99% English-only · Spanish 1%
Political lean MEDSL · East Baton Rouge
- 2024 margin
- D (+11.1) · D 54.5% · R 43.4% · Other 2.1%
- 2008→2024 swing
- +8.9pp toward D · 2008: 2.2pp · 2024: 11.1pp
- All cycles
- 2024: D+11.1 2020: D+13.1 2016: D+9.2 2012: D+5.2 2008: D+2.2
Not yet ingested
- Civics
- —
Market trends
- HPI YoY
- ▲ 5.93%
- Current HPI
- 174.6882
- Rent YoY
- —
- Metro
- —
- State GDP YoY
- ▲ 3.29%
- F500 in state
- 10
Industry mix (Fortune 500 HQ in LA)
| Industry | F500 HQs | Revenue |
|---|---|---|
| Telecommunications | 2 | $23B |
|
||
| Utilities | 1 | $12B |
|
||
| Wholesale / Distribution | 1 | $5B |
|
||
| Advertising | 1 | $2B |
|
||
Price history
+0.0% since first listed3 events — show timeline
- 2026-06-02 Listed $49,900 AcadianaMLS
- 2026-06-02 Listed $49,900 GSREIN
- 1999-06-11 Sold (Public Records) — Public Records
Property tax history
+30.1%/yrLatest (2025): $1,896 · -0.4% YoY. Source: county tax records.
Cash-flow waterfall
monthlySold comps — $/sqft
last 12 mo · ≤1 miLoading sold comps…