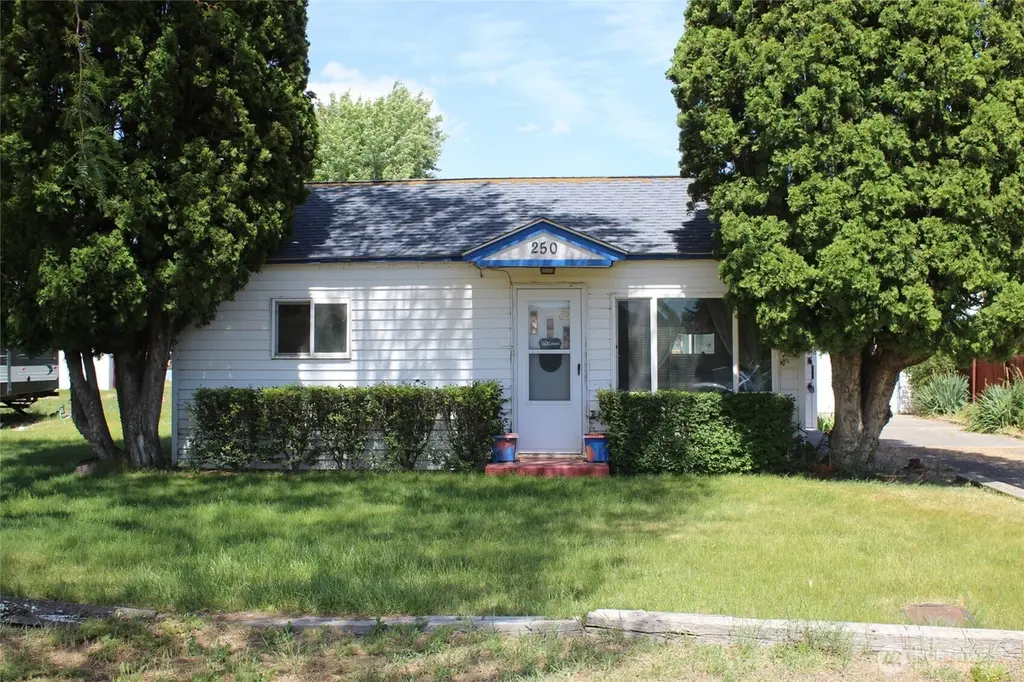
250 W May Ave · Washtucna, WA
Flood risk No data
- FEMA flood zone
- —
- Chance of flooding over 30 yrs
- —
- Est. flood insurance / yr
- —
Fire risk No data
- Est. fire insurance / yr
- —
Heat risk No data
- Hot days now (above threshold)
- —
- Hot days in 30 yrs
- —
Wind risk No data
- Chance of severe wind over 30 yrs
- —
Air-quality risk No data
- Unhealthy air days now
- —
- Unhealthy air days in 30 yrs
- —
Risk factors via First Street. Map © Google.
Why this score? — see what drove the B grade
The composite is a weighted blend of 9 inputs, each scored 0–100. Each bar is that input's sub-score; the figure is the points it added to the 100-point composite (weight × sub-score).
- Cash flow +30.0/30.0
- 1% rule +10.0/10.0
- DSCR +10.0/10.0
- ARV discount +7.5/15.0
- Appreciation +5.0/10.0
- Schools +3.3/10.0
- Livability +3.1/5.0
- Rent growth +2.5/5.0
- Condition / age +2.2/5.0
$95,000
🖨 Deal sheet 📄 Offer letter ✓ Due diligence
Listing remarks
2 bed 1 bath home on a large lot in the quiet town of Washtucna. Close to the Snake River. Close to the city park. RV Sewer dump on property
Key facts
- Close to city park
- Rv sewer dump
- Large lot
Tags
Property features AI
Finance
- Other: County listed square footage: 714 (living area/building area); Lot size approximately 0.5739 acres; Level topography
- Financial info: Listing terms: Cash or Conventional
Exterior
- Parking: Detached garage (1 covered space); RV parking; Paved site/drive
- Utilities: Public water (City of Washtucna); Sewer connected (City of Washtucna); Power by Avista
- Home design: Single-family residence, one story; Built on lot; Good condition; R-1 zoning
- Construction: Metal/vinyl construction materials; Composition roof; Block foundation; Structure type: House; One level
- Exterior features: Metal/vinyl exterior; Garden space
Interior
- Kitchen: Includes refrigerator and stove/range
- Bedrooms: 2 bedrooms (both on the main level)
- Flooring: Vinyl flooring; Carpet
- Bathrooms: 1 full bathroom (on the main level)
- Heating & cooling: Baseboard heating; Window unit(s) for cooling; Electric energy source
- Interior features: Refrigerator; Stove/Range; Vinyl and carpet flooring
Neighborhood map
What this means for you Summary
Snapshot
- This is a 2-bed/1.0-bath single-family listed at $95k. Condition is rated fair.
Deal economics
- At list price, monthly cash flow is $528 ($6k/yr) — positive.
- The deal already cash-flows at list — no discount required.
- Meets the 1% rule at list price ($2k rent vs $95k).
Location & tenants
- Location reads 62/100 on livability (#426 in WA) — a middle-class / working-renter tenant base. Strengths: cost of living A+, housing A-; Watch: health & safety C-, schools D, crime F.
- Washtucna School District (rural): math 20% / reading 50% proficiency, ranked #249 of 291 in WA (top 86%) — families likely to look elsewhere, expect single-tenant / working-renter base with shorter leases.
- Market conditions: 7 active listings in the ZIP; 1 comparable units currently listed for rent nearby; 49 units permitted in Adams County in 2024 (0 in 5+ unit buildings).
Forward outlook
- In year one you build about $4k of equity ($657 loan paydown + $3k appreciation (3.0% local appreciation)).
- Adams County population projected at +8% by 2050 — modest demand growth; plan on rents tracking national, not racing it.
- At projected returns (3.0% appreciation + 3.0% rent growth), your $27k cash investment doubles in ~3 years — after that, you're playing with house money.
- By year 10, paydown + projected appreciation supports a ~$34k cash-out refi (75% LTV) — recoverable capital for the next deal without selling this one.
Negotiation context
- Only 13 days on market — expect competitive offers; lowballing is unlikely to land.
Risks & watch-outs
- Watch-outs: built in 1930 — expect roof / HVAC / electrical / plumbing capex.
Questions for the listing agent
- Have any recent inspections been done? Can we get a copy of the seller's disclosures and any deferred-maintenance estimates?
- Built in 1930 — when were the roof, HVAC, electrical panel, plumbing, and water heater last replaced?
- Is there a deadline driving the sale (1031 exchange, divorce, estate, relocation)? That informs how much negotiation room exists.
- Schools are D-rated, which usually means shorter tenancies and higher turnover. Who's the typical renter profile here, and what's been the actual vacancy rate?
- Crime grade is F in this area — have there been break-ins, vandalism, or insurance claims at this property in the last 3 years? What carrier currently insures it and at what premium?
- What's the average days-on-market for RENTAL listings here right now (not sales)? A rising rental-DOM trend means longer vacancies and softer asking-rent achievability than the comps imply.
- What's the recent tenant-quality profile in this submarket — average credit score on applications, eviction rate, late-payment / NSF rate, and stable-employment percentage? A property-management company in the area should have these aggregated.
- How much new for-sale + rental construction is in the pipeline within 1–3 miles? Heavy new supply typically softens prices + rents 12–24 months out; constrained supply supports both.
Investment metrics
- 1% rule
- 1.58% ✓
- Cap rate
- 12.97%
- Cash-on-cash
- 23.84%
- DSCR
- 2.06
- GRM
- 5.3
CMA / ARV
No comps found within radius.
Projected returns pro-forma
3.0% appreciation · 3.0% rent growth · sell at horizon
- IRR
- 30.0%
- Equity multiple
- 2.70×
- Total profit
- $45,126
- Equity at exit
- $42,716
- IRR
- 30.4%
- Equity multiple
- 5.27×
- Total profit
- $113,517
- Equity at exit
- $65,831
Cash invested: $26,600 (down + closing). Projections, not guarantees.
Landlord ↔ Tenant lean methodology
- Overall (STATE)
- 28 Tenant-Leaning
- State Washington
- 28 Tenant-Leaning · D+8
- County
- — inherits STATE
- City
- — inherits STATE
ZIP-level market 99371
- Active inventory
- 7
- Price-to-rent
- 5.3×
Monthly cashflow live
- Estimated rent
- $1,500 medium interval (Pro) →
- Mortgage (P&I)
- −$498
- Tax est. 1.5%
- −$119 /mo · $1,425/yr
- Insurance
- −$40
- HOA
- −$0
- Vacancy / Maint / Mgmt
- −$315
- Net cashflow
- $528
Break-even live
UW: 25.0% down · 7.5% · 30yr · 1.5% tax · 5.0% vac · 8.0% maint · 8.0% mgmt
Financing live
Cash to close
- Down payment
- $23,750
- Closing costs
- $2,850
- Reserves months
- —
- Total cash needed
- —
Loan-product check · same deal, 3 products live
Conventional
25% down · 7.5% · 30yr
- Down + closing
- —
- Monthly P&I
- —
- Monthly cashflow
- —
- DSCR
- —
- Eligible?
- —
Personal DTI + credit; lowest rate.
DSCR
20% down · 8.5% · 30yr
- Down + closing
- —
- Monthly P&I
- —
- Monthly cashflow
- —
- DSCR
- —
- Eligible?
- —
No personal income docs; deal must DSCR.
Hard money
10% down · 12.0% · 12mo
- Down + closing
- —
- Monthly P&I
- —
- Monthly cashflow
- —
- DSCR
- —
- Eligible?
- —
Short-term bridge; refi at stabilization.
Rent comps 1 comps
| Address | Beds | Baths | Sqft | Rent | $/sqft | DOM | Units | Dist |
|---|---|---|---|---|---|---|---|---|
| 115 N Main St Washtucna, WA | 3.0 | 1.0 | 720 | $1,500 | $2.08 | 21d | 1 | 0.13mi |
Listing history 11 events
-
2026-06-18days on market $95,000 Active 13 DOM
-
2026-06-17days on market $95,000 Active 12 DOM
-
2026-06-16days on market $95,000 Active 11 DOM
-
2026-06-15days on market $95,000 Active 10 DOM
-
2026-06-15days on market $95,000 Active 9 DOM
-
2026-06-13days on market $95,000 Active 8 DOM
-
2026-06-12days on market $95,000 Active 7 DOM
-
2026-06-09days on market $95,000 Active 4 DOM
-
2026-06-08days on market $95,000 Active 3 DOM
-
2026-06-08remarks 140-char remark
-
2026-06-08$95,000 Active 2 DOM
ⓘ Source: listings_history table (triggers on properties + properties_extension) + one-shot
backfill from property_details.listing_events for pre-trigger history.
Nearby sold comps map
Loading sold comps map…
Walkable amenities ~0.75 mi
Loading nearby amenities…
Taxation est. · year 1
- Rental income
- $18,000
- − Mortgage interest
- −$5,321
- − Property taxes
- −$1,425
- − Insurance
- −$475
- − Repairs & maintenance
- −$1,440
- − Management
- −$1,440
- − Depreciation
- −$2,764
- Taxable income
- $5,135
- Est. tax owed @ 24.0%
- −$1,232
- After-tax cash flow
- $5,109/yr
For passive investors: Depreciation is non-cash, so a rental often shows a tax loss while cash-flowing — sheltering income. Rental losses are passive: they offset passive income freely, and up to $25,000/yr can offset ordinary (W-2) income if you actively participate and your MAGI is under $100k (phasing out to $0 by $150k); unused losses carry forward. On sale, claimed depreciation is recaptured at up to 25%, and gains may owe capital-gains tax (a 1031 exchange can defer both). Figures are a year-1 estimate at your 24.0% rate — not tax advice; consult a CPA.
Condition & rehab AI · 13 photos
This home requires moderate renovations to improve its condition and increase its value. Key areas for improvement include the kitchen, bathroom, flooring, and interior walls. Upgrading these areas would significantly enhance its resale and rental value.
Repairs flagged
- Major kitchen cabinets — severely dated and in poor condition
- Major bathroom fixtures — dated and in poor condition
- Major flooring — damaged and uneven
- Major interior walls — peeling paint and damaged drywall
Value-add opportunities
- Resale new kitchen cabinets and appliances — modernizing the kitchen would significantly increase its appeal
- Resale new bathroom fixtures and tile — updating the bathroom would enhance its functionality and appeal
- Both new flooring — new flooring would improve the home's appearance and functionality
- Both paint and repairs to interior walls — painting and repairing the walls would improve the home's appearance and functionality
- Both landscaping and curb appeal — improving the landscaping and curb appeal would enhance the home's overall appearance and appeal
Renovation cost estimate screening
| Repair item | Severity | Est. cost |
|---|---|---|
| kitchen cabinets · severely dated and in poor condition | Major | $15,000–50,000 |
| bathroom fixtures · dated and in poor condition | Major | $15,000–50,000 |
| flooring · damaged and uneven | Major | $15,000–50,000 |
| interior walls · peeling paint and damaged drywall | Major | $15,000–50,000 |
| Total estimated repair cost · 4 items | $60,000–200,000 |
Value-add ROI direction
- Resale new kitchen cabinets and appliances — modernizing the kitchen would significantly increase its appeal ↑
- Resale new bathroom fixtures and tile — updating the bathroom would enhance its functionality and appeal ↑
- Both new flooring — new flooring would improve the home's appearance and functionality ↑
- Both paint and repairs to interior walls — painting and repairing the walls would improve the home's appearance and functionality ↑
- Both landscaping and curb appeal — improving the landscaping and curb appeal would enhance the home's overall appearance and appeal ↑
ⓘ Cost ranges are severity-bucket heuristics (US national rule-of-thumb). Get contractor quotes + a written scope before underwriting a rehab budget.
Schools (NCES district)
- District
- Washtucna School District
- NCES district ID
- 5309570
- Math proficiency
- 20% ▼ -1.00%
- Reading proficiency
- 50% ▲ 10.00%
- Median HH income
- $47,732
- Composite
- 32.7/100
- National rank
- #10783
- State rank
- #249 of 291 in WA
Livability — Washtucna
- Score
- 62/100
- State rank
- #426
- US rank
- #16995
Category grades
Schools grade is shown separately in the Schools card above.
Census & demographics
- Census place
- Washtucna, WA
- Population (ZIP)
- 332
Population outlook (Adams County) Hauer SSP2
- Today (2025)
- 19,554 people
- By 2030
- 19,746 · +1.0%
- By 2040
- 20,362 · +4.1%
- By 2050
- 21,026 · +7.5%
- By 2075
- 22,272 · +13.9%
- By 2100
- 22,737 · +16.3%
Race, ethnicity, and origin ACS 2023
- Neighborhood character
- Predominantly White (89%)
- Race & ethnicity
- White 89% Hispanic / Latino 6% Two or more races 5% Native American 3%
- Hispanic origin (detail)
- Mexican 6%
- Common ancestry
- Portuguese 10% Italian 6% Serbian 5%
- Foreign-born
- 0%
- Languages at home
- 96% English-only · Spanish 4%
Political lean MEDSL · Adams
- 2024 margin
- Solid R (+43.3) · D 27.2% · R 70.5% · Other 2.3%
- 2008→2024 swing
- -8.9pp toward R · 2008: -34.4pp · 2024: -43.3pp
- All cycles
- 2024: R+43.3 2020: R+35.7 2016: R+39.7 2012: R+33.9 2008: R+34.4
Not yet ingested
- Civics
- —
Market trends
- HPI YoY
- —
- Current HPI
- —
- Rent YoY
- —
- Metro
- —
- State GDP YoY
- ▲ 4.65%
- F500 in state
- 22
Industry mix (Fortune 500 HQ in WA)
| Industry | F500 HQs | Revenue |
|---|---|---|
| Retail | 2 | $269B |
|
||
| Technology / Retail | 1 | $638B |
|
||
| Technology | 1 | $245B |
|
||
| Telecommunications | 1 | $38B |
|
||
| Food / Beverage | 1 | $36B |
|
||
| Automotive / Trucks | 1 | $34B |
|
||
Price history
1 event — show timeline
- 2026-06-05 Listed $95,000 NWMLS as Distributed by MLS Grid
Cash-flow waterfall
monthlySold comps — $/sqft
last 12 mo · ≤1 miLoading sold comps…