3015 Meadowview Dr · Missouri City, TX
Flood risk 1/10 · Minimal
- FEMA flood zone
- X (unshaded)
- Chance of flooding over 30 yrs
- 0.0%
- Est. flood insurance / yr
- $507 – $1,088
Fire risk 2/10 · Minimal
- Est. fire insurance / yr
- $1,222 – $2,270
Heat risk 9/10 · Severe
- Hot days now (above 110°F)
- 7 days/yr
- Hot days in 30 yrs
- 23 days/yr
Wind risk 9/10 · Severe
- Chance of severe wind over 30 yrs
- 99.0%
Air-quality risk 3/10 · Minor
- Unhealthy air days now
- 2 days/yr
- Unhealthy air days in 30 yrs
- 3 days/yr
Risk factors via First Street. Map © Google.
Why this score? — see what drove the D+ grade
The composite is a weighted blend of 9 inputs, each scored 0–100. Each bar is that input's sub-score; the figure is the points it added to the 100-point composite (weight × sub-score).
- ARV discount +11.0/15.0
- Cash flow +10.9/30.0
- Schools +4.5/10.0
- Appreciation +4.2/10.0
- 1% rule +3.6/10.0
- Livability +3.4/5.0
- DSCR +3.2/10.0
- Rent growth +2.5/5.0
- Condition / age +2.5/5.0
$294,257
🖨 Deal sheet (PDF) 📄 Offer letter ✓ Due diligence
Listing remarks
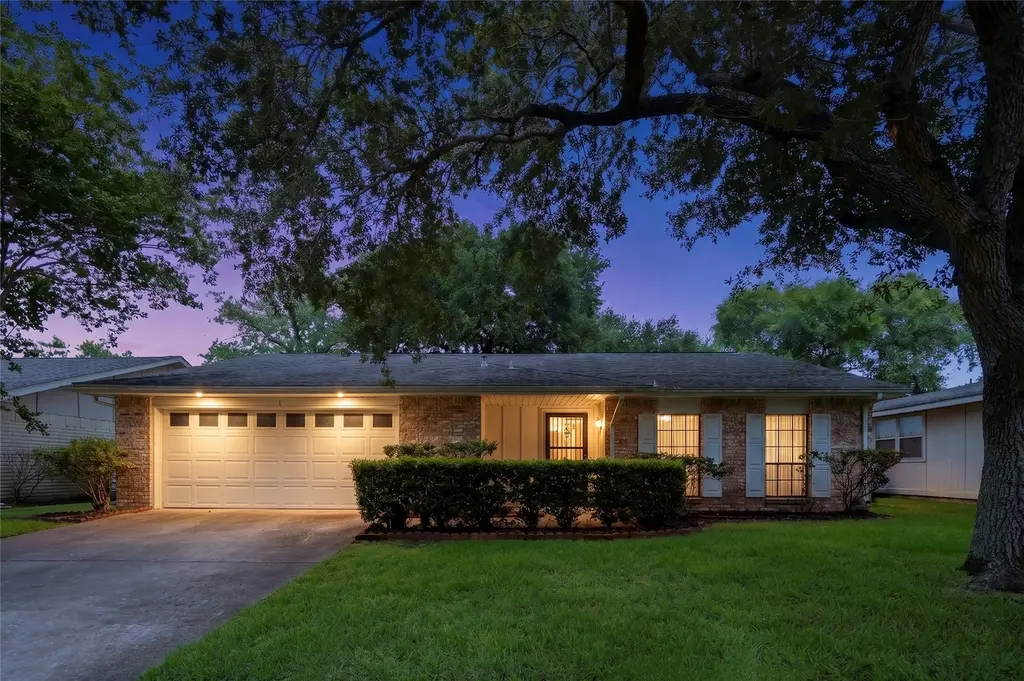
Single-story brick home in an established Missouri City neighborhood offers a layout built for real life. The step-down living room flows to a formal dining area beneath a chandelier and exposed beam. A built-in wet bar with stone accents and wine rack sets the tone for entertaining. The kitchen features warm wood cabinetry, stainless appliances, and a breakfast nook that opens to the family room. A brick fireplace anchors the family room; French doors lead to a pergola-covered backyard with mature shade trees. Primary suite includes a walk-in closet and updated en-suite bath. Community pool. Minutes to major employers, top-rated FBISD schools, and Hwy 6. This one checks every box. AC -2018
Key facts
- Brick fireplace
- Walk-in closet
- Built-in wet bar
Tags
Property features AI
Finance
- HOA & community: Association: Quail Valley East CA / Randall Mgmt; Annual association fee of $147; Community pool
Exterior
- Parking: Attached garage with 2 parking spaces
- Utilities: Public water; Public sewer
- Home design: Residential property; Built in 1976; Slab foundation; Shingle and wood roof
- Construction: Brick and wood siding construction
- Exterior features: Deck; Patio; Private, fully fenced yard; Back yard fencing; Subdivision lot
Interior
- Kitchen: Dishwasher; Electric oven; Electric range; Microwave; Trash compactor; Refrigerator
- Bedrooms: Primary bedroom (First floor) — 16 x 13; Bedroom (First floor) — 13 x 10; Bedroom (First floor) — 11 x 10; Bedroom (First floor) — 10 x 10
- Flooring: Carpet; Tile
- Bathrooms: 2 full bathrooms; 1 half bathroom
- Heating & cooling: Central heating (electric); Central air conditioning (electric)
- Interior features: Wet bar; Kitchen and family room combo; Primary bathroom with soaking tub and separate shower; Tub/shower; Ceiling fans; Wood-burning fireplace (1)
- Laundry & utility: Washer and dryer included; Washer hookup; Electric dryer hookup; Utility room (First floor) — 7 x 6
Neighborhood map
What this means for you Summary
Snapshot
- This is a 4-bed/2.0-bath single-family listed at $294k.
Deal economics
- At list price, monthly cash flow is $-130 ($-2k/yr) — negative.
- To cash-flow at today's rent, offer at most $271k (7.8% below list).
- To meet the 1% rule (rent ≥ 1% of price), the offer needs to be $252k (14.4% below list).
- Recommended offer: $252k (14.4% below list) — sets the bar for 1% rule.
- Cap rate 5.8% vs local median 3.6% in Missouri City — top-decile yield for the area; either an underpriced asset or a hidden risk that comps aren't pricing in. Stress-test before assuming the spread holds.
Location & tenants
- Location reads 67/100 on livability (#526 in TX) — a middle-class / working-renter tenant base. Strengths: housing A+, crime A, employment A; Watch: amenities F, commute F, health & safety F.
- Fort Bend ISD (suburban): math 44% / reading 53% proficiency, ranked #140 of 826 in TX (top 17%) — families likely to look elsewhere, expect single-tenant / working-renter base with shorter leases.
- Zoned schools: Lantern Lane El (math 17% / reading 37%, grade F, #2,791 of 4,322 statewide, top 68%, 472 students, 77% FRL); Quail Valley Middle (math 55% / reading 57%, grade B-, #234 of 1,662 statewide, top 14%, 1,043 students, 45% FRL); Fort Bend Co Alter (26 students, 0% FRL).
- Market conditions: Rents soft (-0.1%/yr); 1229 active listings in the ZIP; 15 comparable units currently listed for rent nearby; rentals at typical pace (median 24d on market — plan ~3-4 weeks tenant-placement turnaround); 40% of comp listings sitting > 30 days — soft ceiling on asking rent; high-income renter base; 12,093 units permitted in Fort Bend County in 2024 (815 in 5+ unit buildings).
Forward outlook
- Local home prices are declining (-1.7%/yr); year-one equity from $2k of loan paydown is wiped out by about $5k of value loss. Plan a longer hold.
- Fort Bend County population projected at +75% by 2050 — long-run rental-demand tailwind backs the buy-and-hold thesis.
Negotiation context
- Only 10 days on market — expect competitive offers; lowballing is unlikely to land.
Risks & watch-outs
- Climate carrying-cost: severe wind risk, 99% chance of damaging wind over 30y; extreme-heat days projected 7→23/yr by 2055 (HVAC capex compounding) — expect insurance premiums to compound above CPI over the hold.
Questions for the listing agent
- What do current leases actually rent for vs. the listed asking? Can we see a recent rent roll and the last 12 months of T-12 income?
- Built in 1976 — when were the roof, HVAC, electrical panel, plumbing, and water heater last replaced?
- What does the HOA fee cover, when was the last increase, and are there any pending special assessments or reserve-fund shortfalls?
- Is there a deadline driving the sale (1031 exchange, divorce, estate, relocation)? That informs how much negotiation room exists.
- Schools are B-rated — typically a magnet for longer-tenancy family renters. What's the average tenant stay here, and is there a school-zone premium baked into asking?
- The area grade is low — what's the realistic commute time and amenity access for the typical tenant pool here? Any planned neighborhood developments (good or bad) we should know about?
- What's the average days-on-market for RENTAL listings here right now (not sales)? A rising rental-DOM trend means longer vacancies and softer asking-rent achievability than the comps imply.
- What's the recent tenant-quality profile in this submarket — average credit score on applications, eviction rate, late-payment / NSF rate, and stable-employment percentage? A property-management company in the area should have these aggregated.
- How much new for-sale + rental construction is in the pipeline within 1–3 miles? Heavy new supply typically softens prices + rents 12–24 months out; constrained supply supports both.
Investment metrics
- 1% rule
- 0.86% ✗
- Cap rate
- 5.76%
- Cash-on-cash
- -1.89%
- DSCR
- 0.92
- GRM
- 9.7
CMA / ARV
- ARV (on-the-fly)
- $319,236
- Comps found
- 12
Show comp detail 12 sales within ~0.75 mi
| Address | Dist | Beds/Ba | Sqft | Sold | Price | $/sf | Match |
|---|---|---|---|---|---|---|---|
| 2818 Eaglerock Cir | 0.51mi | 4/2.0 | 2,146 (-0%) | 2mo | $289,000 | $135 | 73 |
| 1747 Hilton Head Dr | 0.31mi | 4/2.5 | 2,030 (-6%) | 2mo | $300,000 | $148 | 72 |
| 3519 Telford Ln Ln | 0.72mi | 4/2.0 | 2,165 (+0%) | 2mo | $345,000 | $159 | 64 |
| 2134 Hilton Head Dr | 0.29mi | 4/2.5 | 2,420 (+12%) | 1mo | $259,777 | $107 | 63 |
| 2914 Quail Valley East Dr | 0.69mi | 4/2.5 | 2,146 (-0%) | 2mo | $299,000 | $139 | 63 |
| 2503 Fall Meadow Dr | 0.53mi | 4/2.0 | 2,319 (+8%) | 2mo | $279,990 | $121 | 61 |
| 2726 Valley Forest Dr | 0.44mi | 4/2.0 | 1,937 (-10%) | 4mo | $298,000 | $154 | 60 |
| 2230 Quail Valley East Dr | 0.35mi | 3/2.0 (-1) | 1,838 (-15%) | 2mo | $224,900 | $122 | 52 |
| 3815 Lamplighter Cir | 0.64mi | 4/2.5 | 2,343 (+9%) | 4mo | $300,000 | $128 | 51 |
| 3626 Telford Ln | 0.71mi | 4/3.0 | 2,330 (+8%) | 0mo | $365,000 | $157 | 49 |
| 3607 Point Clear Dr | 0.52mi | 4/3.0 | 2,467 (+14%) | 1mo | $369,900 | $150 | 47 |
| 1519 Wells Manor Ln | 0.66mi | 4/2.0 | 1,881 (-13%) | 2mo | $327,000 | $174 | 46 |
Match score weights: distance 35% · size 25% · config 20% · recency 20%. Top-matched comps best support the ARV.
Projected returns pro-forma
-1.67% appreciation · 0.0% rent growth · sell at horizon
- IRR
- -14.3%
- Equity multiple
- 0.44×
- Total profit
- $-46,479
- Equity at exit
- $61,714
- IRR
- -10.9%
- Equity multiple
- 0.22×
- Total profit
- $-64,068
- Equity at exit
- $57,162
Cash invested: $82,392 (down + closing). Projections, not guarantees.
Landlord ↔ Tenant lean methodology
- Overall (STATE)
- 87 Strongly Landlord-Friendly
- State Texas
- 87 Strongly Landlord-Friendly · R+5
- County
- — inherits STATE
- City
- — inherits STATE
ZIP-level market 77459
- Home prices YoY
- -0.8%
- Rents YoY
- -0.1%
- Active inventory
- 1229
- Price-to-rent
- 9.7×
Monthly cashflow live
- Estimated rent
- $2,518 high interval (Pro) →
- Mortgage (P&I)
- −$1,543
- Tax from tax record
- −$442 /mo · $5,301/yr
- Insurance
- −$123
- HOA
- −$12
- Vacancy / Maint / Mgmt
- −$529
- Net cashflow
- $-130
Break-even live
Sensitivity live
| Price | -10% $37 | -5% $-47 | +0% $-130 | +5% $-213 | +10% $-297 |
|---|---|---|---|---|---|
| Rent | -10% $-329 | -5% $-229 | +0% $-130 | +5% $-30 | +10% $69 |
| Rate | -1.0pp $18 | -0.5pp $-55 | base $-130 | +0.5pp $-206 | +1.0pp $-284 |
UW: 25.0% down · 7.5% · 30yr · 1.5% tax · 5.0% vac · 8.0% maint · 8.0% mgmt
Financing live
Cash to close
- Down payment
- $73,564
- Closing costs
- $8,828
- Reserves months
- —
- Total cash needed
- —
Loan-product check · same deal, 3 products live
Conventional
25% down · 7.5% · 30yr
- Down + closing
- —
- Monthly P&I
- —
- Monthly cashflow
- —
- DSCR
- —
- Eligible?
- —
Personal DTI + credit; lowest rate.
DSCR
20% down · 8.5% · 30yr
- Down + closing
- —
- Monthly P&I
- —
- Monthly cashflow
- —
- DSCR
- —
- Eligible?
- —
No personal income docs; deal must DSCR.
Hard money
10% down · 12.0% · 12mo
- Down + closing
- —
- Monthly P&I
- —
- Monthly cashflow
- —
- DSCR
- —
- Eligible?
- —
Short-term bridge; refi at stabilization.
Rent comps 15 comps
| Address | Beds | Baths | Sqft | Rent | $/sqft | DOM | Units | Dist |
|---|---|---|---|---|---|---|---|---|
| 2010 Quail Valley East Dr Missouri City, TX | 5.0 | 3.0 | 2651 | $2,695 | $1.02 | 45d | 1 | 0.08mi |
| 3618 Quail Meadow Dr Missouri City, TX | 3.0 | 2.0 | 1618 | $1,966 | $1.22 | 45d | 1 | 0.45mi |
| 2307 Hilton Head Dr Missouri City, TX | 4.0 | 2.0 | 2606 | $2,239 | $0.86 | 18d | 1 | 0.47mi |
| 2319 Quail Valley East Dr Missouri City, TX | 5.0 | 3.0 | 2235 | $2,000 | $0.89 | 45d | 1 | 0.50mi |
| 1919 Doliver Cir Missouri City, TX | 3.0 | 2.0 | 1515 | $2,000 | $1.32 | 45d | 1 | 0.51mi |
| 2910 Fawn Ct Missouri City, TX | 4.0 | 2.5 | 2330 | $2,220 | $0.95 | 45d | 1 | 0.70mi |
| 17318 Edgehaven Dr Missouri City, TX | 3.0 | 2.0 | 1448 | $1,695 | $1.17 | 22d | 1 | 0.74mi |
| 1323 Park Crest Dr Missouri City, TX | 5.0 | 3.0 | 2607 | $2,600 | $1.00 | 45d | 1 | 0.78mi |
| 4039 Mission Valley Dr Missouri City, TX | 4.0 | 2.5 | 2364 | $2,495 | $1.06 | 24d | 1 | 0.79mi |
| 3907 Kiamesha Dr Missouri City, TX | 4.0 | 2.5 | 2896 | $2,750 | $0.95 | 19d | 1 | 0.83mi |
| 1109 Lakes Edge Ln Missouri City, TX | 4.0 | 3.0 | 2847 | $2,800 | $0.98 | 22d | 1 | 1.10mi |
| 3912 Cedar Valley Dr Missouri City, TX | 3.0 | 2.0 | 2151 | $2,200 | $1.02 | 22d | 1 | 1.33mi |
| 1935 Poco Dr Missouri City, TX | 4.0 | 3.0 | 2868 | $2,326 | $0.81 | 24d | 1 | 1.39mi |
| 2026 Summer Place Dr Missouri City, TX | 3.0 | 2.0 | 1837 | $1,861 | $1.01 | 22d | 1 | 1.42mi |
| 1806 Courtside Place Dr Missouri City, TX | 4.0 | 2.5 | 1974 | $1,915 | $0.97 | 14d | 1 | 1.43mi |
HOA detail
- Monthly dues
- $12 · $144/yr
- Likely covers
- pool
Listing history 7 events
-
2026-06-21days on market $294,257 Active 10 DOM
-
2026-06-18days on market $294,257 Active 7 DOM
-
2026-06-17days on market $294,257 Active 6 DOM
-
2026-06-16days on market $294,257 Active 5 DOM
-
2026-06-15days on market $294,257 Active 4 DOM
-
2026-06-13remarks 699-char remark
-
2026-06-13$294,257 Active 2 DOM
ⓘ Source: listings_history table (triggers on properties + properties_extension) + one-shot
backfill from property_details.listing_events for pre-trigger history.
Tax reassessment forecast TX · Resets to sale price
- Current annual tax
- $5,301 · $442/mo
- Projected year-2 tax
- $5,385 · $449/mo
- Expected delta
- +$84/yr (+$7/mo · 1.6%)
ⓘ Screening estimate from a state-policy table — verify with the county assessor before closing.
Climate risk First Street
- Flood 1/10 Low FEMA zone X (unshaded) · 0% chance over 30 yrs
- Wildfire 2/10 Low
- Heat 9/10 Extreme 7 d/yr ≥110°F today · 23 d/yr by 30 yrs out
- Wind 9/10 Extreme 99% chance of damaging wind over 30 yrs
- Air quality 3/10 Moderate 2 unhealthy d/yr today · 3 by 30 yrs out
Nearby sold comps map
Loading sold comps map…
Walkable amenities ~0.75 mi
Loading nearby amenities…
Taxation est. · year 1
- Rental income
- $30,221
- − Mortgage interest
- −$16,483
- − Property taxes
- −$5,301
- − Insurance
- −$1,471
- − Repairs & maintenance
- −$2,418
- − Management
- −$2,418
- − HOA
- −$144
- − Depreciation
- −$8,560
- Taxable loss
- −$6,574
- Est. tax savings @ 24.0%
- +$1,578
- After-tax cash flow
- $19/yr
For passive investors: Depreciation is non-cash, so a rental often shows a tax loss while cash-flowing — sheltering income. Rental losses are passive: they offset passive income freely, and up to $25,000/yr can offset ordinary (W-2) income if you actively participate and your MAGI is under $100k (phasing out to $0 by $150k); unused losses carry forward. On sale, claimed depreciation is recaptured at up to 25%, and gains may owe capital-gains tax (a 1031 exchange can defer both). Figures are a year-1 estimate at your 24.0% rate — not tax advice; consult a CPA.
Schools (NCES district)
- District
- Fort Bend ISD
- NCES district ID
- 4819650
- Math proficiency
- 44% ▼ -15.00%
- Reading proficiency
- 53% ▼ -4.00%
- Median HH income
- $82,360
- Composite
- 44.61/100
- National rank
- #2779
- State rank
- #140 of 826 in TX
Livability — Missouri City
- Score
- 67/100
- State rank
- #526
- US rank
- #10308
Category grades
Schools grade is shown separately in the Schools card above.
Census & demographics
- Census place
- Missouri City, TX
- County
- Fort Bend County · 836,777 people
- Metro
- Houston-The Woodlands-Sugar Land, TX
- Population (ZIP)
- 84,221
- Household income
- $129,151
- Rent vs Own
- Severe rent burden
- 1004.0
Population outlook (Fort Bend County) Hauer SSP2
- Today (2025)
- 1,004,526 people
- By 2030
- 1,153,104 · +14.8%
- By 2040
- 1,453,718 · +44.7%
- By 2050
- 1,753,781 · +74.6%
- By 2075
- 2,455,772 · +144.5%
- By 2100
- 2,930,528 · +191.7%
Race, ethnicity, and origin ACS 2023
- Neighborhood character
- Highly diverse neighborhood (Simpson 0.75)
- Race & ethnicity
- White 34% Black 26% Asian 22% Hispanic / Latino 13% Two or more races 10%
- Hispanic origin (detail)
- Mexican 7%
- Common ancestry
- Lithuanian 2% Slovak 1% Italian 1%
- Foreign-born
- 21% · Canada, China, Vietnam
- Languages at home
- 73% English-only · Other Asian/Pacific 8% Spanish 7% Other Indo-European 5%
Political lean MEDSL · Fort Bend
- 2024 margin
- Toss-up / Even · D 49.5% · R 47.9% · Other 2.6%
- 2008→2024 swing
- +4.0pp toward D · 2008: -2.4pp · 2024: 1.6pp
- All cycles
- 2024: D+1.6 2020: D+10.6 2016: D+6.6 2012: R+6.8 2008: R+2.4
Not yet ingested
- Civics
- —
Market trends
- HPI YoY
- ▼ -1.67%
- Current HPI
- 212.3573
- Rent YoY
- ▼ -0.15%
- Metro
- Houston-The Woodlands-Sugar Land, TX
- State GDP YoY
- ▲ 3.95%
- F500 in state
- 110
Industry mix (Fortune 500 HQ in TX)
| Industry | F500 HQs | Revenue |
|---|---|---|
| Energy | 16 | $1,198B |
|
||
| Technology | 5 | $198B |
|
||
| Engineering / Construction | 4 | $72B |
|
||
| Energy Services | 3 | $60B |
|
||
| Utilities | 3 | $41B |
|
||
| Healthcare | 2 | $330B |
|
||
Price history
1 event — show timeline
- 2026-06-11 Listed $294,257 HARMLS
Property tax history
+4.0%/yrLatest (2025): $5,301 · +5.9% YoY. Source: county tax records.
Cash-flow waterfall
monthlySold comps — $/sqft
last 12 mo · ≤1 miLoading sold comps…