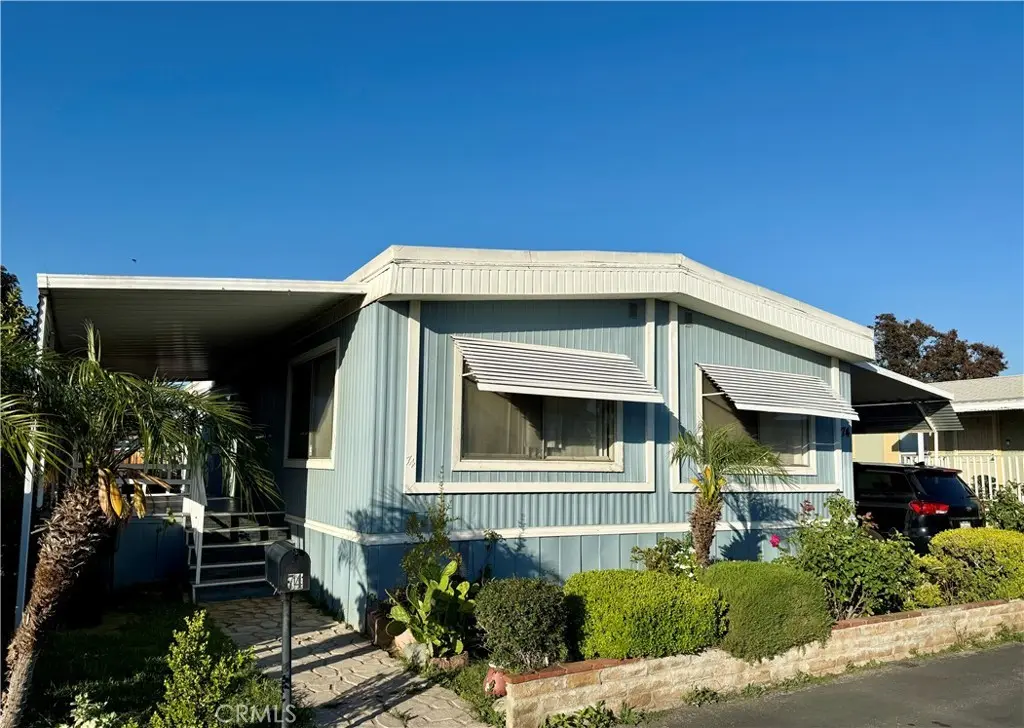
222 S Rancho #74 · San Bernardino, CA
Flood risk 1/10 · Minimal
- FEMA flood zone
- X (unshaded)
- Chance of flooding over 30 yrs
- 0.0%
- Est. flood insurance / yr
- $507 – $1,088
Fire risk 1/10 · Minimal
- Est. fire insurance / yr
- $659 – $1,223
Heat risk 8/10 · Major
- Hot days now (above 102°F)
- 7 days/yr
- Hot days in 30 yrs
- 19 days/yr
Wind risk 1/10 · Minimal
- Chance of severe wind over 30 yrs
- —
Air-quality risk 10/10 · Severe
- Unhealthy air days now
- 25 days/yr
- Unhealthy air days in 30 yrs
- 31 days/yr
Risk factors via First Street. Map © Google.
Why this score? — see what drove the C grade
The composite is a weighted blend of 9 inputs, each scored 0–100. Each bar is that input's sub-score; the figure is the points it added to the 100-point composite (weight × sub-score).
- Cash flow +25.4/30.0
- DSCR +8.4/10.0
- 1% rule +6.7/10.0
- ARV discount +4.5/15.0
- Rent growth +3.9/5.0
- Schools +3.1/10.0
- Livability +3.0/5.0
- Condition / age +2.5/5.0
- Appreciation +0.0/10.0
$184,900
🖨 Deal sheet (PDF) 📄 Offer letter ✓ Due diligence
Listing remarks
Space rent for new buyer: $514.95! Well maintained and spacious 3 bed, 2 bath manufactured home located in a family park. This inviting home offers a comfortable layout with plenty of living space, plus a great porch and patio perfect for relaxing or entertaining. A fantastic opportunity for anyone looking for comfort, value, and convenience.
Key facts
- 2 garage spots
- Community pool
- Built 1977
Property features AI
Finance
- Other: Community features include street lighting and suburban setting
- HOA & community: Park land lease of $514.95 (park-managed)
Exterior
- Parking: Two garage spaces; Three uncovered parking spaces; Five total parking spaces; Located in Glen Aire park
- Utilities: Public sewer; District/public water
- Home design: Single-story mobile home (double-wide); Mobile home remains on site
- Construction: Mobile home measuring approximately 24 by 52 feet; Single-story structure; Year built per public records
- Exterior features: Community pool; Yard
Interior
- Bathrooms: Two full bathrooms
- Interior features: Entry located on the main level
- Laundry & utility: Laundry inside the home
Neighborhood map
What this means for you Summary
Snapshot
- This is a 2-bed/2.0-bath manufactured listed at $185k.
Deal economics
- At list price, monthly cash flow is $428 ($5k/yr) — positive.
- The deal already cash-flows at list — no discount required.
- Meets the 1% rule at list price ($2k rent vs $185k).
- Cap rate 9.1% vs local median 3.5% in San Bernardino — top-decile yield for the area; either an underpriced asset or a hidden risk that comps aren't pricing in. Stress-test before assuming the spread holds.
Location & tenants
- Location reads 59/100 on livability (#661 in CA) — a working-class tenant base; expect higher turnover. Strengths: commute A+, housing A; Watch: schools D, employment D, crime F.
- Rialto Unified (suburban): math 25% / reading 46% proficiency, ranked #268 of 517 in CA (top 52%) — families likely to look elsewhere, expect single-tenant / working-renter base with shorter leases; 74% free/reduced lunch — lower-income household profile, screen leases tightly.
- Market conditions: Rents rising fast (+5.5%/yr); 90 active listings in the ZIP; 10 comparable units currently listed for rent nearby; rentals at typical pace (median 25d on market — plan ~3-4 weeks tenant-placement turnaround); 5,458 units permitted in San Bernardino County in 2024 (1,500 in 5+ unit buildings).
- At $2,160/mo this rent would consume 48% of the median local household income ($54k/yr) (locally 2569% of renters already pay >50% of income on rent) — very limited rent-growth headroom before tenants either downsize or default.
Forward outlook
- Local home prices are declining (-3.0%/yr); year-one equity from $1k of loan paydown is wiped out by about $6k of value loss. Plan a longer hold.
- San Bernardino County population projected at +15% by 2050 — modest demand growth; plan on rents tracking national, not racing it.
- At projected returns (-3.0% appreciation + 5.5% rent growth), your $52k cash investment doubles in ~9 years — after that, you're playing with house money.
Negotiation context
- Only 6 days on market — expect competitive offers; lowballing is unlikely to land.
- 2 sale attempts since 17y ago with the ask held roughly flat each time — persistent listings suggest the price (not the market) is what's stuck; bring a comps-based counter.
Risks & watch-outs
- Climate carrying-cost: extreme-heat days projected 7→19/yr by 2055 (HVAC capex compounding) — expect insurance premiums to compound above CPI over the hold.
Questions for the listing agent
- Built in 1977 — when were the roof, HVAC, electrical panel, plumbing, and water heater last replaced?
- Is there a deadline driving the sale (1031 exchange, divorce, estate, relocation)? That informs how much negotiation room exists.
- Schools are D-rated, which usually means shorter tenancies and higher turnover. Who's the typical renter profile here, and what's been the actual vacancy rate?
- Crime grade is F in this area — have there been break-ins, vandalism, or insurance claims at this property in the last 3 years? What carrier currently insures it and at what premium?
- What's the average days-on-market for RENTAL listings here right now (not sales)? A rising rental-DOM trend means longer vacancies and softer asking-rent achievability than the comps imply.
- What's the recent tenant-quality profile in this submarket — average credit score on applications, eviction rate, late-payment / NSF rate, and stable-employment percentage? A property-management company in the area should have these aggregated.
- How much new for-sale + rental construction is in the pipeline within 1–3 miles? Heavy new supply typically softens prices + rents 12–24 months out; constrained supply supports both.
Investment metrics
- 1% rule
- 1.17% ✓
- Cap rate
- 9.07%
- Cash-on-cash
- 9.93%
- DSCR
- 1.44
- GRM
- 7.1
CMA / ARV
- ARV (on-the-fly)
- $173,472
- Comps found
- 9
Show comp detail 9 sales within ~0.75 mi
| Address | Dist | Beds/Ba | Sqft | Sold | Price | $/sf | Match |
|---|---|---|---|---|---|---|---|
| 222 S Rancho Ave #59 | 0.00mi | 3/2.0 (+1) | 1,200 (-4%) | 13mo | $167,000 | $139 | 78 |
| 243 N Meridian Ave #227 | 0.73mi | 3/2.0 (+1) | 1,248 (0%) | 3mo | $190,000 | $152 | 58 |
| 1945 Deer Creek Rd | 0.18mi | 3/2.0 (+1) | 1,152 (-8%) | 19mo | $405,000 | $352 | 58 |
| 2260 W Rialto Ave #33 | 0.35mi | 2/2.0 | 1,344 (+8%) | 16mo | $140,000 | $104 | 58 |
| 201 S Pennsylvania Ave #48 | 0.37mi | 3/2.0 (+1) | 1,152 (-8%) | 9mo | $130,000 | $113 | 58 |
| 2160 W Rialto Ave #122 | 0.31mi | 3/2.0 (+1) | 1,100 (-12%) | 8mo | $119,000 | $108 | 54 |
| 494 S Macy St S #167 | 0.50mi | 3/2.0 (+1) | 1,152 (-8%) | 19mo | $200,000 | $174 | 43 |
| 2505 Foothill Blvd | 0.73mi | 2/2.0 | 1,152 (-8%) | 23mo | $141,000 | $122 | 34 |
| 494 S Macy St #159 | 0.50mi | 3/2.0 (+1) | 1,080 (-14%) | 19mo | $185,000 | $171 | 34 |
Match score weights: distance 35% · size 25% · config 20% · recency 20%. Top-matched comps best support the ARV.
Projected returns pro-forma
-3.0% appreciation · 5.5% rent growth · sell at horizon
- IRR
- 1.4%
- Equity multiple
- 1.06×
- Total profit
- $2,912
- Equity at exit
- $27,569
- IRR
- 13.4%
- Equity multiple
- 2.19×
- Total profit
- $61,835
- Equity at exit
- $15,987
Cash invested: $51,772 (down + closing). Projections, not guarantees.
Landlord ↔ Tenant lean methodology
- Overall (STATE)
- 18 Strongly Tenant-Friendly
- State California
- 18 Strongly Tenant-Friendly · D+13
- County
- — inherits STATE
- City
- — inherits STATE
ZIP-level market 92410
- Home prices YoY
- -9.7%
- Rents YoY
- 5.5%
- Active inventory
- 90
- Price-to-rent
- 7.1×
Monthly cashflow live
- Estimated rent
- $2,160 high interval (Pro) →
- Mortgage (P&I)
- −$970
- Tax est. 1.5%
- −$231 /mo · $2,774/yr
- Insurance
- −$77
- HOA
- −$0
- Vacancy / Maint / Mgmt
- −$453
- Net cashflow
- $428
Break-even live
Sensitivity live
| Price | -10% $556 | -5% $492 | +0% $428 | +5% $364 | +10% $300 |
|---|---|---|---|---|---|
| Rent | -10% $258 | -5% $343 | +0% $428 | +5% $514 | +10% $599 |
| Rate | -1.0pp $521 | -0.5pp $475 | base $428 | +0.5pp $380 | +1.0pp $332 |
UW: 25.0% down · 7.5% · 30yr · 1.5% tax · 5.0% vac · 8.0% maint · 8.0% mgmt
Financing live
Cash to close
- Down payment
- $46,225
- Closing costs
- $5,547
- Reserves months
- —
- Total cash needed
- —
Loan-product check · same deal, 3 products live
Conventional
25% down · 7.5% · 30yr
- Down + closing
- —
- Monthly P&I
- —
- Monthly cashflow
- —
- DSCR
- —
- Eligible?
- —
Personal DTI + credit; lowest rate.
DSCR
20% down · 8.5% · 30yr
- Down + closing
- —
- Monthly P&I
- —
- Monthly cashflow
- —
- DSCR
- —
- Eligible?
- —
No personal income docs; deal must DSCR.
Hard money
10% down · 12.0% · 12mo
- Down + closing
- —
- Monthly P&I
- —
- Monthly cashflow
- —
- DSCR
- —
- Eligible?
- —
Short-term bridge; refi at stabilization.
Rent comps 10 comps
| Address | Beds | Baths | Sqft | Rent | $/sqft | DOM | Units | Dist |
|---|---|---|---|---|---|---|---|---|
| 1417 Pennsylvania Ave Colton, CA | 3.0 | 2.0 | 1300 | $2,395 | $1.84 | 44d | 1 | 1.04mi |
| 619 N Gardena St San Bernardino, CA | 3.0 | 2.0 | 1000 | $2,900 | $2.90 | 5d | 1 | 1.05mi |
| 1360 Poplar St San Bernardino, CA | 3.0 | 2.0 | 1250 | $2,495 | $2.00 | 18d | 1 | 1.06mi |
| 1331 N Pennsylvania Ave Unit 1331 Colton, CA | 1.0 | 1.0 | 750 | $1,600 | $2.13 | 3d | 1 | 1.10mi |
| 1327 N Pennsylvania Ave Unit 1327 Colton, CA | 3.0 | 2.0 | 1200 | $2,640 | $2.20 | 25d | 1 | 1.10mi |
| 515 Ramona Ave San Bernardino, CA | 3.0 | 1.0 | 1040 | $2,095 | $2.01 | 25d | 1 | 1.12mi |
| 555 Ramona Ave San Bernardino, CA | 1.0 | 1.0 | 724 | $1,650 | $2.28 | 44d | 1 | 1.15mi |
| 455 Pear St San Bernardino, CA | 2.0 | 1.0 | 875 | $2,050 | $2.34 | 44d | 1 | 1.29mi |
| 1455 Veterans Way Apt C Colton, CA | 2.0 | 1.0 | 779 | $1,850 | $2.37 | 21d | 1 | 1.32mi |
| 1455 Veterans Way Apt F Colton, CA | 2.0 | 1.0 | 779 | $1,750 | $2.25 | 21d | 1 | 1.32mi |
Listing history 6 events
-
2026-06-18days on market $184,900 Active 6 DOM
-
2026-06-17days on market $184,900 Active 5 DOM
-
2026-06-16days on market $184,900 Active 4 DOM
-
2026-06-15days on market $184,900 Active 3 DOM
-
2026-06-13remarks 347-char remark
-
2026-06-13$184,900 Active 1 DOM
ⓘ Source: listings_history table (triggers on properties + properties_extension) + one-shot
backfill from property_details.listing_events for pre-trigger history.
Climate risk First Street
- Flood 1/10 Low FEMA zone X (unshaded) · 0% chance over 30 yrs
- Wildfire 1/10 Low
- Heat 8/10 Severe 7 d/yr ≥102°F today · 19 d/yr by 30 yrs out
- Wind 1/10 Low
- Air quality 10/10 Extreme 25 unhealthy d/yr today · 31 by 30 yrs out
Nearby sold comps map
Loading sold comps map…
Walkable amenities ~0.75 mi
Loading nearby amenities…
Taxation est. · year 1
- Rental income
- $25,914
- − Mortgage interest
- −$10,357
- − Property taxes
- −$2,774
- − Insurance
- −$924
- − Repairs & maintenance
- −$2,073
- − Management
- −$2,073
- − Depreciation
- −$5,379
- Taxable income
- $2,334
- Est. tax owed @ 24.0%
- −$560
- After-tax cash flow
- $4,579/yr
For passive investors: Depreciation is non-cash, so a rental often shows a tax loss while cash-flowing — sheltering income. Rental losses are passive: they offset passive income freely, and up to $25,000/yr can offset ordinary (W-2) income if you actively participate and your MAGI is under $100k (phasing out to $0 by $150k); unused losses carry forward. On sale, claimed depreciation is recaptured at up to 25%, and gains may owe capital-gains tax (a 1031 exchange can defer both). Figures are a year-1 estimate at your 24.0% rate — not tax advice; consult a CPA.
Schools (NCES district)
- District
- Rialto Unified
- NCES district ID
- 0632370
- Math proficiency
- 25% ▲ 3.00%
- Reading proficiency
- 46% ▲ 10.00%
- Median HH income
- $50,916
- Composite
- 30.77/100
- National rank
- #6154
- State rank
- #268 of 517 in CA
Livability — San Bernardino
- Score
- 59/100
- State rank
- #661
- US rank
- #20479
Category grades
Schools grade is shown separately in the Schools card above.
Census & demographics
- Census place
- San Bernardino, CA
- County
- San Bernardino County · 2,030,291 people
- City population
- 255,614
- Metro
- Riverside-San Bernardino-Ontario, CA
- Population (ZIP)
- 47,869
- Household income
- $54,181
- Rent vs Own
- Severe rent burden
- 2569.0
Population outlook (San Bernardino County) Hauer SSP2
- Today (2025)
- 2,300,329 people
- By 2030
- 2,378,907 · +3.4%
- By 2040
- 2,523,137 · +9.7%
- By 2050
- 2,642,388 · +14.9%
- By 2075
- 2,880,769 · +25.2%
- By 2100
- 2,909,436 · +26.5%
Race, ethnicity, and origin ACS 2023
- Neighborhood character
- Predominantly Hispanic (80%)
- Race & ethnicity
- Hispanic / Latino 80% Two or more races 12% Black 8% White 7% Asian 3%
- Hispanic origin (detail)
- Mexican 70%
- Common ancestry
- Romanian 0%
- Foreign-born
- 29% · Canada, Vietnam, Jamaica
- Languages at home
- 32% English-only · Spanish 65% Vietnamese 1%
Political lean MEDSL · San Bernardino
- 2024 margin
- Toss-up / Even · D 47.5% · R 49.7% · Other 2.8%
- 2008→2024 swing
- -8.5pp toward R · 2008: 6.3pp · 2024: -2.1pp
- All cycles
- 2024: R+2.1 2020: D+10.7 2016: D+9.8 2012: D+5.4 2008: D+6.3
Not yet ingested
- Civics
- —
Market trends
- HPI YoY
- ▼ -54.39%
- Current HPI
- 504.0299
- Rent YoY
- ▲ 5.50%
- Metro
- Riverside-San Bernardino-Ontario, CA
- State GDP YoY
- ▲ 3.21%
- F500 in state
- 116
Industry mix (Fortune 500 HQ in CA)
| Industry | F500 HQs | Revenue |
|---|---|---|
| Technology | 27 | $1,492B |
|
||
| Financial Services | 3 | $174B |
|
||
| Retail | 3 | $44B |
|
||
| Insurance | 3 | $26B |
|
||
| Media / Entertainment | 2 | $115B |
|
||
| Pharmaceuticals / Biotech | 2 | $62B |
|
||
Price history
+302.0% since first listed3 events — show timeline
- 2026-06-12 Listed $184,900 CRMLS
- 2009-06-28 Listing Removed — CRMLS
- 2009-05-12 Listed $46,000 CRMLS
Property tax history
-11.9%/yrLatest (2020): $17 · +0.4% YoY. Source: county tax records.
Cash-flow waterfall
monthlySold comps — $/sqft
last 12 mo · ≤1 miLoading sold comps…