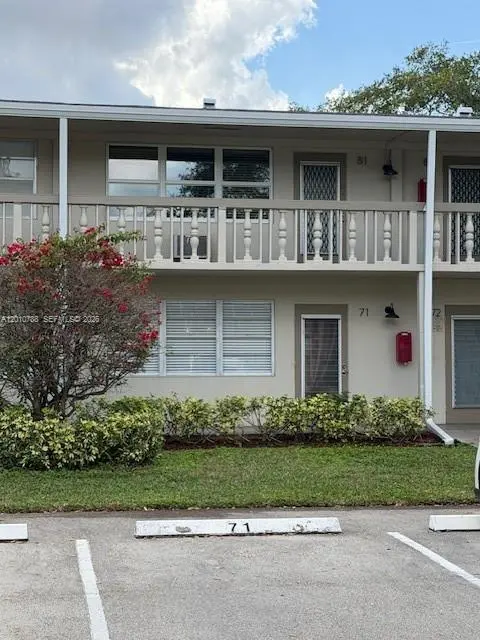
71 Tilford D #71 · Deerfield Beach, FL
Flood risk No data
- FEMA flood zone
- —
- Chance of flooding over 30 yrs
- —
- Est. flood insurance / yr
- —
Fire risk No data
- Est. fire insurance / yr
- —
Heat risk No data
- Hot days now (above threshold)
- —
- Hot days in 30 yrs
- —
Wind risk No data
- Chance of severe wind over 30 yrs
- —
Air-quality risk No data
- Unhealthy air days now
- —
- Unhealthy air days in 30 yrs
- —
Risk factors via First Street. Map © Google.
Why this score? — see what drove the C grade
The composite is a weighted blend of 9 inputs, each scored 0–100. Each bar is that input's sub-score; the figure is the points it added to the 100-point composite (weight × sub-score).
- Cash flow +23.2/30.0
- 1% rule +10.0/10.0
- DSCR +7.5/10.0
- ARV discount +7.5/15.0
- Schools +4.1/10.0
- Livability +3.8/5.0
- Rent growth +2.5/5.0
- Condition / age +1.0/5.0
- Appreciation +0.0/10.0
$74,500
🖨 Deal sheet 📄 Offer letter ✓ Due diligence
Listing remarks MLS
Remodeled 1/1.5 with upgraded kitchen and baths, laminate wood floors, and so much more! Association claims 55+. Leasing not allowed. Make us an offer today!
Key facts
- $636 HOA
- Garage
- Built 1979
Property features AI
Finance
- Financial info: Pets allowed with possible restrictions
- HOA & community: Monthly association fee; HOA covers insurance, grounds maintenance, and structure maintenance; Community amenities include clubhouse, laundry, storage, and transportation service; Senior community
Exterior
- Parking: Garage with 1 space; Guest parking available; 1 covered parking space
- Security: Key card entry; Security guard; Smoke detectors
- Utilities: Cable available
- Home design: Attached property; 2 stories; Faces north; Entry on level 1
- Construction: Block construction; Resale property
- Exterior features: Enclosed porch; Patio; Screened porch; Exterior lighting; Complex is fenced
Interior
- Kitchen: Electric range; Microwave; Refrigerator
- Bedrooms: Bedroom on main level
- Flooring: Laminate
- Bathrooms: 1 full bathroom; 1 half bathroom
- Heating & cooling: Electric heating; Wall/window cooling units
- Interior features: Blinds; Partially furnished; Eat-in kitchen; First-floor entry
- Laundry & utility: Common area laundry
Neighborhood map
What this means for you Summary
Snapshot
- This is a 1-bed/1.5-bath condo listed at $74k. Condition is rated poor.
Deal economics
- At list price, monthly cash flow is $135 ($2k/yr) — positive.
- The deal already cash-flows at list — no discount required.
- Meets the 1% rule at list price ($2k rent vs $74k).
- Cap rate 8.5% vs local median 4.2% in Deerfield Beach — top-decile yield for the area; either an underpriced asset or a hidden risk that comps aren't pricing in. Stress-test before assuming the spread holds.
Location & tenants
- Location reads 75/100 on livability (#250 in FL, #3,970 nationally) — a middle-class / working-renter tenant base. Strengths: housing A+, health & safety A+, cost of living A; Watch: schools D-, amenities D-, employment D-.
- Broward (suburban): math 42% / reading 53% proficiency, ranked #46 of 73 in FL (top 63%) — families likely to look elsewhere, expect single-tenant / working-renter base with shorter leases.
- Market conditions: Rents flat; 586 active listings in the ZIP; 35 comparable units currently listed for rent nearby; rentals at typical pace (median 24d on market — plan ~3-4 weeks tenant-placement turnaround); 2,111 units permitted in Broward County in 2024 (1,265 in 5+ unit buildings).
- This rent runs 37% of the median local income ($53k/yr) — at the standard rent-burdened threshold; future hikes will face affordability resistance.
Forward outlook
- Local home prices are declining (-3.0%/yr); year-one equity from $515 of loan paydown is wiped out by about $2k of value loss. Plan a longer hold.
- Broward County population projected at +34% by 2050 — long-run rental-demand tailwind backs the buy-and-hold thesis.
Negotiation context
- Only 13 days on market — expect competitive offers; lowballing is unlikely to land.
- 3 sale attempts since 14y ago; this cycle's ask has dropped $9k (11%) from the opening price — seller is motivated, your offer sets the floor, not the list.
- Current owner paid $20k; list at $74k implies a 272% gain — meaningful room to come down on a strong offer.
Risks & watch-outs
- Watch-outs: HOA is 39% of rent.
Questions for the listing agent
- Have any recent inspections been done? Can we get a copy of the seller's disclosures and any deferred-maintenance estimates?
- Built in 1979 — when were the roof, HVAC, electrical panel, plumbing, and water heater last replaced?
- What does the HOA fee cover, when was the last increase, and are there any pending special assessments or reserve-fund shortfalls?
- Any open or pending special assessments — roof, HVAC, plumbing, elevator, façade? What's the per-unit balance and payoff schedule, and is the seller paying it off at close or rolling it to the buyer?
- Is there a deadline driving the sale (1031 exchange, divorce, estate, relocation)? That informs how much negotiation room exists.
- Schools are D-rated, which usually means shorter tenancies and higher turnover. Who's the typical renter profile here, and what's been the actual vacancy rate?
- What's the average days-on-market for RENTAL listings here right now (not sales)? A rising rental-DOM trend means longer vacancies and softer asking-rent achievability than the comps imply.
- What's the recent tenant-quality profile in this submarket — average credit score on applications, eviction rate, late-payment / NSF rate, and stable-employment percentage? A property-management company in the area should have these aggregated.
- How much new apartment / multifamily construction is in the pipeline within 1–3 miles? Heavy new supply (>2% of stock underway) typically softens rents 12–24 months out; light construction supports rent growth.
Investment metrics
- 1% rule
- 2.18% ✓
- Cap rate
- 8.46%
- Cash-on-cash
- 7.76%
- DSCR
- 1.35
- GRM
- 3.8
CMA / ARV
No comps found within radius.
Projected returns pro-forma
-3.0% appreciation · 0.1% rent growth · sell at horizon
- IRR
- -10.7%
- Equity multiple
- 0.63×
- Total profit
- $-7,684
- Equity at exit
- $11,108
- IRR
- -13.4%
- Equity multiple
- 0.43×
- Total profit
- $-11,815
- Equity at exit
- $6,441
Cash invested: $20,860 (down + closing). Projections, not guarantees.
Landlord ↔ Tenant lean methodology
- Overall (STATE)
- 87 Strongly Landlord-Friendly
- State Florida
- 87 Strongly Landlord-Friendly · R+3
- County
- — inherits STATE
- City
- — inherits STATE
ZIP-level market 33442
- Rents YoY
- 0.1%
- Active inventory
- 586
- Price-to-rent
- 3.8×
Monthly cashflow live
- Estimated rent
- $1,627 high interval (Pro) →
- Mortgage (P&I)
- −$391
- Tax est. 1.5%
- −$93 /mo · $1,118/yr
- Insurance
- −$31
- HOA
- −$636
- Vacancy / Maint / Mgmt
- −$342
- Net cashflow
- $135
Break-even live
UW: 25.0% down · 7.5% · 30yr · 1.5% tax · 5.0% vac · 8.0% maint · 8.0% mgmt
Financing live
Cash to close
- Down payment
- $18,625
- Closing costs
- $2,235
- Reserves months
- —
- Total cash needed
- —
Loan-product check · same deal, 3 products live
Conventional
25% down · 7.5% · 30yr
- Down + closing
- —
- Monthly P&I
- —
- Monthly cashflow
- —
- DSCR
- —
- Eligible?
- —
Personal DTI + credit; lowest rate.
DSCR
20% down · 8.5% · 30yr
- Down + closing
- —
- Monthly P&I
- —
- Monthly cashflow
- —
- DSCR
- —
- Eligible?
- —
No personal income docs; deal must DSCR.
Hard money
10% down · 12.0% · 12mo
- Down + closing
- —
- Monthly P&I
- —
- Monthly cashflow
- —
- DSCR
- —
- Eligible?
- —
Short-term bridge; refi at stabilization.
Rent comps 35 comps
| Address | Beds | Baths | Sqft | Rent | $/sqft | DOM | Units | Dist |
|---|---|---|---|---|---|---|---|---|
| 181 Tilford I Unit I Deerfield Beach, FL | 1.0 | 1.5 | 700 | $1,350 | $1.93 | 24d | 1 | 0.06mi |
| 111 Tilford F #111 Deerfield Beach, FL | 1.0 | 1.0 | 585 | $1,500 | $2.56 | 5d | 1 | 0.07mi |
| 111 Tilford F #111 Deerfield Beach, FL | 1.0 | 1.0 | 585 | $1,500 | $2.56 | 20d | 1 | 0.07mi |
| 27 Newport B Deerfield Beach, FL | 1.0 | 1.5 | 700 | $1,550 | $2.21 | 21d | 1 | 0.18mi |
| 25 Newport Ct Unit 25 Deerfield Beach, FL | 1.0 | 1.0 | 700 | $1,549 | $2.21 | 24d | 1 | 0.18mi |
| 20 Prescott E Unit 20 Deerfield Beach, FL | 1.0 | 1.5 | 700 | $1,600 | $2.29 | 24d | 1 | 0.22mi |
| 188 Prescott E Unit 188 Deerfield Beach, FL | 1.0 | 1.5 | 700 | $1,800 | $2.57 | 24d | 1 | 0.23mi |
| 358 Markham Cres Unit 358 Deerfield Beach, FL | 1.0 | 1.5 | 700 | $1,500 | $2.14 | 24d | 1 | 0.29mi |
| 125 Newport I Unit I Deerfield Beach, FL | 1.0 | 1.5 | 700 | $1,600 | $2.29 | 24d | 1 | 0.32mi |
| 308 Markham N Deerfield Beach, FL | 1.0 | 1.5 | 700 | $1,200 | $1.71 | 24d | 1 | 0.33mi |
| 181 Newport Ct #181 Deerfield Beach, FL | 1.0 | 1.5 | 700 | $1,650 | $2.36 | 24d | 1 | 0.35mi |
| 170 Newport K Deerfield Beach, FL | 1.0 | 1.0 | 585 | $1,430 | $2.44 | 24d | 1 | 0.36mi |
| 260 Prescott N Unit 260 Deerfield Beach, FL | 1.0 | 1.5 | 700 | $1,500 | $2.14 | 24d | 1 | 0.36mi |
| 436 Markham S #436 Deerfield Beach, FL | 1.0 | 1.0 | 585 | $1,400 | $2.39 | 24d | 1 | 0.39mi |
| 111 Oakridge I #111 Deerfield Beach, FL | 1.0 | 1.5 | 706 | $1,595 | $2.26 | 24d | 1 | 0.39mi |
| 226 Newport O Deerfield Beach, FL | 1.0 | 1.5 | 700 | $1,700 | $2.43 | 24d | 1 | 0.40mi |
| 226 Newport O Deerfield Beach, FL | 1.0 | 1.5 | 700 | $1,600 | $2.29 | 2d | 1 | 0.40mi |
| 6 Ventnor a Deerfield Beach, FL | 1.0 | 1.0 | 600 | $1,429 | $2.38 | 24d | 1 | 0.45mi |
| 295 Newport Dr Unit 295 Deerfield Beach, FL | 1.0 | 1.0 | 595 | $1,450 | $2.44 | 24d | 1 | 0.46mi |
| 306 Newport T #306 Deerfield Beach, FL | 1.0 | 1.0 | 585 | $1,350 | $2.31 | 24d | 1 | 0.48mi |
| 41 Deer Creek Rd Unit G106 Deerfield Beach, FL | — | 1.0 | 550 | $1,850 | $3.36 | 24d | 1 | 0.53mi |
| 384 Durham Cir Unit 384 Deerfield Beach, FL | 1.0 | 1.0 | 593 | $1,400 | $2.36 | 24d | 1 | 0.67mi |
| 178 Durham E Unit 178 Deerfield Beach, FL | 1.0 | 1.0 | 593 | $1,350 | $2.28 | 10d | 1 | 0.70mi |
| 178 Durham E Unit 178 Deerfield Beach, FL | 1.0 | 1.0 | 593 | $1,350 | $2.28 | 2d | 1 | 0.70mi |
| 102 Westbury E #102 Deerfield Beach, FL | 1.0 | 1.0 | 585 | $1,900 | $3.25 | 7d | 1 | 0.81mi |
| 98 Westbury E #98 Deerfield Beach, FL | 1.0 | 1.0 | 585 | $1,600 | $2.74 | 24d | 1 | 0.81mi |
| 125 Westbury E Deerfield Beach, FL | 1.0 | 1.0 | 585 | $1,600 | $2.74 | 24d | 1 | 0.82mi |
| 127 Westbury Cir Deerfield Beach, FL | 1.0 | 1.0 | 585 | $1,425 | $2.44 | 24d | 1 | 0.83mi |
| 3016 Cambridge A Unit A Deerfield Beach, FL | 1.0 | 1.5 | 700 | $1,350 | $1.93 | 24d | 1 | 0.85mi |
| 149 Westbury I #149 Deerfield Beach, FL | 1.0 | 1.0 | 585 | $1,700 | $2.91 | 24d | 1 | 0.88mi |
| 137 Farnham F Deerfield Beach, FL | 1.0 | 1.5 | 708 | $2,000 | $2.82 | 24d | 1 | 0.93mi |
| 137 Farnham F #137 Deerfield Beach, FL | 1.0 | 1.5 | 700 | $2,500 | $3.57 | 24d | 1 | 0.94mi |
| 329 Farnham P #329 Deerfield Beach, FL | 1.0 | 1.5 | 700 | $1,450 | $2.07 | 24d | 1 | 1.02mi |
| 4359 SW 10th Pl Deerfield Beach, FL | 1.0 | 1.0 | 718 | $1,913 | $2.66 | 21d | 1 | 1.21mi |
| 4400 NW 6th St Deerfield Beach, FL | 1.0–2.0 | 1.0–2.0 | 875 | $1,826 | $2.09 | 1d | 9 | 1.42mi |
HOA detail condo
- Monthly dues
- $636 · $7,632/yr
- Assessments
- None detected in remarks — confirm with the listing agent.
Listing history 18 events
-
2026-06-18days on market $74,500 Active 13 DOM
-
2026-06-17days on market $74,500 Active 12 DOM
-
2026-06-16days on market $74,500 Active 11 DOM
-
2026-06-15days on market $74,500 Active 10 DOM
-
2026-06-13days on market $74,500 Active 8 DOM
-
2026-06-09days on market $74,500 Active 4 DOM
-
2026-06-08days on market $74,500 Active 3 DOM
-
2026-06-07remarks 266-char remark
-
2026-06-07pricestatusdays on market $74,500 Active 2 DOM
-
2026-04-30status Pending
-
2026-04-30$83,500 Active
-
2013-09-09soldstatus $20,000 Sold 157-char remark
Show marketing remark (157 chars)
Remodeled 1/1.5 with upgraded kitchen and baths, laminate wood floors, and so much more! Association claims 55+. Leasing not allowed. Make us an offer today!
-
2013-07-17status Pending 157-char remark
Show marketing remark (157 chars)
Remodeled 1/1.5 with upgraded kitchen and baths, laminate wood floors, and so much more! Association claims 55+. Leasing not allowed. Make us an offer today!
-
2013-07-02status Active 157-char remark
Show marketing remark (157 chars)
Remodeled 1/1.5 with upgraded kitchen and baths, laminate wood floors, and so much more! Association claims 55+. Leasing not allowed. Make us an offer today!
-
2013-06-26status Pending 157-char remark
Show marketing remark (157 chars)
Remodeled 1/1.5 with upgraded kitchen and baths, laminate wood floors, and so much more! Association claims 55+. Leasing not allowed. Make us an offer today!
-
2013-06-15price $21,900 157-char remark
Show marketing remark (157 chars)
Remodeled 1/1.5 with upgraded kitchen and baths, laminate wood floors, and so much more! Association claims 55+. Leasing not allowed. Make us an offer today!
-
2013-03-31historical
-
2012-06-10$26,900
ⓘ Source: listings_history table (triggers on properties + properties_extension) + one-shot
backfill from property_details.listing_events for pre-trigger history.
Nearby sold comps map
Loading sold comps map…
Walkable amenities ~0.75 mi
Loading nearby amenities…
Taxation est. · year 1
- Rental income
- $19,530
- − Mortgage interest
- −$4,173
- − Property taxes
- −$1,118
- − Insurance
- −$372
- − Repairs & maintenance
- −$1,562
- − Management
- −$1,562
- − HOA
- −$7,632
- − Depreciation
- −$2,167
- Taxable income
- $942
- Est. tax owed @ 24.0%
- −$226
- After-tax cash flow
- $1,392/yr
For passive investors: Depreciation is non-cash, so a rental often shows a tax loss while cash-flowing — sheltering income. Rental losses are passive: they offset passive income freely, and up to $25,000/yr can offset ordinary (W-2) income if you actively participate and your MAGI is under $100k (phasing out to $0 by $150k); unused losses carry forward. On sale, claimed depreciation is recaptured at up to 25%, and gains may owe capital-gains tax (a 1031 exchange can defer both). Figures are a year-1 estimate at your 24.0% rate — not tax advice; consult a CPA.
Condition & rehab AI · 1 photo
This 55+ condo requires extensive repairs and renovations to bring it up to a livable condition. Significant exterior and interior work is needed to improve its resale and rental value.
Repairs flagged
- Major exterior siding — Significant wear and tear
- Major exterior paint — Peeling paint
- Major interior walls — No visible condition
- Major bathrooms — No visible condition
- Major kitchen — No visible condition
- Major roof — No visible damage
Value-add opportunities
- Both exterior renovation — Improves curb appeal and value
- Both interior renovation — Enhances living space and value
- Both roof inspection and repair — Ensures structural integrity and safety
Renovation cost estimate screening
| Repair item | Severity | Est. cost |
|---|---|---|
| exterior siding · Significant wear and tear | Major | $15,000–50,000 |
| exterior paint · Peeling paint | Major | $15,000–50,000 |
| interior walls · No visible condition | Major | $15,000–50,000 |
| bathrooms · No visible condition | Major | $15,000–50,000 |
| kitchen · No visible condition | Major | $15,000–50,000 |
| roof · No visible damage | Major | $15,000–50,000 |
| Total estimated repair cost · 6 items | $90,000–300,000 |
Value-add ROI direction
- Both exterior renovation — Improves curb appeal and value ↑
- Both interior renovation — Enhances living space and value ↑
- Both roof inspection and repair — Ensures structural integrity and safety ↑
ⓘ Cost ranges are severity-bucket heuristics (US national rule-of-thumb). Get contractor quotes + a written scope before underwriting a rehab budget.
Schools (NCES district)
- District
- Broward
- NCES district ID
- 1200180
- Math proficiency
- 42% ▼ -18.00%
- Reading proficiency
- 53% ▼ -5.00%
- Median HH income
- $52,139
- Composite
- 40.88/100
- National rank
- #3621
- State rank
- #46 of 73 in FL
Livability — Deerfield Beach
- Score
- 75/100
- State rank
- #250
- US rank
- #3970
Category grades
Schools grade is shown separately in the Schools card above.
Census & demographics
- Census place
- Deerfield Beach, FL
- County
- Broward County · 1,963,430 people
- City population
- 61,449
- Metro
- Miami-Fort Lauderdale-Pompano Beach, FL
- Population (ZIP)
- 31,296
- Household income
- $53,254
- Rent vs Own
- Severe rent burden
- 2169.0
Population outlook (Broward County) Hauer SSP2
- Today (2025)
- 2,207,033 people
- By 2030
- 2,360,704 · +7.0%
- By 2040
- 2,661,208 · +20.6%
- By 2050
- 2,946,698 · +33.5%
- By 2075
- 3,602,273 · +63.2%
- By 2100
- 3,970,984 · +79.9%
Race, ethnicity, and origin ACS 2023
- Neighborhood character
- Diverse neighborhood (Simpson 0.61)
- Race & ethnicity
- White 57% Hispanic / Latino 23% Two or more races 19% Black 10% Asian 2%
- Hispanic origin (detail)
- Mexican 1% Puerto Rican 4% Cuban 3%
- Common ancestry
- Estonian 7% Romanian 4% Hispanic 3%
- Foreign-born
- 34% · Canada, Jamaica, Dominican Republic
- Languages at home
- 59% English-only · Spanish 20% Other Indo-European 13% French/Haitian/Cajun 4%
Political lean MEDSL · Broward
- 2024 margin
- D (+17.0) · D 58.0% · R 41.0%
- 2008→2024 swing
- -17.8pp toward R · 2008: 34.7pp · 2024: 17.0pp
- All cycles
- 2024: D+17.0 2020: D+29.8 2016: D+35.0 2012: D+34.9 2008: D+34.7
Not yet ingested
- Civics
- —
Market trends
- HPI YoY
- ▼ -280.44%
- Current HPI
- 323.0166
- Rent YoY
- ▲ 0.10%
- Metro
- Miami-Fort Lauderdale-Pompano Beach, FL
- State GDP YoY
- ▲ 3.28%
- F500 in state
- 36
Industry mix (Fortune 500 HQ in FL)
| Industry | F500 HQs | Revenue |
|---|---|---|
| Industrial Technology | 2 | $29B |
|
||
| Insurance | 2 | $17B |
|
||
| Retail | 1 | $60B |
|
||
| Technology Distribution | 1 | $58B |
|
||
| Homebuilding | 1 | $35B |
|
||
| Technology Manufacturing | 1 | $35B |
|
||
Price history
+210.4% since first listed9 events — show timeline
- 2026-04-30 Pending — MARMLS
- 2026-04-30 Listed $83,500 MARMLS
- 2013-09-09 Sold (MLS) $20,000 MARMLS
- 2013-07-17 Pending — MARMLS
- 2013-07-02 Relisted — MARMLS
- 2013-06-26 Pending — MARMLS
- 2013-06-15 Price Changed $21,900 MARMLS
- 2013-03-31 Listing Removed — MARMLS
- 2012-06-10 Listed $26,900 MARMLS
Cash-flow waterfall
monthlySold comps — $/sqft
last 12 mo · ≤1 miLoading sold comps…