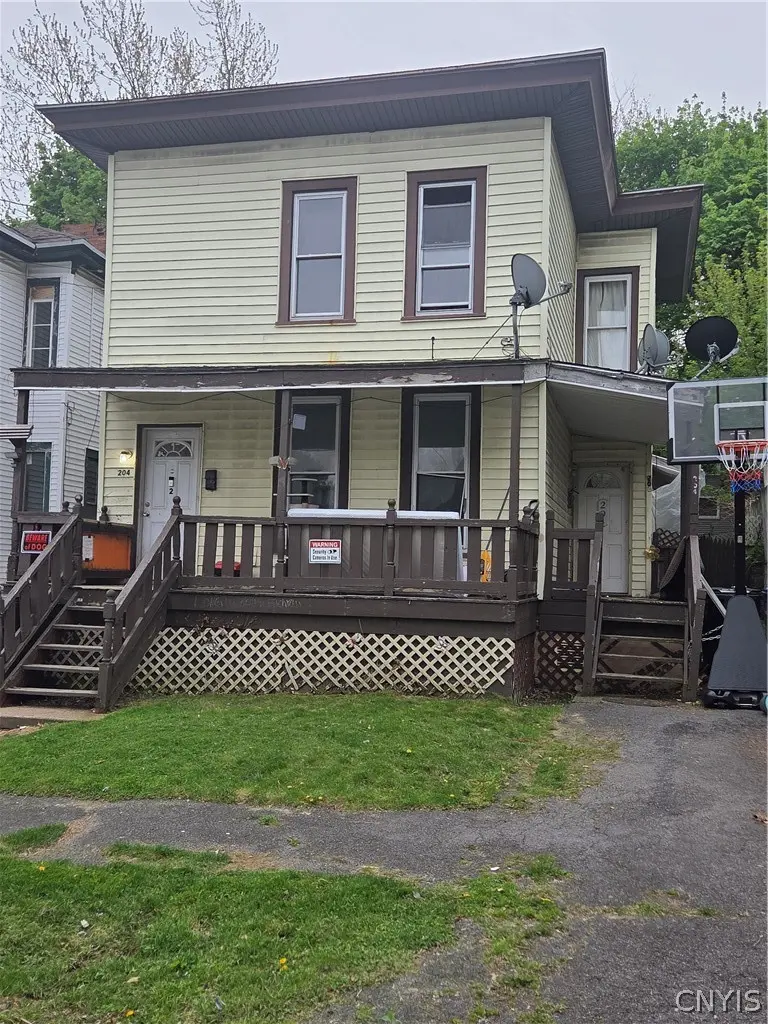
204 Beecher St · Syracuse, NY
Flood risk 7/10 · Major
- FEMA flood zone
- X (unshaded)
- Chance of flooding over 30 yrs
- 0.77%
- Est. flood insurance / yr
- $473 – $860
Fire risk 1/10 · Minimal
- Est. fire insurance / yr
- $691 – $1,283
Heat risk 3/10 · Minor
- Hot days now (above 94°F)
- 7 days/yr
- Hot days in 30 yrs
- 16 days/yr
Wind risk 1/10 · Minimal
- Chance of severe wind over 30 yrs
- 0.0%
Air-quality risk 2/10 · Minimal
- Unhealthy air days now
- 0 days/yr
- Unhealthy air days in 30 yrs
- 1 days/yr
Risk factors via First Street. Map © Google.
Why this score? — see what drove the C+ grade
The composite is a weighted blend of 9 inputs, each scored 0–100. Each bar is that input's sub-score; the figure is the points it added to the 100-point composite (weight × sub-score).
- Cash flow +30.0/30.0
- DSCR +10.0/10.0
- 1% rule +8.6/10.0
- Rent growth +4.6/5.0
- Livability +3.9/5.0
- ARV discount +3.6/15.0
- Condition / age +2.5/5.0
- Schools +1.8/10.0
- Appreciation +0.0/10.0
$159,900
🖨 Deal sheet (PDF) 📄 Offer letter ✓ Due diligence
Listing remarks MLS
This well maintained and updated duplex is ready for its new owners. Based on 2020 financials the property operated at a 36% coc return. Both tenants are long term, 3/5 years, and have been consistently paying rent through the pandemic. Investors do not miss out on adding this long term hold to your portfolio. Rents are solid but could be raised by at least 10%.
Key facts
- Built 1860
- Listed 6 days
Property features AI
Finance
- Other: Owner pays hot water (rent includes hot water)
- Financial info: Property is a 2-unit building with separate gas and electric meters for each unit; Unit 1 actual rent: $830; Unit 2 actual rent: listed (range 0); Operating expenses may include professional management and water/sewer
Exterior
- Parking: On-street parking
- Utilities: Public water (connected); Sewer connected
- Home design: Two-story multi-unit property; Resale condition; City street frontage
- Construction: Vinyl siding; Asphalt and rolled/hot mop roof; Stone foundation; Built as existing (year built details: existing)
- Exterior features: Fully fenced yard; Covered porch
Interior
- Kitchen: Each unit includes an eat-in kitchen
- Bedrooms: Two 3-bedroom units (each unit has 3 bedrooms)
- Flooring: Carpet; Ceramic tile; Hardwood; Varies
- Bathrooms: Two full bathrooms (one in each unit)
- Heating & cooling: Gas forced-air heating
- Interior features: Natural woodwork
- Laundry & utility: Gas water heater
Neighborhood map
What this means for you Summary
Snapshot
- This is a 5-bed/2.0-bath townhouse listed at $160k.
Deal economics
- At list price, monthly cash flow is $656 ($8k/yr) — positive.
- The deal already cash-flows at list — no discount required.
- Meets the 1% rule at list price ($2k rent vs $160k).
- Cap rate 11.6% vs local median 8.2% in Syracuse — top-decile yield for the area; either an underpriced asset or a hidden risk that comps aren't pricing in. Stress-test before assuming the spread holds.
Location & tenants
- Location reads 77/100 on livability (#187 in NY, #2,869 nationally) — a middle-class / working-renter tenant base. Strengths: amenities A+, commute A+, cost of living A+; Watch: schools D+, crime F, employment D-.
- Syracuse City School District (urban): math 18% / reading 26% proficiency, ranked #590 of 590 in NY (top 100%) — low school quality limits family demand, transient renter base, plan for 1-2y turnover; 74% free/reduced lunch — lower-income household profile, screen leases tightly.
- Market conditions: Rents rising fast (+8.4%/yr); 55 active listings in the ZIP; 3 comparable units currently listed for rent nearby; rentals at typical pace (median 22d on market — plan ~3-4 weeks tenant-placement turnaround); 616 units permitted in Onondaga County in 2024 (256 in 5+ unit buildings).
- At $2,171/mo this rent would consume 55% of the median local household income ($47k/yr) (locally 1566% of renters already pay >50% of income on rent) — very limited rent-growth headroom before tenants either downsize or default.
Forward outlook
- Local home prices are declining (-3.0%/yr); year-one equity from $1k of loan paydown is wiped out by about $5k of value loss. Plan a longer hold.
- Onondaga County population projected to shrink 9% by 2050 — rents likely to lag national; underwrite the cash flow, not the appreciation.
- At projected returns (-3.0% appreciation + 8.0% rent growth), your $45k cash investment doubles in ~6 years — after that, you're playing with house money.
Negotiation context
- Only 6 days on market — expect competitive offers; lowballing is unlikely to land.
- 2 sale attempts since 5y ago with the ask held roughly flat each time — persistent listings suggest the price (not the market) is what's stuck; bring a comps-based counter.
- Current owner paid $85k; list at $160k implies a 88% gain — meaningful room to come down on a strong offer.
Risks & watch-outs
- Watch-outs: flood insurance adds $56/mo; built in 1860 — expect roof / HVAC / electrical / plumbing capex.
- Climate carrying-cost: major flood risk — expect insurance premiums to compound above CPI over the hold.
Questions for the listing agent
- Built in 1860 — when were the roof, HVAC, electrical panel, plumbing, and water heater last replaced?
- What's the actual annual flood-insurance premium (NFIP or private), and is the property in a SFHA with mandatory coverage?
- Is there a deadline driving the sale (1031 exchange, divorce, estate, relocation)? That informs how much negotiation room exists.
- Schools are D-rated, which usually means shorter tenancies and higher turnover. Who's the typical renter profile here, and what's been the actual vacancy rate?
- Crime grade is F in this area — have there been break-ins, vandalism, or insurance claims at this property in the last 3 years? What carrier currently insures it and at what premium?
- What's the average days-on-market for RENTAL listings here right now (not sales)? A rising rental-DOM trend means longer vacancies and softer asking-rent achievability than the comps imply.
- What's the recent tenant-quality profile in this submarket — average credit score on applications, eviction rate, late-payment / NSF rate, and stable-employment percentage? A property-management company in the area should have these aggregated.
- How much new for-sale + rental construction is in the pipeline within 1–3 miles? Heavy new supply typically softens prices + rents 12–24 months out; constrained supply supports both.
Investment metrics
- 1% rule
- 1.36% ✓
- Cap rate
- 11.63%
- Cash-on-cash
- 19.06%
- DSCR
- 1.85
- GRM
- 6.1
CMA / ARV
- ARV (median comp)
- $147,014
- List price
- $159,900
- Delta
- 8.76%
- Verdict
- FAIR
- Comps
- 11 within 1.0 mi
Show comp detail 4 sales within ~0.75 mi
| Address | Dist | Beds/Ba | Sqft | Sold | Price | $/sf | Match |
|---|---|---|---|---|---|---|---|
| 208 Beecher St | 0.01mi | 4/2.0 (-1) | 1,806 (-4%) | 17mo | $95,000 | $53 | 73 |
| 403 Howard St | 0.41mi | 4/2.0 (-1) | 1,678 (-11%) | 7mo | $162,000 | $97 | 51 |
| 1209 Butternut St | 0.46mi | 5/2.0 | 2,040 (+8%) | 23mo | $85,000 | $42 | 46 |
| 605 Ash St | 0.39mi | 6/2.0 (+1) | 2,096 (+11%) | 19mo | $130,000 | $62 | 43 |
Match score weights: distance 35% · size 25% · config 20% · recency 20%. Top-matched comps best support the ARV.
Projected returns pro-forma
-3.0% appreciation · 8.0% rent growth · sell at horizon
- IRR
- 14.4%
- Equity multiple
- 1.61×
- Total profit
- $27,323
- Equity at exit
- $23,842
- IRR
- 26.6%
- Equity multiple
- 3.90×
- Total profit
- $129,797
- Equity at exit
- $13,825
Cash invested: $44,772 (down + closing). Projections, not guarantees.
Landlord ↔ Tenant lean methodology
- Overall (STATE)
- 15 Strongly Tenant-Friendly
- State New York
- 15 Strongly Tenant-Friendly · D+10
- County
- — inherits STATE
- City
- — inherits STATE
ZIP-level market 13203
- Home prices YoY
- -11.9%
- Rents YoY
- 8.4%
- Active inventory
- 55
- Price-to-rent
- 6.1×
Monthly cashflow live
- Estimated rent
- $2,171 medium interval (Pro) →
- Mortgage (P&I)
- −$839
- Tax from tax record
- −$99 /mo · $1,185/yr
- Insurance
- −$67
- Flood insurance flood zone
- −$56 /mo · $666/yr
- HOA
- −$0
- Vacancy / Maint / Mgmt
- −$456
- Net cashflow
- $656
Break-even live
Sensitivity live
| Price | -10% $746 | -5% $701 | +0% $656 | +5% $610 | +10% $565 |
|---|---|---|---|---|---|
| Rent | -10% $484 | -5% $570 | +0% $656 | +5% $741 | +10% $827 |
| Rate | -1.0pp $736 | -0.5pp $696 | base $656 | +0.5pp $614 | +1.0pp $572 |
UW: 25.0% down · 7.5% · 30yr · 1.5% tax · 5.0% vac · 8.0% maint · 8.0% mgmt
Financing live
Cash to close
- Down payment
- $39,975
- Closing costs
- $4,797
- Reserves months
- —
- Total cash needed
- —
Loan-product check · same deal, 3 products live
Conventional
25% down · 7.5% · 30yr
- Down + closing
- —
- Monthly P&I
- —
- Monthly cashflow
- —
- DSCR
- —
- Eligible?
- —
Personal DTI + credit; lowest rate.
DSCR
20% down · 8.5% · 30yr
- Down + closing
- —
- Monthly P&I
- —
- Monthly cashflow
- —
- DSCR
- —
- Eligible?
- —
No personal income docs; deal must DSCR.
Hard money
10% down · 12.0% · 12mo
- Down + closing
- —
- Monthly P&I
- —
- Monthly cashflow
- —
- DSCR
- —
- Eligible?
- —
Short-term bridge; refi at stabilization.
Rent comps 3 comps
| Address | Beds | Baths | Sqft | Rent | $/sqft | DOM | Units | Dist |
|---|---|---|---|---|---|---|---|---|
| 746 E Laurel St Unit 1 Syracuse, NY | 4.0 | 2.0 | 1400 | $1,500 | $1.07 | 45d | 1 | 0.15mi |
| 365 Green St Syracuse, NY | 5.0 | 3.5 | 2263 | $3,300 | $1.46 | 22d | 1 | 0.40mi |
| 423 Wendell Ter Syracuse, NY | 4.0 | 1.0 | 1312 | $2,500 | $1.91 | 14d | 1 | 0.90mi |
Listing history 7 events
-
2026-05-07status Pending 279-char remark
-
2026-05-01$159,900 Active 279-char remark
-
2021-03-12soldstatus $85,000 Closed Sale or Rented 364-char remark
Show marketing remark (364 chars)
This well maintained and updated duplex is ready for its new owners. Based on 2020 financials the property operated at a 36% coc return. Both tenants are long term, 3/5 years, and have been consistently paying rent through the pandemic. Investors do not miss out on adding this long term hold to your portfolio. Rents are solid but could be raised by at least 10%.
-
2021-03-11soldstatus $85,000
-
2021-02-01status Under Contract- Do Not Show 364-char remark
Show marketing remark (364 chars)
This well maintained and updated duplex is ready for its new owners. Based on 2020 financials the property operated at a 36% coc return. Both tenants are long term, 3/5 years, and have been consistently paying rent through the pandemic. Investors do not miss out on adding this long term hold to your portfolio. Rents are solid but could be raised by at least 10%.
-
2021-01-27$87,900 Active 364-char remark
Show marketing remark (364 chars)
This well maintained and updated duplex is ready for its new owners. Based on 2020 financials the property operated at a 36% coc return. Both tenants are long term, 3/5 years, and have been consistently paying rent through the pandemic. Investors do not miss out on adding this long term hold to your portfolio. Rents are solid but could be raised by at least 10%.
-
1997-09-03soldstatus $28,005
ⓘ Source: listings_history table (triggers on properties + properties_extension) + one-shot
backfill from property_details.listing_events for pre-trigger history.
Tax reassessment forecast NY · Partial reset (capped growth)
- Current annual tax
- $1,185 · $99/mo
- Projected year-2 tax
- $1,944 · $162/mo
- Expected delta
- +$759/yr (+$63/mo · 64.0%)
ⓘ Screening estimate from a state-policy table — verify with the county assessor before closing.
Climate risk First Street
- Flood 7/10 Severe FEMA zone X (unshaded) · 77% chance over 30 yrs
- Wildfire 1/10 Low
- Heat 3/10 Moderate 7 d/yr ≥94°F today · 16 d/yr by 30 yrs out
- Wind 1/10 Low 0% chance of damaging wind over 30 yrs
- Air quality 2/10 Low 0 unhealthy d/yr today · 1 by 30 yrs out
Nearby sold comps map
Loading sold comps map…
Walkable amenities ~0.75 mi
Loading nearby amenities…
Taxation est. · year 1
- Rental income
- $26,052
- − Mortgage interest
- −$8,957
- − Property taxes
- −$1,185
- − Insurance
- −$1,466
- − Repairs & maintenance
- −$2,084
- − Management
- −$2,084
- − Depreciation
- −$4,652
- Taxable income
- $5,624
- Est. tax owed @ 24.0%
- −$1,350
- After-tax cash flow
- $6,518/yr
For passive investors: Depreciation is non-cash, so a rental often shows a tax loss while cash-flowing — sheltering income. Rental losses are passive: they offset passive income freely, and up to $25,000/yr can offset ordinary (W-2) income if you actively participate and your MAGI is under $100k (phasing out to $0 by $150k); unused losses carry forward. On sale, claimed depreciation is recaptured at up to 25%, and gains may owe capital-gains tax (a 1031 exchange can defer both). Figures are a year-1 estimate at your 24.0% rate — not tax advice; consult a CPA.
Schools (NCES district)
- District
- Syracuse City School District
- NCES district ID
- 3628590
- Math proficiency
- 18% ▼ -5.00%
- Reading proficiency
- 26% ▬ 0.00%
- Median HH income
- $32,097
- Composite
- 17.83/100
- National rank
- #9007
- State rank
- #590 of 590 in NY
Livability — Syracuse
- Score
- 77/100
- State rank
- #187
- US rank
- #2869
Category grades
Schools grade is shown separately in the Schools card above.
Census & demographics
- Census place
- Syracuse, NY
- County
- Onondaga County · 247,257 people
- City population
- 152,627
- Metro
- Syracuse, NY
- Population (ZIP)
- 16,180
- Household income
- $46,997
- Rent vs Own
- Severe rent burden
- 1566.0
Population outlook (Onondaga County) Hauer SSP2
- Today (2025)
- 467,894 people
- By 2030
- 463,381 · -1.0%
- By 2040
- 447,697 · -4.3%
- By 2050
- 426,399 · -8.9%
- By 2075
- 373,661 · -20.1%
- By 2100
- 307,967 · -34.2%
Race, ethnicity, and origin ACS 2023
- Neighborhood character
- Diverse neighborhood (Simpson 0.67)
- Race & ethnicity
- White 52% Black 22% Hispanic / Latino 11% Two or more races 9% Asian 7%
- Hispanic origin (detail)
- Puerto Rican 6% Cuban 2%
- Common ancestry
- Romanian 3% Lithuanian 2% Iranian 2%
- Foreign-born
- 13% · Canada, India, Philippines
- Languages at home
- 81% English-only · Spanish 6% Other Indo-European 3% Other Asian/Pacific 3%
Political lean MEDSL · Onondaga
- 2024 margin
- D (+17.3) · D 58.6% · R 41.4%
- 2008→2024 swing
- -3.0pp toward R · 2008: 20.3pp · 2024: 17.3pp
- All cycles
- 2024: D+17.3 2020: D+20.6 2016: D+12.8 2012: D+21.1 2008: D+20.3
Not yet ingested
- Civics
- —
Market trends
- HPI YoY
- ▼ -35.69%
- Current HPI
- 263.2588
- Rent YoY
- ▲ 8.39%
- Metro
- Syracuse, NY
- State GDP YoY
- ▲ 2.60%
- F500 in state
- 92
Industry mix (Fortune 500 HQ in NY)
| Industry | F500 HQs | Revenue |
|---|---|---|
| Financial Services | 10 | $950B |
|
||
| Consumer Goods | 9 | $162B |
|
||
| Insurance | 4 | $225B |
|
||
| Telecommunications | 2 | $144B |
|
||
| Pharmaceuticals | 2 | $112B |
|
||
| Media / Entertainment | 2 | $69B |
|
||
Price history
+471.0% since first listed7 events — show timeline
- 2026-05-07 Pending — CNYIS
- 2026-05-01 Listed $159,900 CNYIS
- 2021-03-12 Sold (MLS) $85,000 CNYIS
- 2021-03-11 Sold (Public Records) $85,000 Public Records
- 2021-02-01 Pending — CNYIS
- 2021-01-27 Listed $87,900 CNYIS
- 1997-09-03 Sold (Public Records) $28,005 Public Records
Property tax history
+0.0%/yrLatest (2025): $1,185 · +1.1% YoY. Source: county tax records.
Cash-flow waterfall
monthlySold comps — $/sqft
last 12 mo · ≤1 miLoading sold comps…