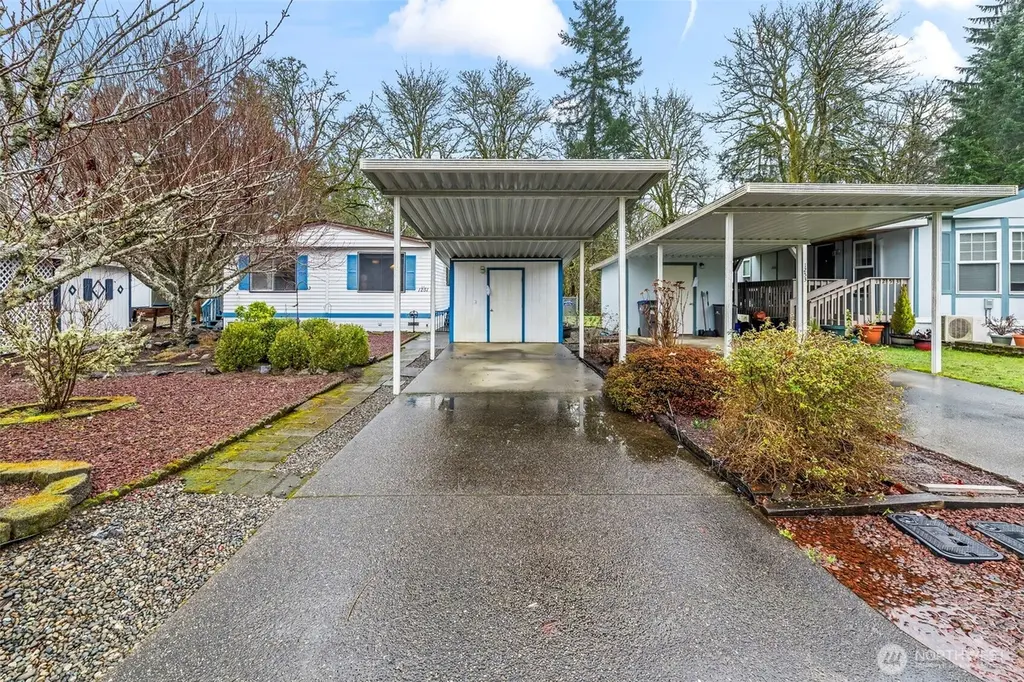
1251 SE Carl Pickle Dr · Port Orchard, WA
Flood risk 1/10 · Minimal
- FEMA flood zone
- X (unshaded)
- Chance of flooding over 30 yrs
- 0.0%
- Est. flood insurance / yr
- $507 – $1,088
Fire risk 1/10 · Minimal
- Est. fire insurance / yr
- $604 – $1,122
Heat risk 3/10 · Minor
- Hot days now (above 86°F)
- 7 days/yr
- Hot days in 30 yrs
- 14 days/yr
Wind risk 1/10 · Minimal
- Chance of severe wind over 30 yrs
- —
Air-quality risk 7/10 · Major
- Unhealthy air days now
- 9 days/yr
- Unhealthy air days in 30 yrs
- 10 days/yr
Risk factors via First Street. Map © Google.
Why this score? — see what drove the B grade
The composite is a weighted blend of 9 inputs, each scored 0–100. Each bar is that input's sub-score; the figure is the points it added to the 100-point composite (weight × sub-score).
- Cash flow +30.0/30.0
- 1% rule +10.0/10.0
- DSCR +10.0/10.0
- ARV discount +8.9/15.0
- Schools +5.2/10.0
- Livability +4.0/5.0
- Condition / age +3.8/5.0
- Rent growth +2.6/5.0
- Appreciation +0.0/10.0
$80,000
🖨 Deal sheet (PDF) 📄 Offer letter ✓ Due diligence
Listing remarks
Welcome home to this well-maintained 960 sq ft, 2-bedroom manufactured home located in the highly sought-after Orchard Bluff 55+ community. Known for its peaceful setting and strong sense of community, Orchard Bluff is a favorite among buyers looking for comfortable, low-maintenance living. Enjoy the convenience of an excellent location with easy access to Highway 16, making trips to Bremerton, Port Orchard, and surrounding areas a breeze. Grocery stores, restaurants, and fast-dining options are just minutes away, offering everyday convenience without sacrificing a quiet residential feel. This home offers a functional layout with comfortable living spaces, perfect for downsizing or simplify
Key facts
- Restaurants nearby
- Excellent location
- Built 1975
Tags
Neighborhood map
What this means for you Summary
Snapshot
- This is a 2-bed/1.5-bath manufactured listed at $80k. Condition is rated good.
Deal economics
- At list price, monthly cash flow is $1k ($13k/yr) — positive.
- The deal already cash-flows at list — no discount required.
- Meets the 1% rule at list price ($2k rent vs $80k).
- Recommended offer: $73k (9.0% below list) — sets the bar for market timing.
- Cap rate 22.1% vs local median 3.0% in Port Orchard — top-decile yield for the area; either an underpriced asset or a hidden risk that comps aren't pricing in. Stress-test before assuming the spread holds.
Location & tenants
- Location reads 79/100 on livability (#110 in WA, #2,167 nationally) — a middle-class / working-renter tenant base. Strengths: amenities A+, employment A+, housing A+; Watch: crime D-, commute F, cost of living F.
- South Kitsap School District (suburban): math 52% / reading 64% proficiency, ranked #71 of 291 in WA (top 24%) — acceptable for families but not a draw, mixed tenant base, ~2y average lease.
- Market conditions: Rents flat; 255 active listings in the ZIP; 25 comparable units currently listed for rent nearby; rentals at typical pace (median 23d on market — plan ~3-4 weeks tenant-placement turnaround); 48% of comp listings sitting > 30 days — soft ceiling on asking rent; solid renter incomes; 1,294 units permitted in Kitsap County in 2024 (302 in 5+ unit buildings).
Forward outlook
- Local home prices are declining (-3.0%/yr); year-one equity from $553 of loan paydown is wiped out by about $2k of value loss. Plan a longer hold.
- Kitsap County population projected at +8% by 2050 — modest demand growth; plan on rents tracking national, not racing it.
- At projected returns (-3.0% appreciation + 0.3% rent growth), your $22k cash investment doubles in ~3 years — after that, you're playing with house money.
Negotiation context
- It's been on market 91 days — a 9% lower offer ($73k) is reasonable based on typical stale-listing flexibility.
- 3 sale attempts; this cycle's ask has dropped $45k (36%) from the opening price — seller is motivated, your offer sets the floor, not the list.
Questions for the listing agent
- It's been on market 91 days. Have you received any prior offers? Is the seller open to a 9% concession, seller financing, or rate buy-down credit?
- Built in 1975 — when were the roof, HVAC, electrical panel, plumbing, and water heater last replaced?
- Why hasn't it sold? Are there any deal-killer items the seller is aware of (foundation, flood, title, zoning, code violations)?
- Is there a deadline driving the sale (1031 exchange, divorce, estate, relocation)? That informs how much negotiation room exists.
- Schools are A-rated — typically a magnet for longer-tenancy family renters. What's the average tenant stay here, and is there a school-zone premium baked into asking?
- Crime grade is D in this area — have there been break-ins, vandalism, or insurance claims at this property in the last 3 years? What carrier currently insures it and at what premium?
- What's the average days-on-market for RENTAL listings here right now (not sales)? A rising rental-DOM trend means longer vacancies and softer asking-rent achievability than the comps imply.
- What's the recent tenant-quality profile in this submarket — average credit score on applications, eviction rate, late-payment / NSF rate, and stable-employment percentage? A property-management company in the area should have these aggregated.
- How much new for-sale + rental construction is in the pipeline within 1–3 miles? Heavy new supply typically softens prices + rents 12–24 months out; constrained supply supports both.
Investment metrics
- 1% rule
- 2.55% ✓
- Cap rate
- 22.13%
- Cash-on-cash
- 56.56%
- DSCR
- 3.52
- GRM
- 3.3
CMA / ARV
- ARV (median comp)
- $82,500
- List price
- $80,000
- Delta
- -3.03%
- Verdict
- FAIR
- Comps
- 3 within 1.0 mi
Show comp detail 4 sales within ~0.75 mi
| Address | Dist | Beds/Ba | Sqft | Sold | Price | $/sf | Match |
|---|---|---|---|---|---|---|---|
| 1251 SE Carl Pickle Dr | 0.00mi | 2/1.5 | 960 (0%) | 0mo | $69,500 | $72 | 100 |
| 1260 SE Carl Pickle Dr Spc 80 | 0.05mi | 2/2.0 | 891 (-7%) | 2mo | $120,000 | $135 | 82 |
| 1297 SE Carl Pickel Dr | 0.13mi | 3/1.5 (+1) | 840 (-12%) | 1mo | $82,500 | $98 | 68 |
| 1278 SE Carl Pickel Dr | 0.06mi | 2/2.0 | 868 (-10%) | 17mo | $75,000 | $86 | 65 |
Match score weights: distance 35% · size 25% · config 20% · recency 20%. Top-matched comps best support the ARV.
Projected returns pro-forma
-3.0% appreciation · 0.35% rent growth · sell at horizon
- IRR
- 51.9%
- Equity multiple
- 3.19×
- Total profit
- $49,017
- Equity at exit
- $11,928
- IRR
- 56.2%
- Equity multiple
- 5.86×
- Total profit
- $108,806
- Equity at exit
- $6,917
Cash invested: $22,400 (down + closing). Projections, not guarantees.
Landlord ↔ Tenant lean methodology
- Overall (STATE)
- 28 Tenant-Leaning
- State Washington
- 28 Tenant-Leaning · D+8
- County
- — inherits STATE
- City
- — inherits STATE
ZIP-level market 98366
- Rents YoY
- 0.3%
- Active inventory
- 255
- Price-to-rent
- 3.3×
Monthly cashflow live
- Estimated rent
- $2,036 high interval (Pro) →
- Mortgage (P&I)
- −$420
- Tax est. 1.5%
- −$100 /mo · $1,200/yr
- Insurance
- −$33
- HOA
- −$0
- Vacancy / Maint / Mgmt
- −$428
- Net cashflow
- $1,056
Break-even live
Sensitivity live
| Price | -10% $1,111 | -5% $1,083 | +0% $1,056 | +5% $1,028 | +10% $1,000 |
|---|---|---|---|---|---|
| Rent | -10% $895 | -5% $975 | +0% $1,056 | +5% $1,136 | +10% $1,217 |
| Rate | -1.0pp $1,096 | -0.5pp $1,076 | base $1,056 | +0.5pp $1,035 | +1.0pp $1,014 |
UW: 25.0% down · 7.5% · 30yr · 1.5% tax · 5.0% vac · 8.0% maint · 8.0% mgmt
Financing live
Cash to close
- Down payment
- $20,000
- Closing costs
- $2,400
- Reserves months
- —
- Total cash needed
- —
Loan-product check · same deal, 3 products live
Conventional
25% down · 7.5% · 30yr
- Down + closing
- —
- Monthly P&I
- —
- Monthly cashflow
- —
- DSCR
- —
- Eligible?
- —
Personal DTI + credit; lowest rate.
DSCR
20% down · 8.5% · 30yr
- Down + closing
- —
- Monthly P&I
- —
- Monthly cashflow
- —
- DSCR
- —
- Eligible?
- —
No personal income docs; deal must DSCR.
Hard money
10% down · 12.0% · 12mo
- Down + closing
- —
- Monthly P&I
- —
- Monthly cashflow
- —
- DSCR
- —
- Eligible?
- —
Short-term bridge; refi at stabilization.
Rent comps 25 comps
| Address | Beds | Baths | Sqft | Rent | $/sqft | DOM | Units | Dist |
|---|---|---|---|---|---|---|---|---|
| 2843 Harold Dr SE Unit B Port Orchard, WA | 2.0 | 2.0 | 1054 | $1,725 | $1.64 | 22d | 1 | 0.38mi |
| 240 Poplar St Port Orchard, WA | 3.0 | 2.0 | 1022 | $1,995 | $1.95 | 46d | 1 | 0.43mi |
| 1800 Sidney Ave Port Orchard, WA | 1.0–3.0 | 1.0–2.0 | 869 | $1,904 | $2.19 | 15d | 13 | 0.49mi |
| 1324 Garrison Ave Port Orchard, WA | 2.0 | 1.0 | 864 | $2,000 | $2.31 | 22d | 1 | 0.68mi |
| 515 Forest Park St Port Orchard, WA | 3.0 | 2.0 | 1107 | $2,650 | $2.39 | 15d | 1 | 0.70mi |
| 1481 SE Blueberry Rd Port Orchard, WA | 1.0–2.0 | 1.0–2.0 | 847 | $2,295 | $2.71 | 45d | 11 | 0.72mi |
| 2250 Sidney Ave Port Orchard, WA | 1.0–2.0 | 1.0 | 700 | $1,625 | $2.32 | 45d | 4 | 0.73mi |
| 1511 SE Blueberry Rd Unit 301 Port Orchard, WA | 2.0 | 1.5 | 880 | $2,175 | $2.47 | 45d | 1 | 0.73mi |
| 1511 SE Blueberry Rd Unit 104 Port Orchard, WA | 2.0 | 1.0 | 820 | $2,150 | $2.62 | 45d | 1 | 0.73mi |
| 1491 SE Blueberry Rd Unit 206 Port Orchard, WA | 2.0 | 2.0 | 1000 | $2,195 | $2.19 | 22d | 1 | 0.74mi |
| 1491 SE Blueberry Rd Unit 308 Port Orchard, WA | 2.0 | 2.0 | 1000 | $2,295 | $2.29 | 15d | 1 | 0.74mi |
| 1501 SE Blueberry Rd Apt 106 Port Orchard, WA | 2.0 | 1.0 | 820 | $2,150 | $2.62 | 45d | 1 | 0.75mi |
| 1501 SE Blueberry Rd Unit 108 Port Orchard, WA | 2.0 | 1.0 | 820 | $2,175 | $2.65 | 45d | 1 | 0.75mi |
| 1501 SE Blueberry Rd Apt 305 Port Orchard, WA | 2.0 | 1.5 | 930 | $2,150 | $2.31 | 45d | 1 | 0.75mi |
| 1501 SE Blueberry Rd Apt 107 Port Orchard, WA | 2.0 | 1.0 | 930 | $2,125 | $2.28 | 45d | 1 | 0.75mi |
| 1501 SE Blueberry Rd Apt 307 Port Orchard, WA | 2.0 | 1.5 | 930 | $2,175 | $2.34 | 45d | 1 | 0.75mi |
| 1329 Sherman Ave Port Orchard, WA | 2.0 | 1.0 | 912 | $2,100 | $2.30 | 45d | 1 | 0.76mi |
| 2099 Jefferson Ave SE Port Orchard, WA | 1.0–2.0 | 1.0 | 750 | $1,705 | $2.27 | 22d | 4 | 0.88mi |
| 502 Kendall St Port Orchard, WA | 2.0 | 1.5 | 1008 | $1,950 | $1.93 | 15d | 1 | 1.07mi |
| 914 Taylor St E Port Orchard, WA | 1.0 | 1.0 | 544 | $1,750 | $3.22 | 45d | 1 | 1.18mi |
| 2192 SE Sedgwick Rd Port Orchard, WA | 2.0 | 1.0–2.0 | 739 | $2,450 | $3.31 | 15d | 22 | 1.20mi |
| 1934 Lincoln Ave SE Unit 203 Port Orchard, WA | 1.0 | 1.0 | 625 | $1,400 | $2.24 | 22d | 1 | 1.25mi |
| 4210 Eastwood Ave SE Port Orchard, WA | 3.0 | 2.0 | 1008 | $2,800 | $2.78 | 22d | 1 | 1.28mi |
| 4999 Sidney Rd SW Port Orchard, WA | 1.0–3.0 | 1.0–2.0 | 961 | $2,160 | $2.25 | 15d | 21 | 1.34mi |
| 3390 Starboard Ln SE Port Orchard, WA | 2.0–3.0 | 2.0 | 975 | $1,995 | $2.05 | 15d | 3 | 1.34mi |
Listing history 8 events
-
2026-05-17status Pending
-
2026-05-11price $80,000
-
2026-05-09status Active
-
2026-05-03status Pending
-
2026-04-28status Active
-
2026-04-24status Pending
-
2026-03-17price $110,000
-
2026-02-05$125,000 Active
ⓘ Source: listings_history table (triggers on properties + properties_extension) + one-shot
backfill from property_details.listing_events for pre-trigger history.
Climate risk First Street
- Flood 1/10 Low FEMA zone X (unshaded) · 0% chance over 30 yrs
- Wildfire 1/10 Low
- Heat 3/10 Moderate 7 d/yr ≥86°F today · 14 d/yr by 30 yrs out
- Wind 1/10 Low
- Air quality 7/10 Severe 9 unhealthy d/yr today · 10 by 30 yrs out
Nearby sold comps map
Loading sold comps map…
Walkable amenities ~0.75 mi
Loading nearby amenities…
Taxation est. · year 1
- Rental income
- $24,434
- − Mortgage interest
- −$4,481
- − Property taxes
- −$1,200
- − Insurance
- −$400
- − Repairs & maintenance
- −$1,955
- − Management
- −$1,955
- − Depreciation
- −$2,327
- Taxable income
- $12,116
- Est. tax owed @ 24.0%
- −$2,908
- After-tax cash flow
- $9,761/yr
For passive investors: Depreciation is non-cash, so a rental often shows a tax loss while cash-flowing — sheltering income. Rental losses are passive: they offset passive income freely, and up to $25,000/yr can offset ordinary (W-2) income if you actively participate and your MAGI is under $100k (phasing out to $0 by $150k); unused losses carry forward. On sale, claimed depreciation is recaptured at up to 25%, and gains may owe capital-gains tax (a 1031 exchange can defer both). Figures are a year-1 estimate at your 24.0% rate — not tax advice; consult a CPA.
Condition & rehab AI · 12 photos
This well-maintained 960 sq ft manufactured home in Orchard Bluff 55+ community is ready for immediate move-in with minor cosmetic updates to enhance its curb appeal and value.
Value-add opportunities
- Resale Paint exterior siding — Enhances curb appeal and value.
- Resale Replace carpet in living areas — Fresh carpet improves aesthetics and comfort.
- Rental Clean and maintain HVAC system — Ensures comfort and reduces maintenance costs for tenants.
Renovation cost estimate screening
Value-add ROI direction
- Resale Paint exterior siding — Enhances curb appeal and value. ↑
- Resale Replace carpet in living areas — Fresh carpet improves aesthetics and comfort. ↑
- Rental Clean and maintain HVAC system — Ensures comfort and reduces maintenance costs for tenants. ↑
ⓘ Cost ranges are severity-bucket heuristics (US national rule-of-thumb). Get contractor quotes + a written scope before underwriting a rehab budget.
Schools (NCES district)
- District
- South Kitsap School District
- NCES district ID
- 5308160
- Math proficiency
- 52% ▲ 2.00%
- Reading proficiency
- 64% ▲ 3.00%
- Median HH income
- $62,824
- Composite
- 52.31/100
- National rank
- #3445
- State rank
- #71 of 291 in WA
Livability — Port Orchard
- Score
- 79/100
- State rank
- #110
- US rank
- #2167
Category grades
Schools grade is shown separately in the Schools card above.
Census & demographics
- Census place
- Port Orchard, WA
- County
- Kitsap County · 243,099 people
- City population
- 68,721
- Metro
- Bremerton-Silverdale-Port Orchard, WA
- Population (ZIP)
- 36,965
- Household income
- $92,011
- Rent vs Own
- Severe rent burden
- 1031.0
Population outlook (Kitsap County) Hauer SSP2
- Today (2025)
- 277,525 people
- By 2030
- 285,040 · +2.7%
- By 2040
- 294,957 · +6.3%
- By 2050
- 300,622 · +8.3%
- By 2075
- 315,580 · +13.7%
- By 2100
- 304,340 · +9.7%
Race, ethnicity, and origin ACS 2023
- Neighborhood character
- Predominantly White (74%)
- Race & ethnicity
- White 74% Two or more races 13% Hispanic / Latino 11% Asian 4% Black 2%
- Hispanic origin (detail)
- Mexican 5% Puerto Rican 3%
- Common ancestry
- Italian 9% Portuguese 4% Slovak 3%
- Foreign-born
- 5% · Canada, China, South Korea
- Languages at home
- 93% English-only · Spanish 3% Tagalog/Filipino 1% Other Asian/Pacific 1%
Political lean MEDSL · Kitsap
- 2024 margin
- Strong D (+20.9) · D 58.8% · R 37.9% · Other 3.3%
- 2008→2024 swing
- +8.6pp toward D · 2008: 12.3pp · 2024: 20.9pp
- All cycles
- 2024: D+20.9 2020: D+18.1 2016: D+11.6 2012: D+11.1 2008: D+12.3
Not yet ingested
- Civics
- —
Market trends
- HPI YoY
- ▼ -432.79%
- Current HPI
- 354.2856
- Rent YoY
- ▲ 0.35%
- Metro
- Bremerton-Silverdale-Port Orchard, WA
- State GDP YoY
- ▲ 4.65%
- F500 in state
- 22
Industry mix (Fortune 500 HQ in WA)
| Industry | F500 HQs | Revenue |
|---|---|---|
| Retail | 2 | $269B |
|
||
| Technology / Retail | 1 | $638B |
|
||
| Technology | 1 | $245B |
|
||
| Telecommunications | 1 | $38B |
|
||
| Food / Beverage | 1 | $36B |
|
||
| Automotive / Trucks | 1 | $34B |
|
||
Price history
-36.0% since first listed8 events — show timeline
- 2026-05-17 Pending — NWMLS as Distributed by MLS Grid
- 2026-05-11 Price Changed $80,000 NWMLS as Distributed by MLS Grid
- 2026-05-09 Relisted — NWMLS as Distributed by MLS Grid
- 2026-05-03 Pending — NWMLS as Distributed by MLS Grid
- 2026-04-28 Relisted — NWMLS as Distributed by MLS Grid
- 2026-04-24 Pending — NWMLS as Distributed by MLS Grid
- 2026-03-17 Price Changed $110,000 NWMLS as Distributed by MLS Grid
- 2026-02-05 Listed $125,000 NWMLS as Distributed by MLS Grid
Cash-flow waterfall
monthlySold comps — $/sqft
last 12 mo · ≤1 miLoading sold comps…