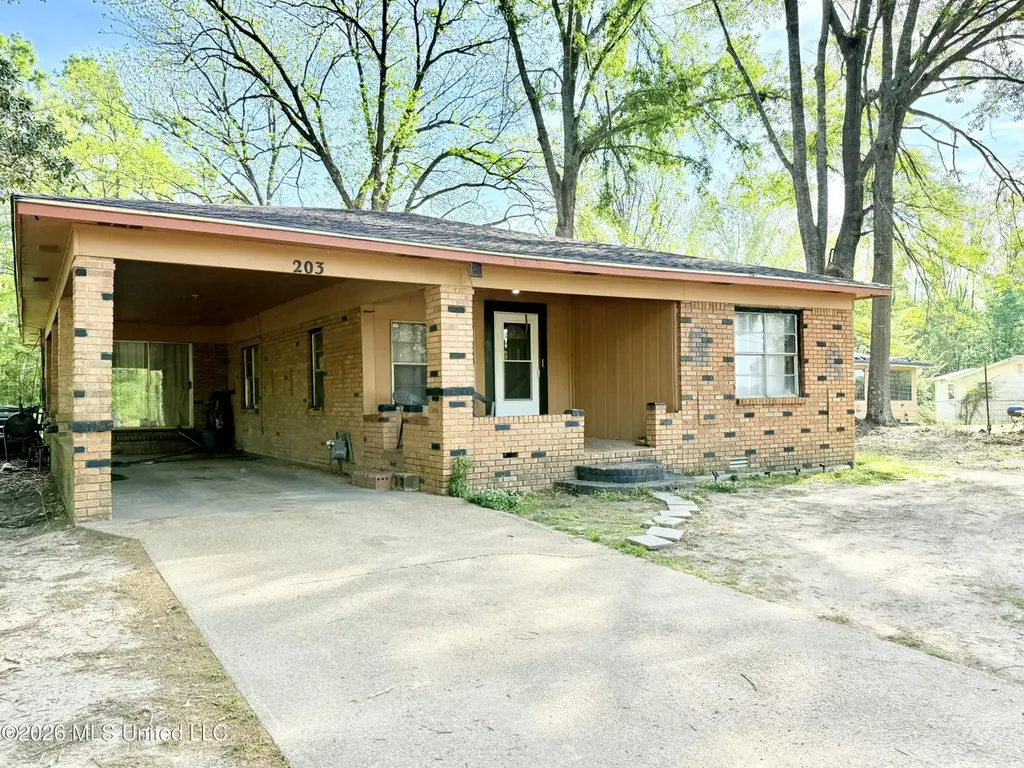
203 Branch St · Winona, MS
Flood risk 1/10 · Minimal
- FEMA flood zone
- X (unshaded)
- Chance of flooding over 30 yrs
- 0.0%
- Est. flood insurance / yr
- $507 – $1,088
Fire risk 3/10 · Minor
- Est. fire insurance / yr
- $1,241 – $2,305
Heat risk 7/10 · Major
- Hot days now (above 107°F)
- 7 days/yr
- Hot days in 30 yrs
- 21 days/yr
Wind risk 6/10 · Moderate
- Chance of severe wind over 30 yrs
- 27.0%
Air-quality risk 1/10 · Minimal
- Unhealthy air days now
- 0 days/yr
- Unhealthy air days in 30 yrs
- 0 days/yr
Risk factors via First Street. Map © Google.
Why this score? — see what drove the B+ grade
The composite is a weighted blend of 9 inputs, each scored 0–100. Each bar is that input's sub-score; the figure is the points it added to the 100-point composite (weight × sub-score).
- Cash flow +30.0/30.0
- 1% rule +10.0/10.0
- DSCR +10.0/10.0
- ARV discount +7.5/15.0
- Appreciation +7.0/10.0
- Schools +5.0/10.0
- Livability +3.4/5.0
- Rent growth +2.5/5.0
- Condition / age +2.5/5.0
$65,000
🖨 Deal sheet 📄 Offer letter ✓ Due diligence
Listing remarks
Investor Opportunity at 203 Branch Drive in Winona, Mississippi! This property presents a strong opportunity for investors looking to expand their portfolio with a value-add asset in a growing rental market. Located in a quiet residential area, this home offers solid potential for renovation, rental income, or resale. With a functional layout and good bones, 203 Branch Drive is ideal for a fix-and-flip project or a long-term buy-and-hold investment. The property provides the chance to add value through cosmetic updates and improvements, making it a smart choice for those seeking to maximize return on investment. Winona's affordable entry price point and steady rental demand make it an attr
Key facts
- Functional layout
- 0.33 acre lot
- Parking
Tags
Property features AI
Exterior
- Parking: Carport (1 space)
- Utilities: Public water; Public sewer; Electricity connected; Sewer connected
- Home design: Single family residence; House; One level
- Construction: Brick construction; Shingle roof; Conventional foundation; Built according to public records
- Exterior features: Front porch; City lot; Corner lot
Interior
- Kitchen: Includes refrigerator
- Bathrooms: 2 full bathrooms
- Heating & cooling: Central heating; Central air conditioning
- Interior features: Refrigerator
Neighborhood map
What this means for you Summary
Snapshot
- This is a 3-bed/2.0-bath single-family listed at $65k.
Deal economics
- At list price, monthly cash flow is $435 ($5k/yr) — positive.
- The deal already cash-flows at list — no discount required.
- Meets the 1% rule at list price ($1k rent vs $65k).
- Recommended offer: $61k (6.0% below list) — sets the bar for market timing.
Location & tenants
- Location reads 68/100 on livability (#61 in MS) — a middle-class / working-renter tenant base. Strengths: cost of living A+, housing A+, health & safety A+; Watch: schools F, amenities F, commute F.
- Market conditions: 40 active listings in the ZIP; 92 units permitted in Montgomery County in 2024 (82 in 5+ unit buildings).
Forward outlook
- In year one you build about $3k of equity ($449 loan paydown + $3k appreciation (4.0% local appreciation)).
- Montgomery County population projected at -35% by 2050 — secular population decline; favor cash flow + early exit over multi-decade hold.
- At projected returns (4.0% appreciation + 3.0% rent growth), your $18k cash investment doubles in ~3 years — after that, you're playing with house money.
Negotiation context
- It's been on market 83 days — a 6% lower offer ($61k) is reasonable based on typical stale-listing flexibility.
Risks & watch-outs
- Climate carrying-cost: major wind risk, 27% chance of damaging wind over 30y; extreme-heat days projected 7→21/yr by 2055 (HVAC capex compounding) — expect insurance premiums to compound above CPI over the hold.
Questions for the listing agent
- It's been on market 83 days. Have you received any prior offers? Is the seller open to a 6% concession, seller financing, or rate buy-down credit?
- Built in 1978 — when were the roof, HVAC, electrical panel, plumbing, and water heater last replaced?
- Why hasn't it sold? Are there any deal-killer items the seller is aware of (foundation, flood, title, zoning, code violations)?
- Is there a deadline driving the sale (1031 exchange, divorce, estate, relocation)? That informs how much negotiation room exists.
- Schools are F-rated, which usually means shorter tenancies and higher turnover. Who's the typical renter profile here, and what's been the actual vacancy rate?
- What's the average days-on-market for RENTAL listings here right now (not sales)? A rising rental-DOM trend means longer vacancies and softer asking-rent achievability than the comps imply.
- What's the recent tenant-quality profile in this submarket — average credit score on applications, eviction rate, late-payment / NSF rate, and stable-employment percentage? A property-management company in the area should have these aggregated.
- How much new for-sale + rental construction is in the pipeline within 1–3 miles? Heavy new supply typically softens prices + rents 12–24 months out; constrained supply supports both.
Investment metrics
- 1% rule
- 1.75% ✓
- Cap rate
- 14.32%
- Cash-on-cash
- 28.66%
- DSCR
- 2.28
- GRM
- 4.8
CMA / ARV
No comps found within radius.
Projected returns pro-forma
4.01% appreciation · 3.0% rent growth · sell at horizon
- IRR
- 36.3%
- Equity multiple
- 3.15×
- Total profit
- $39,090
- Equity at exit
- $33,008
- IRR
- 35.5%
- Equity multiple
- 6.29×
- Total profit
- $96,205
- Equity at exit
- $54,028
Cash invested: $18,200 (down + closing). Projections, not guarantees.
Landlord ↔ Tenant lean methodology
- Overall (STATE)
- 90 Strongly Landlord-Friendly
- State Mississippi
- 90 Strongly Landlord-Friendly · R+11
- County
- — inherits STATE
- City
- — inherits STATE
ZIP-level market 38967
- Home prices YoY
- 3.2%
- Active inventory
- 40
- Price-to-rent
- 4.8×
Monthly cashflow live
- Estimated rent
- $1,136 medium interval (Pro) →
- Mortgage (P&I)
- −$341
- Tax from tax record
- −$95 /mo · $1,139/yr
- Insurance
- −$27
- HOA
- −$0
- Vacancy / Maint / Mgmt
- −$239
- Net cashflow
- $435
Break-even live
UW: 25.0% down · 7.5% · 30yr · 1.5% tax · 5.0% vac · 8.0% maint · 8.0% mgmt
Financing live
Cash to close
- Down payment
- $16,250
- Closing costs
- $1,950
- Reserves months
- —
- Total cash needed
- —
Loan-product check · same deal, 3 products live
Conventional
25% down · 7.5% · 30yr
- Down + closing
- —
- Monthly P&I
- —
- Monthly cashflow
- —
- DSCR
- —
- Eligible?
- —
Personal DTI + credit; lowest rate.
DSCR
20% down · 8.5% · 30yr
- Down + closing
- —
- Monthly P&I
- —
- Monthly cashflow
- —
- DSCR
- —
- Eligible?
- —
No personal income docs; deal must DSCR.
Hard money
10% down · 12.0% · 12mo
- Down + closing
- —
- Monthly P&I
- —
- Monthly cashflow
- —
- DSCR
- —
- Eligible?
- —
Short-term bridge; refi at stabilization.
Listing history 15 events
-
2026-06-18days on market $65,000 Active 83 DOM
-
2026-06-17days on market $65,000 Active 82 DOM
-
2026-06-16days on market $65,000 Active 81 DOM
-
2026-06-15days on market $65,000 Active 80 DOM
-
2026-06-13days on market $65,000 Active 78 DOM
-
2026-06-12days on market $65,000 Active 77 DOM
-
2026-06-09days on market $65,000 Active 74 DOM
-
2026-06-08days on market $65,000 Active 73 DOM
-
2026-06-07days on market $65,000 Active 72 DOM
-
2026-06-07days on market $65,000 Active 71 DOM
-
2026-06-04days on market $65,000 Active 68 DOM
-
2026-06-02days on market $65,000 Active 67 DOM
-
2026-06-01days on market $65,000 Active 66 DOM
-
2026-05-31days on market $65,000 Active 65 DOM
-
2026-03-27$65,000 Active
ⓘ Source: listings_history table (triggers on properties + properties_extension) + one-shot
backfill from property_details.listing_events for pre-trigger history.
Tax reassessment forecast MS · Resets to sale price
- Current annual tax
- $1,139 · $95/mo
- Projected year-2 tax
- $1,139 · $95/mo
- Expected delta
- $0/yr ($0/mo · 0.0%)
ⓘ Screening estimate from a state-policy table — verify with the county assessor before closing.
Climate risk First Street
- Flood 1/10 Low FEMA zone X (unshaded) · 0% chance over 30 yrs
- Wildfire 3/10 Moderate
- Heat 7/10 Severe 7 d/yr ≥107°F today · 21 d/yr by 30 yrs out
- Wind 6/10 Major 27% chance of damaging wind over 30 yrs
- Air quality 1/10 Low 0 unhealthy d/yr today · 0 by 30 yrs out
Nearby sold comps map
Loading sold comps map…
Walkable amenities ~0.75 mi
Loading nearby amenities…
Taxation est. · year 1
- Rental income
- $13,633
- − Mortgage interest
- −$3,641
- − Property taxes
- −$1,139
- − Insurance
- −$325
- − Repairs & maintenance
- −$1,091
- − Management
- −$1,091
- − Depreciation
- −$1,891
- Taxable income
- $4,455
- Est. tax owed @ 24.0%
- −$1,069
- After-tax cash flow
- $4,146/yr
For passive investors: Depreciation is non-cash, so a rental often shows a tax loss while cash-flowing — sheltering income. Rental losses are passive: they offset passive income freely, and up to $25,000/yr can offset ordinary (W-2) income if you actively participate and your MAGI is under $100k (phasing out to $0 by $150k); unused losses carry forward. On sale, claimed depreciation is recaptured at up to 25%, and gains may owe capital-gains tax (a 1031 exchange can defer both). Figures are a year-1 estimate at your 24.0% rate — not tax advice; consult a CPA.
Schools (NCES district)
No district data.
Livability — Winona
- Score
- 68/100
- State rank
- #61
- US rank
- #9387
Category grades
Schools grade is shown separately in the Schools card above.
Census & demographics
- Census place
- Winona, MS
- City population
- 7,048
- Population (ZIP)
- 7,048
Population outlook (Montgomery County) Hauer SSP2
- Today (2025)
- 8,904 people
- By 2030
- 8,221 · -7.7%
- By 2040
- 6,907 · -22.4%
- By 2050
- 5,780 · -35.1%
- By 2075
- 3,902 · -56.2%
- By 2100
- 2,975 · -66.6%
Race, ethnicity, and origin ACS 2023
- Neighborhood character
- Majority White (53%)
- Race & ethnicity
- White 53% Black 46%
- Common ancestry
- Serbian 2% Slovak 1% Italian 1%
- Foreign-born
- 0% · Canada
- Languages at home
- 99% English-only · French/Haitian/Cajun 1% Other Indo-European 1%
Political lean MEDSL · Montgomery
- 2024 margin
- Strong R (+20.8) · D 39.3% · R 60.1%
- 2008→2024 swing
- -12.7pp toward R · 2008: -8.1pp · 2024: -20.8pp
- All cycles
- 2024: R+20.8 2020: R+15.7 2016: R+13.4 2012: R+6.2 2008: R+8.1
Not yet ingested
- Civics
- —
Market trends
- HPI YoY
- ▲ 4.01%
- Current HPI
- 129.6366
- Rent YoY
- —
- Metro
- —
- State GDP YoY
- —
- F500 in state
- 0
Price history
1 event — show timeline
- 2026-03-27 Listed $65,000 MLSU
Property tax history
+7.5%/yrLatest (2020): $1,139 · -0.1% YoY. Source: county tax records.
Cash-flow waterfall
monthlySold comps — $/sqft
last 12 mo · ≤1 miLoading sold comps…