 🏷️ Likely Rental
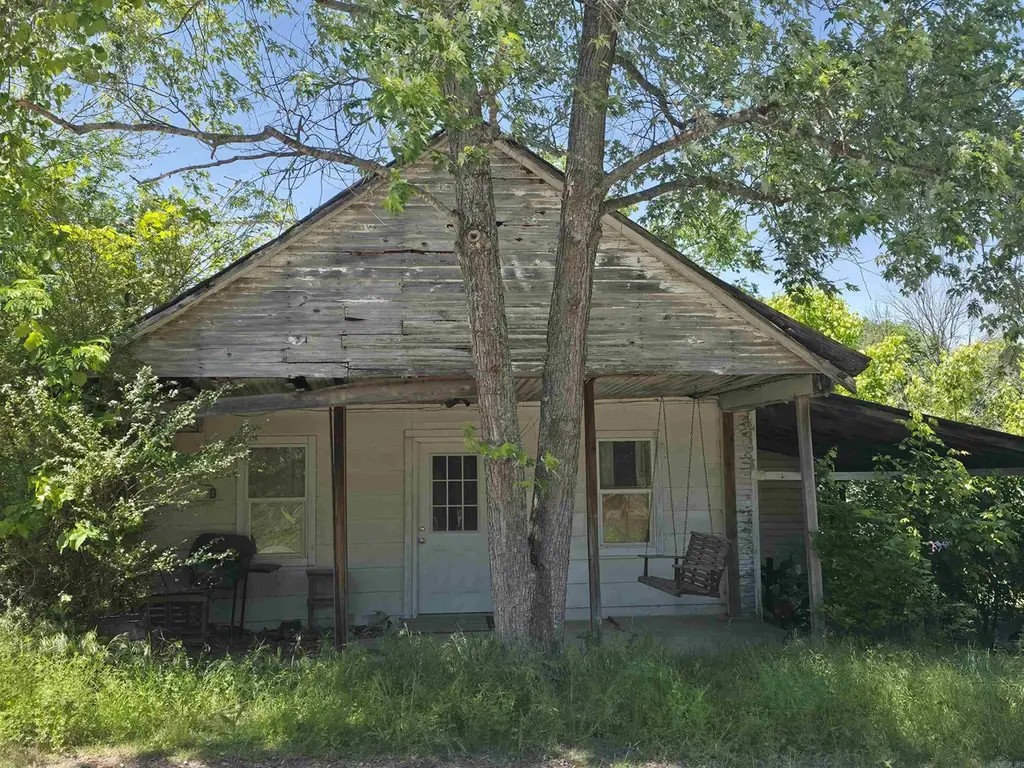
1521 Ar 69b Hwy · Melbourne, AR
Flood risk 1/10 · Minimal
- FEMA flood zone
- X
- Chance of flooding over 30 yrs
- 0.0%
- Est. flood insurance / yr
- $507 – $1,088
Fire risk 7/10 · Major
- Est. fire insurance / yr
- $1,499 – $2,785
Heat risk 4/10 · Minor
- Hot days now (above 107°F)
- 7 days/yr
- Hot days in 30 yrs
- 19 days/yr
Wind risk 3/10 · Minor
- Chance of severe wind over 30 yrs
- 7.0%
Air-quality risk 2/10 · Minimal
- Unhealthy air days now
- 0 days/yr
- Unhealthy air days in 30 yrs
- 1 days/yr
Risk factors via First Street. Map © Google.
Why this score? — see what drove the D+ grade
The composite is a weighted blend of 9 inputs, each scored 0–100. Each bar is that input's sub-score; the figure is the points it added to the 100-point composite (weight × sub-score).
- Cash flow +15.0/30.0
- ARV discount +7.5/15.0
- 1% rule +5.0/10.0
- DSCR +5.0/10.0
- Appreciation +5.0/10.0
- Schools +4.1/10.0
- Livability +3.3/5.0
- Rent growth +2.5/5.0
- Condition / age +2.5/5.0
$10,000
🖨 Deal sheet 📄 Offer letter ✓ Due diligence
Listing remarks
This is the kind of “small box” rural straightforward rehab that can pencil with the right basis: modest square footage, simple layout, and very low reported taxes help keep carrying costs down. With a clean-up/refresh and a tight scope rehab, the property targets a workforce-tenant profile in the Melbourne/Sage area—then you can choose your exit: stabilize as a long-term rental, refinance after seasoning, or resell once brought to market standards.
Key facts
- 6,098 sq ft lot
- Built 1970
- Listed 23 days
Property features AI
Finance
- HOA & community: Annual HOA frequency
Exterior
- Utilities: Public water; Municipal electric service (Entergy)
- Home design: Wood exterior
- Construction: Metal roof; Crawl space foundation; Wood construction; Built on approximately 0.14 acre lot
- Exterior features: Level lot; Not in a subdivision; Inside city limits; Paved road access
Interior
- Flooring: Carpet; Vinyl
- Bathrooms: 1 full bathroom
- Heating & cooling: No cooling system
- Interior features: Carpet and vinyl flooring
Neighborhood map
What this means for you Summary
Snapshot
- This is a 1-bed/1.0-bath single-family listed at $10k.
Deal economics
- At list price, monthly cash flow is $604 ($7k/yr) — positive.
- The deal already cash-flows at list — no discount required.
- Meets the 1% rule at list price ($855 rent vs $10k).
- Recommended offer: $10k (1.5% below list) — sets the bar for market timing.
- Cap rate 78.8% vs local median 3.1% in Melbourne — top-decile yield for the area; either an underpriced asset or a hidden risk that comps aren't pricing in. Stress-test before assuming the spread holds.
Location & tenants
- Location reads 66/100 on livability (#127 in AR) — a middle-class / working-renter tenant base. Strengths: cost of living A+, health & safety A, crime B+; Watch: amenities F, commute F, employment F.
- Melbourne School District (rural): math 48% / reading 51% proficiency, ranked #22 of 238 in AR (top 9%) — families likely to look elsewhere, expect single-tenant / working-renter base with shorter leases.
- Market conditions: 6 active listings in the ZIP; 6 units permitted in Izard County in 2024 (0 in 5+ unit buildings).
Forward outlook
- In year one you build about $369 of equity ($69 loan paydown + $300 appreciation (3.0% local appreciation)).
- Izard County population projected to shrink 8% by 2050 — rents likely to lag national; underwrite the cash flow, not the appreciation.
- At projected returns (3.0% appreciation + 3.0% rent growth), your $3k cash investment doubles in ~1 year — after that, you're playing with house money.
Negotiation context
- It's been on market 23 days — a 2% lower offer ($10k) is reasonable based on typical stale-listing flexibility.
- Current owner paid $8k; 25% above their basis — modest negotiation headroom, anchor on the comps not their cost.
Risks & watch-outs
- Climate carrying-cost: major wildfire risk — expect insurance premiums to compound above CPI over the hold.
Questions for the listing agent
- Built in 1970 — when were the roof, HVAC, electrical panel, plumbing, and water heater last replaced?
- Is there a deadline driving the sale (1031 exchange, divorce, estate, relocation)? That informs how much negotiation room exists.
- The area grade is low — what's the realistic commute time and amenity access for the typical tenant pool here? Any planned neighborhood developments (good or bad) we should know about?
- What's the average days-on-market for RENTAL listings here right now (not sales)? A rising rental-DOM trend means longer vacancies and softer asking-rent achievability than the comps imply.
- What's the recent tenant-quality profile in this submarket — average credit score on applications, eviction rate, late-payment / NSF rate, and stable-employment percentage? A property-management company in the area should have these aggregated.
- How much new for-sale + rental construction is in the pipeline within 1–3 miles? Heavy new supply typically softens prices + rents 12–24 months out; constrained supply supports both.
Investment metrics
- 1% rule
- 8.55% ✓
- Cap rate
- 78.75%
- Cash-on-cash
- 258.79%
- DSCR
- 12.51
- GRM
- 1.0
CMA / ARV
- ARV (median comp)
- $148,353
- List price
- $10,000
- Delta
- -93.26%
- Verdict
- UNDERPRICED
- Comps
- 2 within 2.0 mi
Projected returns pro-forma
3.0% appreciation · 3.0% rent growth · sell at horizon
- IRR
- —
- Equity multiple
- 15.17×
- Total profit
- $39,678
- Equity at exit
- $4,496
- IRR
- —
- Equity multiple
- 32.20×
- Total profit
- $87,372
- Equity at exit
- $6,930
Cash invested: $2,800 (down + closing). Projections, not guarantees.
Landlord ↔ Tenant lean methodology
- Overall (STATE)
- 92 Strongly Landlord-Friendly
- State Arkansas
- 92 Strongly Landlord-Friendly · R+14
- County
- — inherits STATE
- City
- — inherits STATE
ZIP-level market 72573
- Active inventory
- 6
- Price-to-rent
- 1.0×
Monthly cashflow live
- Estimated rent
- $855 medium interval (Pro) →
- Mortgage (P&I)
- −$52
- Tax from tax record
- −$15 /mo · $178/yr
- Insurance
- −$4
- HOA
- −$0
- Vacancy / Maint / Mgmt
- −$180
- Net cashflow
- $604
Break-even live
UW: 25.0% down · 7.5% · 30yr · 1.5% tax · 5.0% vac · 8.0% maint · 8.0% mgmt
Financing live
Cash to close
- Down payment
- $2,500
- Closing costs
- $300
- Reserves months
- —
- Total cash needed
- —
Loan-product check · same deal, 3 products live
Conventional
25% down · 7.5% · 30yr
- Down + closing
- —
- Monthly P&I
- —
- Monthly cashflow
- —
- DSCR
- —
- Eligible?
- —
Personal DTI + credit; lowest rate.
DSCR
20% down · 8.5% · 30yr
- Down + closing
- —
- Monthly P&I
- —
- Monthly cashflow
- —
- DSCR
- —
- Eligible?
- —
No personal income docs; deal must DSCR.
Hard money
10% down · 12.0% · 12mo
- Down + closing
- —
- Monthly P&I
- —
- Monthly cashflow
- —
- DSCR
- —
- Eligible?
- —
Short-term bridge; refi at stabilization.
Listing history 6 events
-
2026-06-01status $10,000 Under Contract 23 DOM
-
2026-05-31days on market $10,000 Active 23 DOM
-
2026-05-30days on market $10,000 Active 22 DOM
-
2026-05-03$10,000 New Listing 471-char remark
-
2015-01-13soldstatus $8,000
-
2003-10-31soldstatus $9,000
ⓘ Source: listings_history table (triggers on properties + properties_extension) + one-shot
backfill from property_details.listing_events for pre-trigger history.
Tax reassessment forecast AR · Resets to sale price
- Current annual tax
- $178 · $15/mo
- Projected year-2 tax
- $178 · $15/mo
- Expected delta
- $0/yr ($0/mo · 0.0%)
ⓘ Screening estimate from a state-policy table — verify with the county assessor before closing.
Climate risk First Street
- Flood 1/10 Low FEMA zone X · 0% chance over 30 yrs
- Wildfire 7/10 Severe
- Heat 4/10 Moderate 7 d/yr ≥107°F today · 19 d/yr by 30 yrs out
- Wind 3/10 Moderate 7% chance of damaging wind over 30 yrs
- Air quality 2/10 Low 0 unhealthy d/yr today · 1 by 30 yrs out
Nearby sold comps map
Loading sold comps map…
Walkable amenities ~0.75 mi
Loading nearby amenities…
Taxation est. · year 1
- Rental income
- $10,258
- − Mortgage interest
- −$560
- − Property taxes
- −$178
- − Insurance
- −$50
- − Repairs & maintenance
- −$821
- − Management
- −$821
- − Depreciation
- −$291
- Taxable income
- $7,537
- Est. tax owed @ 24.0%
- −$1,809
- After-tax cash flow
- $5,437/yr
For passive investors: Depreciation is non-cash, so a rental often shows a tax loss while cash-flowing — sheltering income. Rental losses are passive: they offset passive income freely, and up to $25,000/yr can offset ordinary (W-2) income if you actively participate and your MAGI is under $100k (phasing out to $0 by $150k); unused losses carry forward. On sale, claimed depreciation is recaptured at up to 25%, and gains may owe capital-gains tax (a 1031 exchange can defer both). Figures are a year-1 estimate at your 24.0% rate — not tax advice; consult a CPA.
Schools (NCES district)
- District
- Melbourne School District
- NCES district ID
- 0509720
- Math proficiency
- 48% ▼ -13.00%
- Reading proficiency
- 51% ▼ -7.00%
- Median HH income
- $37,534
- Composite
- 41.18/100
- National rank
- #3548
- State rank
- #22 of 238 in AR
Livability — Melbourne
- Score
- 66/100
- State rank
- #127
- US rank
- #11858
Category grades
Schools grade is shown separately in the Schools card above.
Census & demographics
- Population (ZIP)
- 460
Population outlook (Izard County) Hauer SSP2
- Today (2025)
- 13,018 people
- By 2030
- 12,761 · -2.0%
- By 2040
- 12,331 · -5.3%
- By 2050
- 12,041 · -7.5%
- By 2075
- 11,516 · -11.5%
- By 2100
- 10,549 · -19.0%
Race, ethnicity, and origin ACS 2023
- Neighborhood character
- Predominantly White (100%)
- Race & ethnicity
- White 100%
- Common ancestry
- Serbian 3%
Political lean MEDSL · Izard
- 2024 margin
- Solid R (+65.9) · D 16.0% · R 81.9% · Other 2.1%
- 2008→2024 swing
- -39.1pp toward R · 2008: -26.9pp · 2024: -65.9pp
- All cycles
- 2024: R+65.9 2020: R+62.1 2016: R+54.3 2012: R+37.8 2008: R+26.9
Not yet ingested
- Civics
- —
Market trends
- HPI YoY
- —
- Current HPI
- —
- Rent YoY
- —
- Metro
- —
- State GDP YoY
- ▲ 3.80%
- F500 in state
- 10
Industry mix (Fortune 500 HQ in AR)
| Industry | F500 HQs | Revenue |
|---|---|---|
| Retail | 1 | $681B |
|
||
| Food / Agriculture | 1 | $53B |
|
||
| Retail / Energy | 1 | $22B |
|
||
| Transportation / Logistics | 1 | $12B |
|
||
| Energy | 1 | $4B |
|
||
Price history
+11.1% since first listed4 events — show timeline
- 2026-06-01 Pending — CARMLS
- 2026-05-03 Listed $10,000 CARMLS
- 2015-01-13 Sold (Public Records) $8,000 Public Records
- 2003-10-31 Sold (Public Records) $9,000 Public Records
Property tax history
+2.5%/yrLatest (2025): $178 · +0.0% YoY. Source: county tax records.
Cash-flow waterfall
monthlySold comps — $/sqft
last 12 mo · ≤1 miLoading sold comps…