 🏗️ New Construction
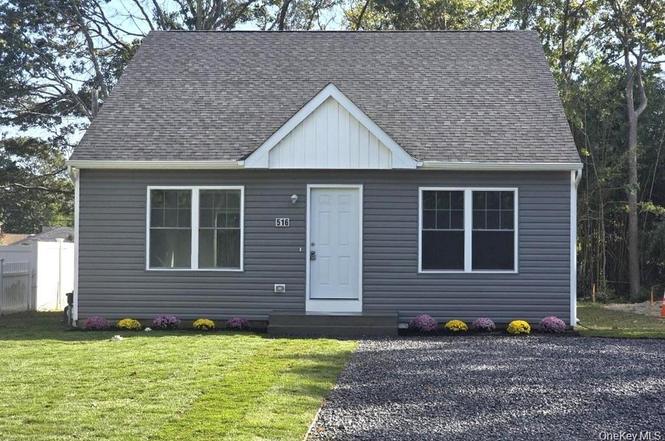
510 Neighborhood Rd · Mastic Beach, NY
Flood risk No data
- FEMA flood zone
- —
- Chance of flooding over 30 yrs
- —
- Est. flood insurance / yr
- —
Fire risk No data
- Est. fire insurance / yr
- —
Heat risk No data
- Hot days now (above threshold)
- —
- Hot days in 30 yrs
- —
Wind risk No data
- Chance of severe wind over 30 yrs
- —
Air-quality risk No data
- Unhealthy air days now
- —
- Unhealthy air days in 30 yrs
- —
Risk factors via First Street. Map © Google.
Why this score? — see what drove the F grade
The composite is a weighted blend of 9 inputs, each scored 0–100. Each bar is that input's sub-score; the figure is the points it added to the 100-point composite (weight × sub-score).
- Cash flow +9.0/30.0
- ARV discount +7.5/15.0
- Schools +4.7/10.0
- Livability +3.1/5.0
- 1% rule +2.8/10.0
- DSCR +2.5/10.0
- Rent growth +2.5/5.0
- Condition / age +2.5/5.0
- Appreciation +0.0/10.0
$499,999
🖨 Deal sheet 📄 Offer letter ✓ Due diligence
Listing remarks
New Construction, Opportunity Knocks, Affordable Quality Diamond Home. Welcome to this Expanded Cape, much larger than it appears, approx. 1500sqft. All brand new from roof to basement, open floor plan, large kitchen with granite and stainless steel appliances. Hi hat lighting, large Family room & Dining Room with sliders to large inviting back yard. Laundry and pantry room next to the Kitchen. Large bedroom on lower level can be used as 2nd Primary Bedroom. Primary Bedroom upstairs has two closets, plus another nice size Bedroom. Two Full Baths with subway tile. Home is equipped with 5 efficient split systems distributing air conditioning and heating. Full basement with 9 ft ceiling,
Key facts
- Large family room
- Two closets
- Large kitchen
Tags
Neighborhood map
What this means for you Summary
Snapshot
- This is a 3-bed/2.0-bath single-family listed at $500k.
Deal economics
- At list price, monthly cash flow is $-416 ($-5k/yr) — negative.
- To cash-flow at today's rent, offer at most $471k (5.8% below list).
- To meet the 1% rule (rent ≥ 1% of price), the offer needs to be $412k (17.6% below list).
- Recommended offer: $412k (17.6% below list) — sets the bar for 1% rule.
Location & tenants
- Location reads 61/100 on livability (#936 in NY) — a middle-class / working-renter tenant base. Strengths: employment A+, housing A+; Watch: crime D, amenities F, commute F.
- William Floyd Union Free School District (suburban): math 48% / reading 57% proficiency, ranked #309 of 590 in NY (top 52%) — acceptable for families but not a draw, mixed tenant base, ~2y average lease.
- Zoned schools: William Floyd Elementary School (math 48% / reading 54%, grade C-, #1,047 of 2,108 statewide, top 50%, 742 students, 54% FRL); William Floyd Middle School (math 36% / reading 47%, grade F, #394 of 729 statewide, top 55%, 1,053 students, 54% FRL); William Floyd High School (math 65% / reading 87%, grade A-, #616 of 1,100 statewide, top 57%, 3,013 students, 54% FRL).
- Market conditions: 183 active listings in the ZIP; 6 comparable units currently listed for rent nearby; rentals leasing fast (median 1d on market — plan ~1-2 weeks tenant-placement turnaround); 1,366 units permitted in Suffolk County in 2024 (216 in 5+ unit buildings).
Forward outlook
- Local home prices are declining (-3.0%/yr); year-one equity from $4k of loan paydown is wiped out by about $16k of value loss. Plan a longer hold.
- Suffolk County population projected to shrink 5% by 2050 — rents likely to lag national; underwrite the cash flow, not the appreciation.
Negotiation context
- It's been on market 27 days — a 2% lower offer ($492k) is reasonable based on typical stale-listing flexibility.
Questions for the listing agent
- What do current leases actually rent for vs. the listed asking? Can we see a recent rent roll and the last 12 months of T-12 income?
- Is there a deadline driving the sale (1031 exchange, divorce, estate, relocation)? That informs how much negotiation room exists.
- Schools are D-rated, which usually means shorter tenancies and higher turnover. Who's the typical renter profile here, and what's been the actual vacancy rate?
- Crime grade is D in this area — have there been break-ins, vandalism, or insurance claims at this property in the last 3 years? What carrier currently insures it and at what premium?
- The area grade is low — what's the realistic commute time and amenity access for the typical tenant pool here? Any planned neighborhood developments (good or bad) we should know about?
- What's the average days-on-market for RENTAL listings here right now (not sales)? A rising rental-DOM trend means longer vacancies and softer asking-rent achievability than the comps imply.
- What's the recent tenant-quality profile in this submarket — average credit score on applications, eviction rate, late-payment / NSF rate, and stable-employment percentage? A property-management company in the area should have these aggregated.
- How much new for-sale + rental construction is in the pipeline within 1–3 miles? Heavy new supply typically softens prices + rents 12–24 months out; constrained supply supports both.
Investment metrics
- 1% rule
- 0.78% ✗
- Cap rate
- 5.35%
- Cash-on-cash
- -3.36%
- DSCR
- 0.85
- GRM
- 10.7
CMA / ARV
- ARV (on-the-fly)
- $531,000
- Comps found
- 12
Show comp detail 12 sales within ~0.75 mi
| Address | Dist | Beds/Ba | Sqft | Sold | Price | $/sf | Match |
|---|---|---|---|---|---|---|---|
| 514 Neighborhood Rd | 0.01mi | 3/2.0 | 1,400 (-7%) | 2mo | $549,990 | $393 | 87 |
| 61 Arpage Dr E | 0.34mi | 3/1.5 | 1,500 (0%) | 2mo | $580,000 | $387 | 81 |
| 74 Alcolade Dr E | 0.40mi | 3/1.5 | 1,440 (-4%) | 2mo | $431,000 | $299 | 71 |
| 19 Birchwood Dr | 0.18mi | 3/2.5 | 1,678 (+12%) | 3mo | $530,000 | $316 | 67 |
| 6 Lafayette Dr | 0.68mi | 3/2.0 | 1,500 (0%) | 5mo | $572,000 | $381 | 64 |
| 9 Brushwood Dr | 0.36mi | 4/2.0 (+1) | 1,400 (-7%) | 4mo | $495,000 | $354 | 64 |
| 21 Pennwood Dr | 0.46mi | 4/2.0 (+1) | 1,456 (-3%) | 7mo | $530,000 | $364 | 62 |
| 26 Arpage Dr E | 0.35mi | 3/1.5 | 1,391 (-7%) | 9mo | $520,000 | $374 | 62 |
| 6 Victoria Pl | 0.72mi | 4/2.0 (+1) | 1,470 (-2%) | 4mo | $470,000 | $320 | 55 |
| 193 Laurelton Dr | 0.53mi | 3/2.0 | 1,349 (-10%) | 5mo | $465,000 | $345 | 55 |
| 2 Lafayette Dr | 0.68mi | 3/1.5 | 1,334 (-11%) | 2mo | $400,000 | $300 | 46 |
| 99 Lynbrook Dr | 0.59mi | 4/2.5 (+1) | 1,357 (-10%) | 7mo | $375,000 | $276 | 43 |
Match score weights: distance 35% · size 25% · config 20% · recency 20%. Top-matched comps best support the ARV.
Projected returns pro-forma
-3.0% appreciation · 3.0% rent growth · sell at horizon
- IRR
- -21.9%
- Equity multiple
- 0.24×
- Total profit
- $-112,475
- Equity at exit
- $79,174
- IRR
- -15.7%
- Equity multiple
- 0.11×
- Total profit
- $-131,801
- Equity at exit
- $45,911
Cash invested: $148,680 (down + closing). Projections, not guarantees.
Landlord ↔ Tenant lean methodology
- Overall (STATE)
- 15 Strongly Tenant-Friendly
- State New York
- 15 Strongly Tenant-Friendly · D+10
- County
- — inherits STATE
- City
- — inherits STATE
ZIP-level market 11967
- Home prices YoY
- -33.1%
- Active inventory
- 183
- Price-to-rent
- 10.1×
Monthly cashflow live
- Estimated rent
- $4,119 high interval (Pro) →
- Mortgage (P&I)
- −$2,785
- Tax est. 1.5%
- −$664 /mo · $7,965/yr
- Insurance
- −$221
- HOA
- −$0
- Vacancy / Maint / Mgmt
- −$865
- Net cashflow
- $-416
Break-even live
UW: 25.0% down · 7.5% · 30yr · 1.5% tax · 5.0% vac · 8.0% maint · 8.0% mgmt
Financing live
Cash to close
- Down payment
- $132,750
- Closing costs
- $15,930
- Reserves months
- —
- Total cash needed
- —
Loan-product check · same deal, 3 products live
Conventional
25% down · 7.5% · 30yr
- Down + closing
- —
- Monthly P&I
- —
- Monthly cashflow
- —
- DSCR
- —
- Eligible?
- —
Personal DTI + credit; lowest rate.
DSCR
20% down · 8.5% · 30yr
- Down + closing
- —
- Monthly P&I
- —
- Monthly cashflow
- —
- DSCR
- —
- Eligible?
- —
No personal income docs; deal must DSCR.
Hard money
10% down · 12.0% · 12mo
- Down + closing
- —
- Monthly P&I
- —
- Monthly cashflow
- —
- DSCR
- —
- Eligible?
- —
Short-term bridge; refi at stabilization.
Rent comps 6 comps
| Address | Beds | Baths | Sqft | Rent | $/sqft | DOM | Units | Dist |
|---|---|---|---|---|---|---|---|---|
| 126 Flower Rd Shirley, NY | 4.0 | 1.0 | 1756 | $4,100 | $2.33 | 1d | 1 | 0.20mi |
| 165 Lynbrook Dr Mastic Beach, NY | 3.0 | 2.0 | 1520 | $4,000 | $2.63 | 1d | 1 | 0.34mi |
| 6 Fairview Dr Shirley, NY | 4.0 | 2.0 | 1302 | $4,299 | $3.30 | 2d | 1 | 0.58mi |
| 126 Trafalgar Dr Shirley, NY | 3.0 | 2.5 | 2100 | $4,500 | $2.14 | 1d | 1 | 0.93mi |
| 44 Pine Tree Dr Shirley, NY | 4.0 | 2.0 | 1600 | $4,200 | $2.62 | 1d | 1 | 0.94mi |
| 192 Cypress Dr Mastic Beach, NY | 4.0 | 2.0 | 1404 | $3,800 | $2.71 | 43d | 1 | 1.35mi |
Listing history 2 events
-
2026-02-06status Pending
-
2026-01-09$499,999 Active
ⓘ Source: listings_history table (triggers on properties + properties_extension) + one-shot
backfill from property_details.listing_events for pre-trigger history.
Nearby sold comps map
Loading sold comps map…
Walkable amenities ~0.75 mi
Loading nearby amenities…
Taxation est. · year 1
- Rental income
- $49,423
- − Mortgage interest
- −$29,744
- − Property taxes
- −$7,965
- − Insurance
- −$2,655
- − Repairs & maintenance
- −$3,954
- − Management
- −$3,954
- − Depreciation
- −$15,447
- Taxable loss
- −$14,296
- Est. tax savings @ 24.0%
- +$3,431
- After-tax cash flow
- $-1,560/yr
For passive investors: Depreciation is non-cash, so a rental often shows a tax loss while cash-flowing — sheltering income. Rental losses are passive: they offset passive income freely, and up to $25,000/yr can offset ordinary (W-2) income if you actively participate and your MAGI is under $100k (phasing out to $0 by $150k); unused losses carry forward. On sale, claimed depreciation is recaptured at up to 25%, and gains may owe capital-gains tax (a 1031 exchange can defer both). Figures are a year-1 estimate at your 24.0% rate — not tax advice; consult a CPA.
Schools (NCES district)
- District
- William Floyd Union Free School District
- NCES district ID
- 3618690
- Math proficiency
- 48% ▲ 3.00%
- Reading proficiency
- 57% ▲ 11.00%
- Median HH income
- $70,564
- Composite
- 46.79/100
- National rank
- #2383
- State rank
- #309 of 590 in NY
Livability — Mastic Beach
- Score
- 61/100
- State rank
- #936
- US rank
- #18216
Category grades
Schools grade is shown separately in the Schools card above.
Census & demographics
- Census place
- Mastic Beach, NY
- City population
- 15,830
- Population (ZIP)
- 27,266
Population outlook (Suffolk County) Hauer SSP2
- Today (2025)
- 1,505,262 people
- By 2030
- 1,498,318 · -0.5%
- By 2040
- 1,471,101 · -2.3%
- By 2050
- 1,424,848 · -5.3%
- By 2075
- 1,337,157 · -11.2%
- By 2100
- 1,217,720 · -19.1%
Race, ethnicity, and origin ACS 2023
- Neighborhood character
- Diverse neighborhood (Simpson 0.57)
- Race & ethnicity
- White 59% Hispanic / Latino 25% Black 9% Two or more races 8% Asian 4%
- Hispanic origin (detail)
- Puerto Rican 10% Dominican 2%
- Common ancestry
- Romanian 3% Lithuanian 2% Scotch-Irish 1%
- Foreign-born
- 12% · Canada, China, Jamaica
- Languages at home
- 76% English-only · Spanish 17% Other Indo-European 4% Chinese 1%
Political lean MEDSL · Suffolk
- 2024 margin
- Lean R (+10.0) · D 45.0% · R 55.0%
- 2008→2024 swing
- -16.0pp toward R · 2008: 6.0pp · 2024: -10.0pp
- All cycles
- 2024: R+10.0 2020: R+0.0 2016: R+8.2 2012: D+2.9 2008: D+6.0
Not yet ingested
- Civics
- —
Market trends
- HPI YoY
- ▼ -212.21%
- Current HPI
- 428.8362
- Rent YoY
- —
- Metro
- —
- State GDP YoY
- ▲ 2.60%
- F500 in state
- 92
Industry mix (Fortune 500 HQ in NY)
| Industry | F500 HQs | Revenue |
|---|---|---|
| Financial Services | 10 | $950B |
|
||
| Consumer Goods | 9 | $162B |
|
||
| Insurance | 4 | $225B |
|
||
| Telecommunications | 2 | $144B |
|
||
| Pharmaceuticals | 2 | $112B |
|
||
| Media / Entertainment | 2 | $69B |
|
||
Price history
2 events — show timeline
- 2026-02-06 Pending — OneKey® MLS as Distributed by MLS Grid
- 2026-01-09 Listed $499,999 OneKey® MLS as Distributed by MLS Grid
Cash-flow waterfall
monthlySold comps — $/sqft
last 12 mo · ≤1 miLoading sold comps…