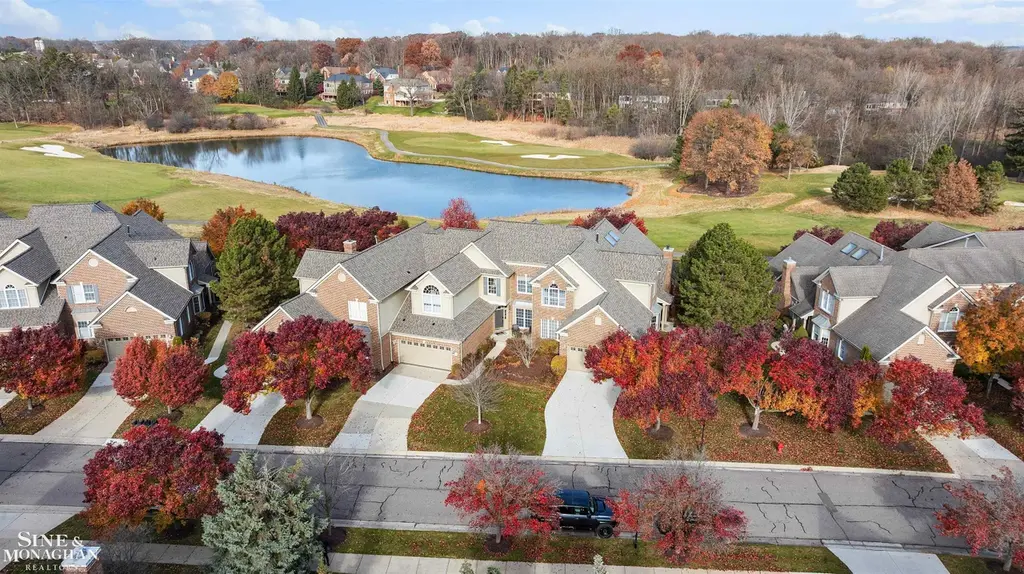
44522 Broadmoor Blvd · Northville, MI
Flood risk No data
- FEMA flood zone
- —
- Chance of flooding over 30 yrs
- —
- Est. flood insurance / yr
- —
Fire risk No data
- Est. fire insurance / yr
- —
Heat risk No data
- Hot days now (above threshold)
- —
- Hot days in 30 yrs
- —
Wind risk No data
- Chance of severe wind over 30 yrs
- —
Air-quality risk No data
- Unhealthy air days now
- —
- Unhealthy air days in 30 yrs
- —
Risk factors via First Street. Map © Google.
Why this score? — see what drove the B- grade
The composite is a weighted blend of 9 inputs, each scored 0–100. Each bar is that input's sub-score; the figure is the points it added to the 100-point composite (weight × sub-score).
- Cash flow +30.0/30.0
- 1% rule +10.0/10.0
- DSCR +10.0/10.0
- Schools +6.6/10.0
- Livability +4.4/5.0
- Condition / age +4.0/5.0
- Rent growth +2.5/5.0
- ARV discount +1.3/15.0
- Appreciation +0.0/10.0
$695,000
🖨 Deal sheet 📄 Offer letter ✓ Due diligence
Listing remarks
GOLF COURSE FRONTAGE !! REDUCED PRICE!!! Refined Golf Course Living in the Villas of Northville Hills Golf Club. Beautifully updated and ideally positioned on the 14th fairway of the Arnold Palmer"“designed Northville Hills Golf Club, this exceptional condo offers a rare blend of luxury, privacy, and resort style living. Just one-minute from St. John's Resort, home to four outstanding restaurants-including the exclusive Wine Grotto and the newly opened Doyle's Irish Pub overlooking the course-the location is truly exceptional. The Cardinal at St. John's hosts the annual LIV Golf World Championship, adding to the area's prestige and appeal. The home features three bedrooms plus a
Key facts
- Golf course frontage
- New lennox furnace
- Updated kitchen
Tags
Property features AI
Finance
- HOA & community: Homeowners association with a $500 monthly fee
Exterior
- Parking: Attached 2-car garage
- Utilities: Public sewer; Water available
- Home design: Condominium; Two levels
- Construction: Brick construction
- Exterior features: Lot in condominium community; Pets allowed (contact for details)
Interior
- Bathrooms: 2 full bathrooms; 1 half bathroom
- Heating & cooling: Forced air heating (natural gas); Central air conditioning
- Interior features: Gas fireplace; Basement
Neighborhood map
What this means for you Summary
Snapshot
- This is a 3-bed/2.5-bath condo listed at $695k. Condition is rated good.
Deal economics
- At list price, monthly cash flow is $5k ($62k/yr) — positive.
- The deal already cash-flows at list — no discount required.
- Meets the 1% rule at list price ($13k rent vs $695k).
- Recommended offer: $674k (3.0% below list) — sets the bar for market timing.
- Cap rate 15.3% vs local median 2.4% in Northville — top-decile yield for the area; either an underpriced asset or a hidden risk that comps aren't pricing in. Stress-test before assuming the spread holds.
Location & tenants
- Location reads 88/100 on livability (#13 in MI, #205 nationally) — a professional / high-income tenant draw. Strengths: schools A+, crime A+, amenities A+; Watch: commute F.
- Northville Public Schools (suburban): math 68% / reading 75% proficiency, ranked #4 of 540 in MI (top 1%) — strong family-tenant draw, lease renewals of 3-5y typical; only 4% free/reduced lunch — higher-income household profile.
- Market conditions: 145 active listings in the ZIP; 1 comparable units currently listed for rent nearby; 2,639 units permitted in Wayne County in 2024 (1,216 in 5+ unit buildings).
Forward outlook
- Local home prices are declining (-3.0%/yr); year-one equity from $5k of loan paydown is wiped out by about $21k of value loss. Plan a longer hold.
- Wayne County population projected at -17% by 2050 — secular population decline; favor cash flow + early exit over multi-decade hold.
- At projected returns (-3.0% appreciation + 3.0% rent growth), your $195k cash investment doubles in ~4 years — after that, you're playing with house money.
Negotiation context
- It's been on market 40 days — a 3% lower offer ($674k) is reasonable based on typical stale-listing flexibility.
- 4 sale attempts with the ask held roughly flat each time — persistent listings suggest the price (not the market) is what's stuck; bring a comps-based counter.
Questions for the listing agent
- It's been on market 40 days. Have you received any prior offers? Is the seller open to a 3% concession, seller financing, or rate buy-down credit?
- What does the HOA fee cover, when was the last increase, and are there any pending special assessments or reserve-fund shortfalls?
- Any open or pending special assessments — roof, HVAC, plumbing, elevator, façade? What's the per-unit balance and payoff schedule, and is the seller paying it off at close or rolling it to the buyer?
- Is there a deadline driving the sale (1031 exchange, divorce, estate, relocation)? That informs how much negotiation room exists.
- Schools are A-rated — typically a magnet for longer-tenancy family renters. What's the average tenant stay here, and is there a school-zone premium baked into asking?
- What's the average days-on-market for RENTAL listings here right now (not sales)? A rising rental-DOM trend means longer vacancies and softer asking-rent achievability than the comps imply.
- What's the recent tenant-quality profile in this submarket — average credit score on applications, eviction rate, late-payment / NSF rate, and stable-employment percentage? A property-management company in the area should have these aggregated.
- How much new apartment / multifamily construction is in the pipeline within 1–3 miles? Heavy new supply (>2% of stock underway) typically softens rents 12–24 months out; light construction supports rent growth.
Investment metrics
- 1% rule
- 1.91% ✓
- Cap rate
- 15.28%
- Cash-on-cash
- 32.09%
- DSCR
- 2.43
- GRM
- 4.4
CMA / ARV
- ARV (median comp)
- $610,809
- List price
- $695,000
- Delta
- 13.78%
- Verdict
- OVERPRICED
- Comps
- 20 within 1.0 mi
Projected returns pro-forma
-3.0% appreciation · 3.0% rent growth · sell at horizon
- IRR
- 27.1%
- Equity multiple
- 2.13×
- Total profit
- $219,334
- Equity at exit
- $103,627
- IRR
- 34.7%
- Equity multiple
- 4.19×
- Total profit
- $619,846
- Equity at exit
- $60,091
Cash invested: $194,600 (down + closing). Projections, not guarantees.
Landlord ↔ Tenant lean methodology
- Overall (STATE)
- 62 Landlord-Friendly
- State Michigan
- 62 Landlord-Friendly · EVEN
- County
- — inherits STATE
- City
- — inherits STATE
ZIP-level market 48168
- Active inventory
- 145
- Price-to-rent
- 4.4×
Monthly cashflow live
- Estimated rent
- $13,300 medium interval (Pro) →
- Mortgage (P&I)
- −$3,645
- Tax est. 1.5%
- −$869 /mo · $10,425/yr
- Insurance
- −$290
- HOA
- −$500
- Vacancy / Maint / Mgmt
- −$2,793
- Net cashflow
- $5,204
Break-even live
UW: 25.0% down · 7.5% · 30yr · 1.5% tax · 5.0% vac · 8.0% maint · 8.0% mgmt
Financing live
Cash to close
- Down payment
- $173,750
- Closing costs
- $20,850
- Reserves months
- —
- Total cash needed
- —
Loan-product check · same deal, 3 products live
Conventional
25% down · 7.5% · 30yr
- Down + closing
- —
- Monthly P&I
- —
- Monthly cashflow
- —
- DSCR
- —
- Eligible?
- —
Personal DTI + credit; lowest rate.
DSCR
20% down · 8.5% · 30yr
- Down + closing
- —
- Monthly P&I
- —
- Monthly cashflow
- —
- DSCR
- —
- Eligible?
- —
No personal income docs; deal must DSCR.
Hard money
10% down · 12.0% · 12mo
- Down + closing
- —
- Monthly P&I
- —
- Monthly cashflow
- —
- DSCR
- —
- Eligible?
- —
Short-term bridge; refi at stabilization.
Rent comps 1 comps
| Address | Beds | Baths | Sqft | Rent | $/sqft | DOM | Units | Dist |
|---|---|---|---|---|---|---|---|---|
| 16646 Brooklane Blvd Northville, MI | 4.0 | 4.5 | 3282 | $13,300 | $4.05 | 17d | 1 | 0.70mi |
HOA detail condo
- Monthly dues
- $500 · $6,000/yr
- Assessments
- None detected in remarks — confirm with the listing agent.
Listing history 24 events
-
2026-06-18days on market $695,000 Active 40 DOM
-
2026-06-17days on market $695,000 Active 39 DOM
-
2026-06-16days on market $695,000 Active 38 DOM
-
2026-06-15days on market $695,000 Active 37 DOM
-
2026-06-13days on market $695,000 Active 35 DOM
-
2026-06-09days on market $695,000 Active 31 DOM
-
2026-06-08days on market $695,000 Active 30 DOM
-
2026-06-07days on market $695,000 Active 29 DOM
-
2026-06-04days on market $695,000 Active 26 DOM
-
2026-06-03days on market $695,000 Active 25 DOM
-
2026-06-02days on market $695,000 Active 24 DOM
-
2026-06-01days on market $695,000 Active 23 DOM
-
2026-05-31days on market $695,000 Active 22 DOM
-
2026-05-09historical
-
2026-05-09$695,000 Active
-
2026-05-09$695,000 Active
-
2026-05-05price $695,000
-
2026-05-05price $695,000
-
2026-04-21price $709,000
-
2026-04-20price $709,000
-
2026-04-02$728,999 Active
-
2026-04-02$728,999 Active
-
2026-03-31price $728,999
-
2026-03-30historical
ⓘ Source: listings_history table (triggers on properties + properties_extension) + one-shot
backfill from property_details.listing_events for pre-trigger history.
Nearby sold comps map
Loading sold comps map…
Walkable amenities ~0.75 mi
Loading nearby amenities…
Taxation est. · year 1
- Rental income
- $159,600
- − Mortgage interest
- −$38,931
- − Property taxes
- −$10,425
- − Insurance
- −$3,475
- − Repairs & maintenance
- −$12,768
- − Management
- −$12,768
- − HOA
- −$6,000
- − Depreciation
- −$20,218
- Taxable income
- $55,015
- Est. tax owed @ 24.0%
- −$13,204
- After-tax cash flow
- $49,245/yr
For passive investors: Depreciation is non-cash, so a rental often shows a tax loss while cash-flowing — sheltering income. Rental losses are passive: they offset passive income freely, and up to $25,000/yr can offset ordinary (W-2) income if you actively participate and your MAGI is under $100k (phasing out to $0 by $150k); unused losses carry forward. On sale, claimed depreciation is recaptured at up to 25%, and gains may owe capital-gains tax (a 1031 exchange can defer both). Figures are a year-1 estimate at your 24.0% rate — not tax advice; consult a CPA.
Condition & rehab AI · 12 photos
This well-maintained townhouse in Northville Hills Golf Club offers a blend of luxury and resort-style living. The interior is in good condition with modern updates, and the exterior is well-kept. Potential buyers and renters will appreciate the golf course frontage and proximity to St. John's Resort.
Value-add opportunities
- Both update landscaping — enhances curb appeal and adds value
- Both install smart home devices — improves convenience and energy efficiency
- Both paint interior walls — refreshes the space and adds value
Renovation cost estimate screening
Value-add ROI direction
- Both update landscaping — enhances curb appeal and adds value ↑
- Both install smart home devices — improves convenience and energy efficiency ↑
- Both paint interior walls — refreshes the space and adds value ↑
ⓘ Cost ranges are severity-bucket heuristics (US national rule-of-thumb). Get contractor quotes + a written scope before underwriting a rehab budget.
Schools (NCES district)
- District
- Northville Public Schools
- NCES district ID
- 2625980
- Math proficiency
- 68% ▼ -5.00%
- Reading proficiency
- 75% ▼ -4.00%
- Median HH income
- $108,824
- Composite
- 66.21/100
- National rank
- #431
- State rank
- #4 of 540 in MI
Livability — Northville
- Score
- 88/100
- State rank
- #13
- US rank
- #205
Category grades
Schools grade is shown separately in the Schools card above.
Census & demographics
- City population
- 24,713
- Population (ZIP)
- 25,039
Population outlook (Wayne County) Hauer SSP2
- Today (2025)
- 1,675,273 people
- By 2030
- 1,620,300 · -3.3%
- By 2040
- 1,502,341 · -10.3%
- By 2050
- 1,384,039 · -17.4%
- By 2075
- 1,124,592 · -32.9%
- By 2100
- 881,193 · -47.4%
Race, ethnicity, and origin ACS 2023
- Neighborhood character
- Predominantly White (72%)
- Race & ethnicity
- White 72% Asian 19% Two or more races 5% Hispanic / Latino 4% Black 2%
- Common ancestry
- Romanian 9% Italian 3% Lithuanian 3%
- Foreign-born
- 20% · Canada, China, Jamaica
- Languages at home
- 77% English-only · Other Indo-European 7% Other Asian/Pacific 5% Chinese 3%
Political lean MEDSL · Wayne
- 2024 margin
- Strong D (+29.0) · D 62.7% · R 33.7% · Other 3.6%
- 2008→2024 swing
- -20.5pp toward R · 2008: 49.5pp · 2024: 29.0pp
- All cycles
- 2024: D+29.0 2020: D+38.1 2016: D+37.3 2012: D+46.9 2008: D+49.5
Not yet ingested
- Civics
- —
Market trends
- HPI YoY
- ▼ -198.06%
- Current HPI
- 176.9122
- Rent YoY
- —
- Metro
- —
- State GDP YoY
- ▲ 1.37%
- F500 in state
- 28
Industry mix (Fortune 500 HQ in MI)
| Industry | F500 HQs | Revenue |
|---|---|---|
| Automotive Parts | 3 | $48B |
|
||
| Automotive | 2 | $372B |
|
||
| Chemicals | 1 | $45B |
|
||
| Automotive Retail | 1 | $29B |
|
||
| Healthcare / Medical Devices | 1 | $23B |
|
||
| Automotive Technology | 1 | $20B |
|
||
Price history
-4.7% since first listed11 events — show timeline
- 2026-05-09 Listed $695,000 MiRealSource-MiMLS
- 2026-05-09 Listed $695,000 REALCOMP
- 2026-05-09 Listing Removed — MiRealSource-MiMLS
- 2026-05-05 Price Changed $695,000 MiRealSource-MiMLS
- 2026-05-05 Price Changed $695,000 REALCOMP
- 2026-04-21 Price Changed $709,000 MiRealSource-MiMLS
- 2026-04-20 Price Changed $709,000 REALCOMP
- 2026-04-02 Listed $728,999 REALCOMP
- 2026-04-02 Listed $728,999 MiRealSource-MiMLS
- 2026-03-31 Price Changed $728,999 MiRealSource-MiMLS
- 2026-03-30 Coming Soon — MiRealSource-MiMLS
Cash-flow waterfall
monthlySold comps — $/sqft
last 12 mo · ≤1 miLoading sold comps…