 🏗️ New Construction
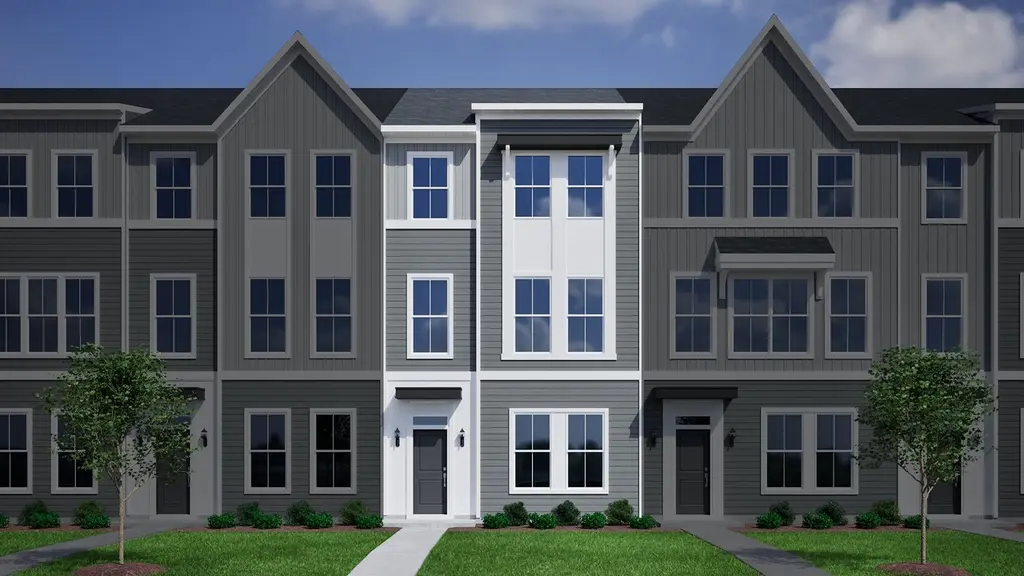
Corabell 3-Story 2-Car Garage Plan · Murraysville, NC
Flood risk No data
- FEMA flood zone
- —
- Chance of flooding over 30 yrs
- —
- Est. flood insurance / yr
- —
Fire risk No data
- Est. fire insurance / yr
- —
Heat risk No data
- Hot days now (above threshold)
- —
- Hot days in 30 yrs
- —
Wind risk No data
- Chance of severe wind over 30 yrs
- —
Air-quality risk No data
- Unhealthy air days now
- —
- Unhealthy air days in 30 yrs
- —
Risk factors via First Street. Map © Google.
Why this score? — see what drove the F grade
The composite is a weighted blend of 9 inputs, each scored 0–100. Each bar is that input's sub-score; the figure is the points it added to the 100-point composite (weight × sub-score).
- ARV discount +7.5/15.0
- Schools +4.3/10.0
- Cash flow +4.2/30.0
- Condition / age +4.0/5.0
- Livability +3.3/5.0
- Rent growth +2.5/5.0
- 1% rule +0.3/10.0
- DSCR +0.0/10.0
- Appreciation +0.0/10.0
$275,990
🖨 Deal sheet 📄 Offer letter ✓ Due diligence
Listing remarks
This three-story townhome includes three bedrooms, two full bathrooms, two half bathrooms, and a two-car garage. The porch and garage entrances lead to a half bathroom and flex space, which can be converted into an office or guest bedroom with a full bathroom. The garage entrance offers an optional bench and cubbies or organizational cabinet. The first flight of stairs leads to the open concept great room with an optional fireplace which flows directly into the eat-in area and kitchen with an optional deck. Just outside the kitchen, there is a nook with an optional butlers pantry or organizational cabinet. A powder room completes the second floor. The third floor includes the primary suite
Key facts
- Dual vanities
- Walk-in closet
- Optional deck
Tags
Property features AI
Finance
- Financial info: List price $275,990
Exterior
- Parking: 2-car garage
- Home design: Corabell 3-story plan; 2-car garage; Plan located in Castle Hayne, NC
- Construction: New construction (plan)
- Exterior features: Living area approximately 1,777
Interior
- Bedrooms: 3 bedrooms
- Bathrooms: 2 full bathrooms and 1 half bathroom (2.5 total)
- Interior features: Active listing for a new construction plan
Neighborhood map
What this means for you Summary
Snapshot
- This is a 3-bed/2.5-bath single-family listed at $276k. Condition is rated good.
Deal economics
- At list price, monthly cash flow is $-1k ($-15k/yr) — negative.
- To cash-flow at today's rent, offer at most $274k (0.7% below list).
- To meet the 1% rule (rent ≥ 1% of price), the offer needs to be $240k (13.1% below list).
- Recommended offer: $240k (13.1% below list) — sets the bar for 1% rule.
- Cap rate 3.0% vs local median 4.1% in Murraysville — below-typical yield; the buyer is paying a premium for something (appreciation thesis, condition, location) that the cap rate doesn't capture.
Location & tenants
- Location reads 66/100 on livability (#294 in NC) — a middle-class / working-renter tenant base. Strengths: housing A+, cost of living A; Watch: employment C-, schools D, health & safety D.
- New Hanover County Schools (urban): math 48% / reading 53% proficiency, ranked #61 of 178 in NC (top 34%) — acceptable for families but not a draw, mixed tenant base, ~2y average lease.
- Market conditions: 185 active listings in the ZIP; 3 comparable units currently listed for rent nearby; rentals leasing fast (median 14d on market — plan ~1-2 weeks tenant-placement turnaround); 2,581 units permitted in New Hanover County in 2024 (1,185 in 5+ unit buildings).
- This rent runs 40% of the median local income ($72k/yr) — at the standard rent-burdened threshold; future hikes will face affordability resistance.
Forward outlook
- Local home prices are declining (-3.0%/yr); year-one equity from $3k of loan paydown is wiped out by about $14k of value loss. Plan a longer hold.
- New Hanover County population projected at +37% by 2050 — long-run rental-demand tailwind backs the buy-and-hold thesis.
Negotiation context
- It's been on market 17 days — a 2% lower offer ($272k) is reasonable based on typical stale-listing flexibility.
Questions for the listing agent
- What do current leases actually rent for vs. the listed asking? Can we see a recent rent roll and the last 12 months of T-12 income?
- Is there a deadline driving the sale (1031 exchange, divorce, estate, relocation)? That informs how much negotiation room exists.
- Schools are D-rated, which usually means shorter tenancies and higher turnover. Who's the typical renter profile here, and what's been the actual vacancy rate?
- The area grade is low — what's the realistic commute time and amenity access for the typical tenant pool here? Any planned neighborhood developments (good or bad) we should know about?
- What's the average days-on-market for RENTAL listings here right now (not sales)? A rising rental-DOM trend means longer vacancies and softer asking-rent achievability than the comps imply.
- What's the recent tenant-quality profile in this submarket — average credit score on applications, eviction rate, late-payment / NSF rate, and stable-employment percentage? A property-management company in the area should have these aggregated.
- How much new for-sale + rental construction is in the pipeline within 1–3 miles? Heavy new supply typically softens prices + rents 12–24 months out; constrained supply supports both.
Investment metrics
- 1% rule
- 0.53% ✗
- Cap rate
- 3.03%
- Cash-on-cash
- -11.64%
- DSCR
- 0.48
- GRM
- 15.7
CMA / ARV
- ARV (on-the-fly)
- $451,358
- Comps found
- 3
Show comp detail 3 sales within ~0.75 mi
| Address | Dist | Beds/Ba | Sqft | Sold | Price | $/sf | Match |
|---|---|---|---|---|---|---|---|
| 5600 Sidbury Rd | 0.30mi | 3/2.0 | 1,854 (+4%) | 13mo | $406,715 | $219 | 66 |
| 4001 Ennis Acres Dr | 0.47mi | 3/2.0 | 1,936 (+9%) | 10mo | $817,500 | $422 | 53 |
| 5813 Sidbury Rd | 0.64mi | 4/3.0 (+1) | 1,558 (-12%) | 7mo | $395,000 | $254 | 37 |
Match score weights: distance 35% · size 25% · config 20% · recency 20%. Top-matched comps best support the ARV.
Projected returns pro-forma
-3.0% appreciation · 3.0% rent growth · sell at horizon
- IRR
- -37.6%
- Equity multiple
- -0.20×
- Total profit
- $-151,151
- Equity at exit
- $67,299
- IRR
- -55.2%
- Equity multiple
- -0.84×
- Total profit
- $-231,972
- Equity at exit
- $39,025
Cash invested: $126,380 (down + closing). Projections, not guarantees.
Landlord ↔ Tenant lean methodology
- Overall (STATE)
- 85 Strongly Landlord-Friendly
- State North Carolina
- 85 Strongly Landlord-Friendly · R+3
- County
- — inherits STATE
- City
- — inherits STATE
ZIP-level market 28429
- Active inventory
- 185
- Price-to-rent
- 9.6×
Monthly cashflow live
- Estimated rent
- $2,397 medium interval (Pro) →
- Mortgage (P&I)
- −$2,367
- Tax est. 1.5%
- −$564 /mo · $6,770/yr
- Insurance
- −$188
- HOA
- −$0
- Vacancy / Maint / Mgmt
- −$503
- Net cashflow
- $-1,225
Break-even live
UW: 25.0% down · 7.5% · 30yr · 1.5% tax · 5.0% vac · 8.0% maint · 8.0% mgmt
Financing live
Cash to close
- Down payment
- $112,840
- Closing costs
- $13,541
- Reserves months
- —
- Total cash needed
- —
Loan-product check · same deal, 3 products live
Conventional
25% down · 7.5% · 30yr
- Down + closing
- —
- Monthly P&I
- —
- Monthly cashflow
- —
- DSCR
- —
- Eligible?
- —
Personal DTI + credit; lowest rate.
DSCR
20% down · 8.5% · 30yr
- Down + closing
- —
- Monthly P&I
- —
- Monthly cashflow
- —
- DSCR
- —
- Eligible?
- —
No personal income docs; deal must DSCR.
Hard money
10% down · 12.0% · 12mo
- Down + closing
- —
- Monthly P&I
- —
- Monthly cashflow
- —
- DSCR
- —
- Eligible?
- —
Short-term bridge; refi at stabilization.
Rent comps 3 comps
| Address | Beds | Baths | Sqft | Rent | $/sqft | DOM | Units | Dist |
|---|---|---|---|---|---|---|---|---|
| 4605 Sidbury Crossing Dr Castle Hayne, NC | 1.0–3.0 | 1.0–2.0 | 1031 | $2,017 | $1.96 | 13d | 89 | 0.29mi |
| 6105 Dichondra Dr Castle Hayne, NC | 3.0–5.0 | 2.0–3.0 | 2064 | $2,519 | $1.22 | 13d | 12 | 0.70mi |
| 4413 Cohan Cir Wilmington, NC | 1.0–3.0 | 1.0–3.0 | 979 | $1,695 | $1.73 | 13d | 20 | 1.18mi |
Listing history 14 events
-
2026-06-18days on market $275,990 Active 17 DOM
-
2026-06-17days on market $275,990 Active 16 DOM
-
2026-06-16days on market $275,990 Active 15 DOM
-
2026-06-15days on market $275,990 Active 14 DOM
-
2026-06-14days on market $275,990 Active 12 DOM
-
2026-06-13days on market $275,990 Active 11 DOM
-
2026-06-10days on market $275,990 Active 9 DOM
-
2026-06-09days on market $275,990 Active 8 DOM
-
2026-06-08days on market $275,990 Active 7 DOM
-
2026-06-07days on market $275,990 Active 6 DOM
-
2026-06-05days on market $275,990 Active 3 DOM
-
2026-06-03days on market $275,990 Active 2 DOM
-
2026-06-03remarks 699-char remark
-
2026-06-03$275,990 Active 1 DOM
ⓘ Source: listings_history table (triggers on properties + properties_extension) + one-shot
backfill from property_details.listing_events for pre-trigger history.
Nearby sold comps map
Loading sold comps map…
Walkable amenities ~0.75 mi
Loading nearby amenities…
Taxation est. · year 1
- Rental income
- $28,767
- − Mortgage interest
- −$25,283
- − Property taxes
- −$6,770
- − Insurance
- −$2,257
- − Repairs & maintenance
- −$2,301
- − Management
- −$2,301
- − Depreciation
- −$13,130
- Taxable loss
- −$23,277
- Est. tax savings @ 24.0%
- +$5,586
- After-tax cash flow
- $-9,119/yr
For passive investors: Depreciation is non-cash, so a rental often shows a tax loss while cash-flowing — sheltering income. Rental losses are passive: they offset passive income freely, and up to $25,000/yr can offset ordinary (W-2) income if you actively participate and your MAGI is under $100k (phasing out to $0 by $150k); unused losses carry forward. On sale, claimed depreciation is recaptured at up to 25%, and gains may owe capital-gains tax (a 1031 exchange can defer both). Figures are a year-1 estimate at your 24.0% rate — not tax advice; consult a CPA.
Condition & rehab AI · 12 photos
This three-story townhome is in good condition with no visible repairs needed. It offers a good investment opportunity with potential for both resale and rental value through minor updates and improvements.
Value-add opportunities
- Both Painting the exterior siding — Fresh paint can enhance the curb appeal and value of the home.
- Both Landscaping improvements — Well-maintained landscaping can increase both resale and rental value.
- Both Interior touch-ups — Fresh paint and minor touch-ups can improve the home's appearance and value.
- Rental HVAC maintenance — A well-maintained HVAC system can attract tenants and increase rental value.
- Resale Kitchen and bathroom updates — Modernizing the kitchen and bathrooms can significantly increase the home's resale value.
Renovation cost estimate screening
Value-add ROI direction
- Both Painting the exterior siding — Fresh paint can enhance the curb appeal and value of the home. ↑
- Both Landscaping improvements — Well-maintained landscaping can increase both resale and rental value. ↑
- Both Interior touch-ups — Fresh paint and minor touch-ups can improve the home's appearance and value. ↑
- Rental HVAC maintenance — A well-maintained HVAC system can attract tenants and increase rental value. ↑
- Resale Kitchen and bathroom updates — Modernizing the kitchen and bathrooms can significantly increase the home's resale value. ↑
ⓘ Cost ranges are severity-bucket heuristics (US national rule-of-thumb). Get contractor quotes + a written scope before underwriting a rehab budget.
Schools (NCES district)
- District
- New Hanover County Schools
- NCES district ID
- 3703330
- Math proficiency
- 48% ▼ -3.00%
- Reading proficiency
- 53% ▬ 0.00%
- Median HH income
- $49,406
- Composite
- 43.13/100
- National rank
- #3081
- State rank
- #61 of 178 in NC
Livability — Murraysville
- Score
- 66/100
- State rank
- #294
- US rank
- #12387
Category grades
Schools grade is shown separately in the Schools card above.
Census & demographics
- County
- New Hanover County · 232,153 people
- Metro
- Wilmington, NC
- Population (ZIP)
- 9,662
- Household income
- $72,337
- Rent vs Own
- Severe rent burden
- 110.0
Population outlook (New Hanover County) Hauer SSP2
- Today (2025)
- 259,517 people
- By 2030
- 279,586 · +7.7%
- By 2040
- 318,223 · +22.6%
- By 2050
- 354,831 · +36.7%
- By 2075
- 437,158 · +68.5%
- By 2100
- 486,769 · +87.6%
Race, ethnicity, and origin ACS 2023
- Neighborhood character
- Predominantly White (71%)
- Race & ethnicity
- White 71% Black 14% Hispanic / Latino 8% Two or more races 6%
- Hispanic origin (detail)
- Mexican 8%
- Common ancestry
- Italian 3% Slovak 3% Lithuanian 2%
- Foreign-born
- 3% · Canada
- Languages at home
- 94% English-only · Spanish 5% German/W. Germanic 1%
Political lean MEDSL · New Hanover
- 2024 margin
- Toss-up / Even · D 49.8% · R 49.1% · Other 1.1%
- 2008→2024 swing
- +2.0pp toward D · 2008: -1.4pp · 2024: 0.6pp
- All cycles
- 2024: D+0.6 2020: D+2.1 2016: R+4.1 2012: R+4.7 2008: R+1.4
Not yet ingested
- Civics
- —
Market trends
- HPI YoY
- ▼ -120.39%
- Current HPI
- 220.4084
- Rent YoY
- —
- Metro
- Wilmington, NC
- State GDP YoY
- ▲ 3.28%
- F500 in state
- 26
Industry mix (Fortune 500 HQ in NC)
| Industry | F500 HQs | Revenue |
|---|---|---|
| Financial Services | 2 | $213B |
|
||
| Retail | 2 | $95B |
|
||
| Industrial Conglomerate | 1 | $38B |
|
||
| Metals / Steel | 1 | $35B |
|
||
| Utilities | 1 | $30B |
|
||
| Industrial Machinery | 1 | $19B |
|
||
Cash-flow waterfall
monthlySold comps — $/sqft
last 12 mo · ≤1 miLoading sold comps…