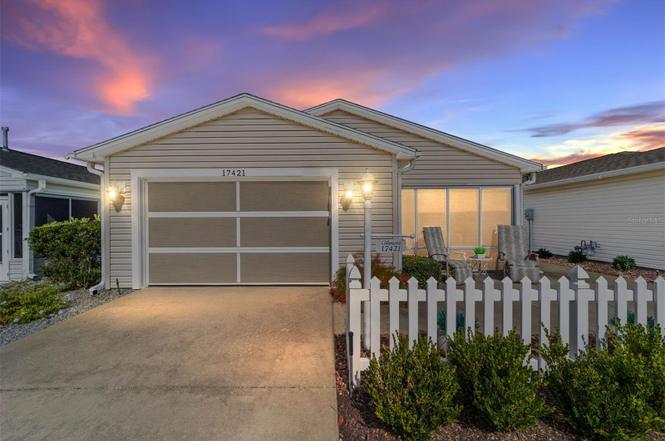
17421 SE 78th Harmony Cir · The Villages, FL
Flood risk 1/10 · Minimal
- FEMA flood zone
- X (unshaded)
- Chance of flooding over 30 yrs
- 0.0%
- Est. flood insurance / yr
- $507 – $1,088
Fire risk 4/10 · Minor
- Est. fire insurance / yr
- $947 – $1,759
Heat risk 8/10 · Major
- Hot days now (above 109°F)
- 7 days/yr
- Hot days in 30 yrs
- 18 days/yr
Wind risk 9/10 · Severe
- Chance of severe wind over 30 yrs
- 99.0%
Air-quality risk 3/10 · Minor
- Unhealthy air days now
- 2 days/yr
- Unhealthy air days in 30 yrs
- 2 days/yr
Risk factors via First Street. Map © Google.
Why this score? — see what drove the B- grade
The composite is a weighted blend of 9 inputs, each scored 0–100. Each bar is that input's sub-score; the figure is the points it added to the 100-point composite (weight × sub-score).
- Cash flow +28.5/30.0
- DSCR +10.0/10.0
- 1% rule +8.8/10.0
- ARV discount +5.8/15.0
- Schools +3.6/10.0
- Rent growth +3.5/5.0
- Livability +3.5/5.0
- Condition / age +2.5/5.0
- Appreciation +0.0/10.0
$259,000
🖨 Deal sheet (PDF) 📄 Offer letter ✓ Due diligence
Listing remarks
Enjoy the Sherwood Villas in this beautifully maintained COLONY PATIO VILLA featuring NO BOND! BOND PAID! This 2-bedroom, 2-bath home offers the perfect blend of comfort, style, and low-maintenance living. Step inside to find VAULTED CEILINGS, LUXURY VINYL PLANK AND TILE FLOORING (NO CARPET), MODERN PLANTATION SHUTTERS THROUGHOUT, FRESH INTERIOR PAINT, and multiple SOLAR TUBES that fill the home with natural light. The kitchen features UPGRADED STAINLESS APPLIANCES including a GAS RANGE, TILED BAR FRONT and opens to the spacious living and dining areas, creating an ideal space for entertaining and everyday living. The spacious PRIMARY SUITE serves as a private retreat and features a LARGE W
Key facts
- Multiple solar tubes
- Vaulted ceilings
- Fresh interior paint
Tags
Property features AI
Finance
- Other: Total lot approximately 0.08 acres (40x88, paved road); Living area reported as 1,160 sq ft; total building area 1,654 sq ft
- Financial info: CDD present
- HOA & community: HOA amenities include clubhouse, fitness center, pool, pickleball courts, tennis courts, racquetball, maintenance, and recreation facilities; Community features include clubhouse, community mailbox, deed restrictions, dog park, golf, no truck/RV/motorcycle parking, pool, and racquetball; Senior community; Pets allowed
Exterior
- Parking: Attached garage; 1-car garage
- Security: Community security
- Utilities: Public water; Public sewer; Cable available; High‑speed internet available; Electricity connected; Natural gas connected; Sprinkler meter; Water connected
- Home design: Single family residence (PUD); One story; East-facing; Colony Patio Villa model
- Construction: Vinyl siding and frame construction; Shingle roof; Slab foundation; Built as residential single-family
- Exterior features: Lighting; Rain gutters; Shade shutters; Sliding doors; Irrigation system
Interior
- Kitchen: Dishwasher; Microwave; Range; Refrigerator; Ice maker; Exhaust fan; Gas water heater
- Bedrooms: 2 bedrooms
- Flooring: Tile
- Bathrooms: 2 full bathrooms
- Heating & cooling: Central heating (natural gas); Central air conditioning
- Interior features: Ceiling fans; Eat-in kitchen; Living room/dining room combo; Open floorplan; Thermostat; Vaulted ceilings; Skylights; Shutters
- Laundry & utility: Laundry area in garage; Dryer
Neighborhood map
What this means for you Summary
Snapshot
- This is a 2-bed/2.0-bath single-family listed at $259k.
Deal economics
- At list price, monthly cash flow is $845 ($10k/yr) — positive.
- The deal already cash-flows at list — no discount required.
- Meets the 1% rule at list price ($4k rent vs $259k).
- Cap rate 10.2% vs local median 5.0% in The Villages — top-decile yield for the area; either an underpriced asset or a hidden risk that comps aren't pricing in. Stress-test before assuming the spread holds.
Location & tenants
- Location reads 70/100 on livability (#431 in FL) — a middle-class / working-renter tenant base. Strengths: crime A+, housing A, employment B+; Watch: amenities F, commute F, health & safety F.
- Marion (rural): math 42% / reading 43% proficiency, ranked #61 of 73 in FL (top 84%) — families likely to look elsewhere, expect single-tenant / working-renter base with shorter leases; 61% free/reduced lunch — lower-income household profile, screen leases tightly.
- Zoned schools: Harbour View Elementary School (math 41% / reading 38%, grade F, #1,513 of 2,144 statewide, top 73%, 819 students, 71% FRL); Lake Weir Middle School (math 37% / reading 33%, grade F, #416 of 571 statewide, top 74%, 1,207 students, 76% FRL); Belleview High School (math 31% / reading 46%, grade F, #321 of 667 statewide, top 49%, 1,783 students, 56% FRL).
- Market conditions: Rents rising (+3.9%/yr); 551 active listings in the ZIP; 6 comparable units currently listed for rent nearby; rentals at typical pace (median 23d on market — plan ~3-4 weeks tenant-placement turnaround); 7,071 units permitted in Marion County in 2024 (534 in 5+ unit buildings).
- At $3,584/mo this rent would consume 58% of the median local household income ($74k/yr) (locally 987% of renters already pay >50% of income on rent) — very limited rent-growth headroom before tenants either downsize or default.
Forward outlook
- Local home prices are declining (-3.0%/yr); year-one equity from $2k of loan paydown is wiped out by about $8k of value loss. Plan a longer hold.
- Marion County population projected at +13% by 2050 — modest demand growth; plan on rents tracking national, not racing it.
- At projected returns (-3.0% appreciation + 3.9% rent growth), your $73k cash investment doubles in ~8 years — after that, you're playing with house money.
Negotiation context
- Only 5 days on market — expect competitive offers; lowballing is unlikely to land.
Risks & watch-outs
- Climate carrying-cost: severe wind risk, 99% chance of damaging wind over 30y; extreme-heat days projected 7→18/yr by 2055 (HVAC capex compounding) — expect insurance premiums to compound above CPI over the hold.
Questions for the listing agent
- What does the HOA fee cover, when was the last increase, and are there any pending special assessments or reserve-fund shortfalls?
- Is there a deadline driving the sale (1031 exchange, divorce, estate, relocation)? That informs how much negotiation room exists.
- Schools are A-rated — typically a magnet for longer-tenancy family renters. What's the average tenant stay here, and is there a school-zone premium baked into asking?
- What's the average days-on-market for RENTAL listings here right now (not sales)? A rising rental-DOM trend means longer vacancies and softer asking-rent achievability than the comps imply.
- What's the recent tenant-quality profile in this submarket — average credit score on applications, eviction rate, late-payment / NSF rate, and stable-employment percentage? A property-management company in the area should have these aggregated.
- How much new for-sale + rental construction is in the pipeline within 1–3 miles? Heavy new supply typically softens prices + rents 12–24 months out; constrained supply supports both.
Investment metrics
- 1% rule
- 1.38% ✓
- Cap rate
- 10.21%
- Cash-on-cash
- 13.98%
- DSCR
- 1.62
- GRM
- 6.0
CMA / ARV
- ARV (on-the-fly)
- $249,400
- Comps found
- 7
Show comp detail 7 sales within ~0.75 mi
| Address | Dist | Beds/Ba | Sqft | Sold | Price | $/sf | Match |
|---|---|---|---|---|---|---|---|
| 17400 SE 77th Sycamore Ave | 0.17mi | 2/2.0 | 1,198 (+3%) | 8mo | $239,000 | $199 | 80 |
| 17395 SE 82nd Pecan Ter | 0.42mi | 2/2.0 | 1,202 (+4%) | 1mo | $229,900 | $191 | 74 |
| 17385 SE 76th Champion Ave | 0.27mi | 2/2.0 | 1,125 (-3%) | 13mo | $305,000 | $271 | 71 |
| 17126 SE 78th Larchmont Ct | 0.21mi | 2/2.0 | 1,229 (+6%) | 14mo | $352,000 | $286 | 68 |
| 8385 SE 173rd Hendricks Ln | 0.52mi | 2/2.0 | 1,177 (+2%) | 10mo | $295,000 | $251 | 65 |
| 16952 SE 81st Charlesfort Ave | 0.46mi | 2/2.0 | 1,163 (+0%) | 20mo | $245,000 | $211 | 62 |
| 17415 SE 82nd Pecan Ter | 0.42mi | 2/1.0 | 1,071 (-8%) | 10mo | $229,900 | $215 | 55 |
Match score weights: distance 35% · size 25% · config 20% · recency 20%. Top-matched comps best support the ARV.
Projected returns pro-forma
-3.0% appreciation · 3.92% rent growth · sell at horizon
- IRR
- 5.4%
- Equity multiple
- 1.21×
- Total profit
- $15,365
- Equity at exit
- $38,618
- IRR
- 15.7%
- Equity multiple
- 2.34×
- Total profit
- $97,380
- Equity at exit
- $22,394
Cash invested: $72,520 (down + closing). Projections, not guarantees.
Landlord ↔ Tenant lean methodology
- Overall (STATE)
- 87 Strongly Landlord-Friendly
- State Florida
- 87 Strongly Landlord-Friendly · R+3
- County
- — inherits STATE
- City
- — inherits STATE
ZIP-level market 32162
- Home prices YoY
- -6.9%
- Rents YoY
- 3.9%
- Active inventory
- 551
- Price-to-rent
- 6.0×
Monthly cashflow live
- Estimated rent
- $3,584 high interval (Pro) →
- Mortgage (P&I)
- −$1,358
- Tax from tax record
- −$317 /mo · $3,800/yr
- Insurance
- −$108
- HOA
- −$204
- Vacancy / Maint / Mgmt
- −$753
- Net cashflow
- $845
Break-even live
Sensitivity live
| Price | -10% $991 | -5% $918 | +0% $845 | +5% $772 | +10% $698 |
|---|---|---|---|---|---|
| Rent | -10% $562 | -5% $703 | +0% $845 | +5% $986 | +10% $1,128 |
| Rate | -1.0pp $975 | -0.5pp $911 | base $845 | +0.5pp $778 | +1.0pp $709 |
UW: 25.0% down · 7.5% · 30yr · 1.5% tax · 5.0% vac · 8.0% maint · 8.0% mgmt
Financing live
Cash to close
- Down payment
- $64,750
- Closing costs
- $7,770
- Reserves months
- —
- Total cash needed
- —
Loan-product check · same deal, 3 products live
Conventional
25% down · 7.5% · 30yr
- Down + closing
- —
- Monthly P&I
- —
- Monthly cashflow
- —
- DSCR
- —
- Eligible?
- —
Personal DTI + credit; lowest rate.
DSCR
20% down · 8.5% · 30yr
- Down + closing
- —
- Monthly P&I
- —
- Monthly cashflow
- —
- DSCR
- —
- Eligible?
- —
No personal income docs; deal must DSCR.
Hard money
10% down · 12.0% · 12mo
- Down + closing
- —
- Monthly P&I
- —
- Monthly cashflow
- —
- DSCR
- —
- Eligible?
- —
Short-term bridge; refi at stabilization.
Rent comps 6 comps
| Address | Beds | Baths | Sqft | Rent | $/sqft | DOM | Units | Dist |
|---|---|---|---|---|---|---|---|---|
| 17442 SE 79th Lovewood Ave The Villages, FL | 2.0 | 2.0 | 1148 | $4,500 | $3.92 | 22d | 1 | 0.03mi |
| 7630 SE 174th Gaillard Pl The Villages, FL | 2.0 | 2.0 | 1265 | $4,500 | $3.56 | 22d | 1 | 0.30mi |
| 17400 SE 82nd Roslyn Ct The Villages, FL | 2.0 | 2.0 | 1138 | $4,700 | $4.13 | 22d | 1 | 0.33mi |
| 17324 SE 82nd Pecan Ter The Villages, FL | 2.0 | 2.0 | 1358 | $2,500 | $1.84 | 22d | 1 | 0.37mi |
| 8544 SE 177th Bartram Loop The Villages, FL | 2.0 | 2.0 | 1265 | $1,900 | $1.50 | 22d | 1 | 0.66mi |
| 1808 Peachtree Ave The Villages, FL | 2.0 | 2.0 | 1182 | $2,500 | $2.12 | 22d | 1 | 1.37mi |
HOA detail
- Monthly dues
- $204 · $2,448/yr
- Likely covers
- gas
Listing history 4 events
-
2026-06-21days on market $259,000 Active 5 DOM
-
2026-06-18days on market $259,000 Active 2 DOM
-
2026-06-16remarks 699-char remark
-
2026-06-16$259,000 Active 1 DOM
ⓘ Source: listings_history table (triggers on properties + properties_extension) + one-shot
backfill from property_details.listing_events for pre-trigger history.
Tax reassessment forecast FL · Resets to sale price
- Current annual tax
- $3,800 · $317/mo
- Projected year-2 tax
- $3,800 · $317/mo
- Expected delta
- $0/yr ($0/mo · 0.0%)
ⓘ Screening estimate from a state-policy table — verify with the county assessor before closing.
Climate risk First Street
- Flood 1/10 Low FEMA zone X (unshaded) · 0% chance over 30 yrs
- Wildfire 4/10 Moderate
- Heat 8/10 Severe 7 d/yr ≥109°F today · 18 d/yr by 30 yrs out
- Wind 9/10 Extreme 99% chance of damaging wind over 30 yrs
- Air quality 3/10 Moderate 2 unhealthy d/yr today · 2 by 30 yrs out
Nearby sold comps map
Loading sold comps map…
Walkable amenities ~0.75 mi
Loading nearby amenities…
Taxation est. · year 1
- Rental income
- $43,013
- − Mortgage interest
- −$14,508
- − Property taxes
- −$3,800
- − Insurance
- −$1,295
- − Repairs & maintenance
- −$3,441
- − Management
- −$3,441
- − HOA
- −$2,448
- − Depreciation
- −$7,535
- Taxable income
- $6,545
- Est. tax owed @ 24.0%
- −$1,571
- After-tax cash flow
- $8,568/yr
For passive investors: Depreciation is non-cash, so a rental often shows a tax loss while cash-flowing — sheltering income. Rental losses are passive: they offset passive income freely, and up to $25,000/yr can offset ordinary (W-2) income if you actively participate and your MAGI is under $100k (phasing out to $0 by $150k); unused losses carry forward. On sale, claimed depreciation is recaptured at up to 25%, and gains may owe capital-gains tax (a 1031 exchange can defer both). Figures are a year-1 estimate at your 24.0% rate — not tax advice; consult a CPA.
Schools (NCES district)
- District
- Marion
- NCES district ID
- 1201260
- Math proficiency
- 42% ▼ -7.00%
- Reading proficiency
- 43% ▼ -4.00%
- Median HH income
- $40,015
- Composite
- 35.61/100
- National rank
- #4890
- State rank
- #61 of 73 in FL
Livability — The Villages
- Score
- 70/100
- State rank
- #431
- US rank
- #7363
Category grades
Schools grade is shown separately in the Schools card above.
Census & demographics
- Census place
- The Villages, FL
- County
- Sumter County · 110,591 people
- City population
- 83,973
- Metro
- The Villages, FL
- Population (ZIP)
- 55,424
- Household income
- $74,119
- Rent vs Own
- Severe rent burden
- 987.0
Population outlook (Marion County) Hauer SSP2
- Today (2025)
- 365,905 people
- By 2030
- 376,768 · +3.0%
- By 2040
- 396,555 · +8.4%
- By 2050
- 412,723 · +12.8%
- By 2075
- 446,090 · +21.9%
- By 2100
- 436,193 · +19.2%
Race, ethnicity, and origin ACS 2023
- Neighborhood character
- Predominantly White (95%)
- Race & ethnicity
- White 95% Two or more races 2% Hispanic / Latino 2% Asian 1% Black 1%
- Common ancestry
- Romanian 7% Slovak 4% Lithuanian 4%
- Foreign-born
- 5% · Canada
- Languages at home
- 96% English-only · Spanish 1% Tagalog/Filipino 1%
Political lean MEDSL · Marion
- 2024 margin
- Solid R (+31.6) · D 33.8% · R 65.5%
- 2008→2024 swing
- -20.0pp toward R · 2008: -11.6pp · 2024: -31.6pp
- All cycles
- 2024: R+31.6 2020: R+25.9 2016: R+26.2 2012: R+16.2 2008: R+11.6
Not yet ingested
- Civics
- —
Market trends
- HPI YoY
- ▼ -16.16%
- Current HPI
- 218.1956
- Rent YoY
- ▲ 3.92%
- Metro
- The Villages, FL
- State GDP YoY
- ▲ 3.28%
- F500 in state
- 36
Industry mix (Fortune 500 HQ in FL)
| Industry | F500 HQs | Revenue |
|---|---|---|
| Industrial Technology | 2 | $29B |
|
||
| Insurance | 2 | $17B |
|
||
| Retail | 1 | $60B |
|
||
| Technology Distribution | 1 | $58B |
|
||
| Homebuilding | 1 | $35B |
|
||
| Technology Manufacturing | 1 | $35B |
|
||
Price history
1 event — show timeline
- 2026-06-16 Listed $259,000 Stellar MLS as Distributed by MLS Grid
Property tax history
+8.5%/yrLatest (2025): $3,800 · +6.2% YoY. Source: county tax records.
Cash-flow waterfall
monthlySold comps — $/sqft
last 12 mo · ≤1 miLoading sold comps…