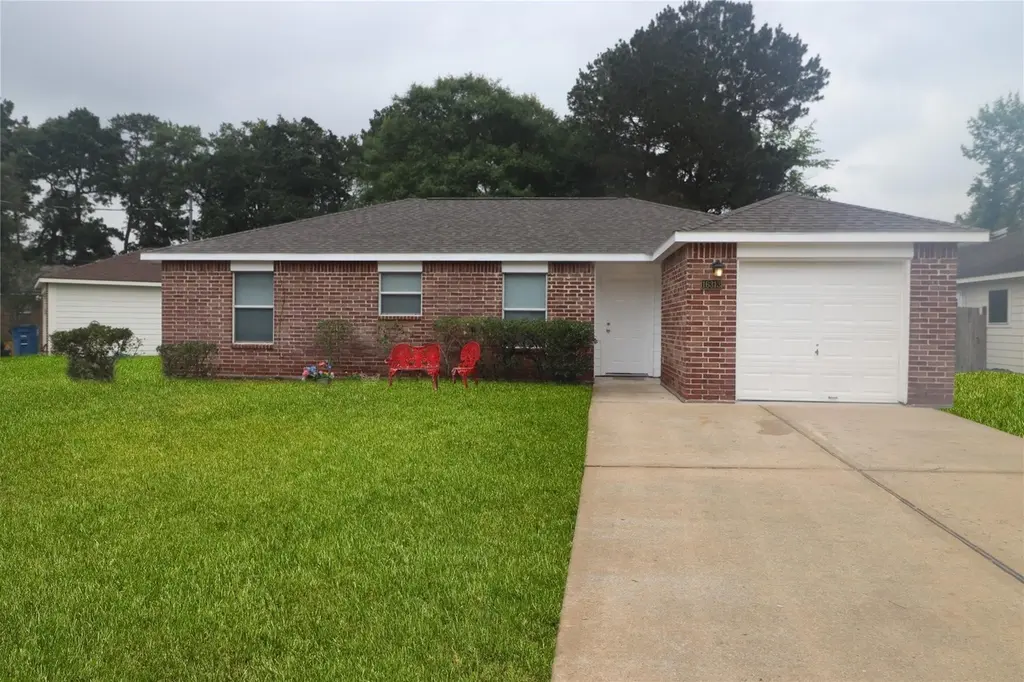
16313 Many Trees Ln · Grangerland, TX
Flood risk 1/10 · Minimal
- FEMA flood zone
- X (unshaded)
- Chance of flooding over 30 yrs
- 0.0%
- Est. flood insurance / yr
- $507 – $1,088
Fire risk 4/10 · Minor
- Est. fire insurance / yr
- $1,222 – $2,270
Heat risk 9/10 · Severe
- Hot days now (above 111°F)
- 7 days/yr
- Hot days in 30 yrs
- 26 days/yr
Wind risk 8/10 · Major
- Chance of severe wind over 30 yrs
- 99.0%
Air-quality risk 3/10 · Minor
- Unhealthy air days now
- 2 days/yr
- Unhealthy air days in 30 yrs
- 3 days/yr
Risk factors via First Street. Map © Google.
Why this score? — see what drove the C grade
The composite is a weighted blend of 9 inputs, each scored 0–100. Each bar is that input's sub-score; the figure is the points it added to the 100-point composite (weight × sub-score).
- Cash flow +21.3/30.0
- ARV discount +12.5/15.0
- DSCR +6.8/10.0
- 1% rule +5.8/10.0
- Schools +5.1/10.0
- Rent growth +3.3/5.0
- Livability +2.5/5.0
- Condition / age +2.5/5.0
- Appreciation +0.0/10.0
$189,900
🖨 Deal sheet 📄 Offer letter ✓ Due diligence
Listing remarks
3 bedroom 2 bath home is situated on a spacious cul-de-sac with no through traffic. The property boasts an open floor plan with high ceilings. The backyard is designed for low maintenance, allowing for effortless enjoyment of the outdoor space. Positioned in close proximity to the heart of Montgomery County.
Key facts
- Open floor plan
- Cul-de-sac
- 6,965 sq ft lot
Tags
Property features AI
Finance
- Financial info: Lease considered
- HOA & community: Association: CMI; Association fee $125 quarterly
Exterior
- Parking: Attached garage with 1 parking space
- Utilities: Public water; Public sewer
- Home design: Residential property; Single-story (entry level not specified); Facing direction not specified
- Construction: Built in 2003; Brick construction; Composition roof; Slab foundation
- Exterior features: Cul-de-sac lot in a subdivision; Community pool
Interior
- Kitchen: Electric oven; Electric range
- Bedrooms: 3 total rooms
- Bathrooms: 2 full bathrooms
- Heating & cooling: Central gas heating; Central electric air conditioning
- Interior features: Washer hookup and electric dryer hookup; Electric oven and electric range
- Laundry & utility: Washer hookup; Electric dryer hookup
Neighborhood map
What this means for you Summary
Snapshot
- This is a 3-bed/2.0-bath single-family listed at $190k.
Deal economics
- At list price, monthly cash flow is $276 ($3k/yr) — positive.
- The deal already cash-flows at list — no discount required.
- Meets the 1% rule at list price ($2k rent vs $190k).
- Cap rate 8.0% vs local median 5.1% in Grangerland — top-decile yield for the area; either an underpriced asset or a hidden risk that comps aren't pricing in. Stress-test before assuming the spread holds.
Location & tenants
- Location reads: area grade C — affects rentability + tenant quality, not the cash-flow math above.
- Conroe ISD (other): math 57% / reading 57% proficiency, ranked #69 of 826 in TX (top 8%) — acceptable for families but not a draw, mixed tenant base, ~2y average lease.
- Zoned schools: San Jacinto El (math 35% / reading 37%, grade F, #1,921 of 4,322 statewide, top 45%, 547 students, 81% FRL); Caney Creek H S (math 33% / reading 42%, grade F, #888 of 1,632 statewide, top 55%, 2,504 students, 79% FRL) — zoned schools average 80% FRL vs 34% district-wide (46 pts higher); higher-poverty schools than district average — tighter screening recommended.
- Zoned-school proficiency averages 37% at this address vs 57% district-wide (-20 pts) — the specific schools serving this property underperform the Conroe ISD average; the district grade overstates school quality for this exact location.
- Market conditions: Rents rising (+3.3%/yr); 1111 active listings in the ZIP; solid renter incomes; 13,259 units permitted in Montgomery County in 2024 (1,402 in 5+ unit buildings).
Forward outlook
- Local home prices are declining (-3.0%/yr); year-one equity from $1k of loan paydown is wiped out by about $6k of value loss. Plan a longer hold.
- Montgomery County population projected at +65% by 2050 — long-run rental-demand tailwind backs the buy-and-hold thesis.
Negotiation context
- Only 14 days on market — expect competitive offers; lowballing is unlikely to land.
- 4 sale attempts; this cycle's ask is 12152% above the opening price — seller raised mid-cycle; expect resistance to lowballs.
Risks & watch-outs
- Climate carrying-cost: severe wind risk, 99% chance of damaging wind over 30y; extreme-heat days projected 7→26/yr by 2055 (HVAC capex compounding) — expect insurance premiums to compound above CPI over the hold.
Questions for the listing agent
- What does the HOA fee cover, when was the last increase, and are there any pending special assessments or reserve-fund shortfalls?
- Is there a deadline driving the sale (1031 exchange, divorce, estate, relocation)? That informs how much negotiation room exists.
- What's the average days-on-market for RENTAL listings here right now (not sales)? A rising rental-DOM trend means longer vacancies and softer asking-rent achievability than the comps imply.
- What's the recent tenant-quality profile in this submarket — average credit score on applications, eviction rate, late-payment / NSF rate, and stable-employment percentage? A property-management company in the area should have these aggregated.
- How much new for-sale + rental construction is in the pipeline within 1–3 miles? Heavy new supply typically softens prices + rents 12–24 months out; constrained supply supports both.
Investment metrics
- 1% rule
- 1.08% ✓
- Cap rate
- 8.04%
- Cash-on-cash
- 6.24%
- DSCR
- 1.28
- GRM
- 7.7
CMA / ARV
- ARV (on-the-fly)
- $213,527
- Comps found
- 12
Show comp detail 12 sales within ~0.75 mi
| Address | Dist | Beds/Ba | Sqft | Sold | Price | $/sf | Match |
|---|---|---|---|---|---|---|---|
| 16228 Sun View Ln | 0.13mi | 3/2.0 | 1,145 (+7%) | 5mo | $180,000 | $157 | 79 |
| 16317 Sun View Ln | 0.22mi | 3/2.0 | 1,154 (+8%) | 5mo | $190,000 | $165 | 73 |
| 16956 Juniper Blossom Bnd | 0.19mi | 3/2.0 | 1,206 (+12%) | 6mo | $228,485 | $189 | 65 |
| 16944 Juniper Blossom Bnd | 0.18mi | 3/2.0 | 1,204 (+12%) | 8mo | $248,847 | $207 | 65 |
| 16924 Juniper Blossom Bnd | 0.19mi | 3/2.0 | 1,204 (+12%) | 11mo | $246,729 | $205 | 62 |
| 16408 Windy Cove Ct | 0.33mi | 3/2.0 | 1,204 (+12%) | 6mo | $234,460 | $195 | 59 |
| 15324 Twinflower Cv | 0.23mi | 3/2.0 | 1,208 (+13%) | 12mo | $234,986 | $195 | 58 |
| 15229 Canyon Rapids Rd | 0.32mi | 3/2.0 | 1,204 (+12%) | 10mo | $239,990 | $199 | 57 |
| 16403 Windy Cove Ct | 0.34mi | 3/2.0 | 1,206 (+12%) | 10mo | $244,330 | $203 | 55 |
| 16125 Sepia Manor St | 0.59mi | 3/2.0 | 1,204 (+12%) | 3mo | $239,840 | $199 | 50 |
| 16301 Wild Oak Ln | 0.67mi | 3/2.0 | 1,120 (+4%) | 17mo | $164,500 | $147 | 47 |
| 16181 Sepia Manor St | 0.61mi | 3/2.5 | 1,204 (+12%) | 7mo | $239,990 | $199 | 43 |
Match score weights: distance 35% · size 25% · config 20% · recency 20%. Top-matched comps best support the ARV.
Projected returns pro-forma
-3.0% appreciation · 3.3% rent growth · sell at horizon
- IRR
- -6.3%
- Equity multiple
- 0.76×
- Total profit
- $-12,496
- Equity at exit
- $28,315
- IRR
- 3.7%
- Equity multiple
- 1.27×
- Total profit
- $14,542
- Equity at exit
- $16,419
Cash invested: $53,172 (down + closing). Projections, not guarantees.
Landlord ↔ Tenant lean methodology
- Overall (STATE)
- 87 Strongly Landlord-Friendly
- State Texas
- 87 Strongly Landlord-Friendly · R+5
- County
- — inherits STATE
- City
- — inherits STATE
ZIP-level market 77302
- Rents YoY
- 3.3%
- Active inventory
- 1111
- Price-to-rent
- 7.7×
Monthly cashflow live
- Estimated rent
- $2,045 medium interval (Pro) →
- Mortgage (P&I)
- −$996
- Tax from tax record
- −$222 /mo · $2,669/yr
- Insurance
- −$79
- HOA
- −$42
- Vacancy / Maint / Mgmt
- −$430
- Net cashflow
- $276
Break-even live
UW: 25.0% down · 7.5% · 30yr · 1.5% tax · 5.0% vac · 8.0% maint · 8.0% mgmt
Financing live
Cash to close
- Down payment
- $47,475
- Closing costs
- $5,697
- Reserves months
- —
- Total cash needed
- —
Loan-product check · same deal, 3 products live
Conventional
25% down · 7.5% · 30yr
- Down + closing
- —
- Monthly P&I
- —
- Monthly cashflow
- —
- DSCR
- —
- Eligible?
- —
Personal DTI + credit; lowest rate.
DSCR
20% down · 8.5% · 30yr
- Down + closing
- —
- Monthly P&I
- —
- Monthly cashflow
- —
- DSCR
- —
- Eligible?
- —
No personal income docs; deal must DSCR.
Hard money
10% down · 12.0% · 12mo
- Down + closing
- —
- Monthly P&I
- —
- Monthly cashflow
- —
- DSCR
- —
- Eligible?
- —
Short-term bridge; refi at stabilization.
HOA detail
- Monthly dues
- $42 · $504/yr
Listing history 9 events
-
2026-06-18days on market $189,900 Active 14 DOM
-
2026-06-17days on market $189,900 Active 13 DOM
-
2026-06-16days on market $189,900 Active 12 DOM
-
2026-06-15days on market $189,900 Active 11 DOM
-
2026-06-13days on market $189,900 Active 9 DOM
-
2026-06-09days on market $189,900 Active 5 DOM
-
2026-06-08days on market $189,900 Active 4 DOM
-
2026-06-07remarks 309-char remark
-
2026-06-07$189,900 Active 3 DOM
ⓘ Source: listings_history table (triggers on properties + properties_extension) + one-shot
backfill from property_details.listing_events for pre-trigger history.
Tax reassessment forecast TX · Resets to sale price
- Current annual tax
- $2,669 · $222/mo
- Projected year-2 tax
- $3,475 · $290/mo
- Expected delta
- +$806/yr (+$67/mo · 30.2%)
ⓘ Screening estimate from a state-policy table — verify with the county assessor before closing.
Climate risk First Street
- Flood 1/10 Low FEMA zone X (unshaded) · 0% chance over 30 yrs
- Wildfire 4/10 Moderate
- Heat 9/10 Extreme 7 d/yr ≥111°F today · 26 d/yr by 30 yrs out
- Wind 8/10 Severe 99% chance of damaging wind over 30 yrs
- Air quality 3/10 Moderate 2 unhealthy d/yr today · 3 by 30 yrs out
Nearby sold comps map
Loading sold comps map…
Walkable amenities ~0.75 mi
Loading nearby amenities…
Taxation est. · year 1
- Rental income
- $24,545
- − Mortgage interest
- −$10,637
- − Property taxes
- −$2,669
- − Insurance
- −$950
- − Repairs & maintenance
- −$1,964
- − Management
- −$1,964
- − HOA
- −$504
- − Depreciation
- −$5,524
- Taxable income
- $334
- Est. tax owed @ 24.0%
- −$80
- After-tax cash flow
- $3,238/yr
For passive investors: Depreciation is non-cash, so a rental often shows a tax loss while cash-flowing — sheltering income. Rental losses are passive: they offset passive income freely, and up to $25,000/yr can offset ordinary (W-2) income if you actively participate and your MAGI is under $100k (phasing out to $0 by $150k); unused losses carry forward. On sale, claimed depreciation is recaptured at up to 25%, and gains may owe capital-gains tax (a 1031 exchange can defer both). Figures are a year-1 estimate at your 24.0% rate — not tax advice; consult a CPA.
Schools (NCES district)
- District
- Conroe ISD
- NCES district ID
- 4815000
- Math proficiency
- 57% ▼ -6.00%
- Reading proficiency
- 57% ▼ -1.00%
- Median HH income
- $71,541
- Composite
- 50.65/100
- National rank
- #1833
- State rank
- #69 of 826 in TX
Livability — Grangerland
No livability data for this city. (Only ~50 U.S. cities are tracked.)
Census & demographics
- County
- Montgomery County · 663,713 people
- Metro
- Houston-The Woodlands-Sugar Land, TX
- Population (ZIP)
- 21,546
- Household income
- $84,673
- Rent vs Own
- Severe rent burden
- 205.0
Population outlook (Montgomery County) Hauer SSP2
- Today (2025)
- 713,896 people
- By 2030
- 805,263 · +12.8%
- By 2040
- 992,708 · +39.1%
- By 2050
- 1,179,590 · +65.2%
- By 2075
- 1,628,084 · +128.1%
- By 2100
- 1,937,880 · +171.5%
Race, ethnicity, and origin ACS 2023
- Neighborhood character
- Majority White (63%)
- Race & ethnicity
- White 63% Hispanic / Latino 29% Two or more races 19% Black 3% Asian 1%
- Hispanic origin (detail)
- Mexican 26% Puerto Rican 1%
- Common ancestry
- Lithuanian 3% Italian 2% Slovak 2%
- Foreign-born
- 13% · Canada, Vietnam, China
- Languages at home
- 78% English-only · Spanish 20% Russian/Polish/Slavic 1% Other Indo-European 0%
Political lean MEDSL · Montgomery
- 2024 margin
- Solid R (+45.5) · D 26.8% · R 72.3%
- 2008→2024 swing
- +7.2pp toward D · 2008: -52.7pp · 2024: -45.5pp
- All cycles
- 2024: R+45.5 2020: R+43.8 2016: R+51.4 2012: R+60.7 2008: R+52.7
Not yet ingested
- Civics
- —
Market trends
- HPI YoY
- ▼ -187.56%
- Current HPI
- 262.1879
- Rent YoY
- ▲ 3.30%
- Metro
- Houston-The Woodlands-Sugar Land, TX
- State GDP YoY
- ▲ 3.95%
- F500 in state
- 110
Industry mix (Fortune 500 HQ in TX)
| Industry | F500 HQs | Revenue |
|---|---|---|
| Energy | 16 | $1,198B |
|
||
| Technology | 5 | $198B |
|
||
| Engineering / Construction | 4 | $72B |
|
||
| Energy Services | 3 | $60B |
|
||
| Utilities | 3 | $41B |
|
||
| Healthcare | 2 | $330B |
|
||
Price history
-99.2% since first listed8 events — show timeline
- 2026-06-05 Listed for Rent $1,550 HARMLS
- 2026-06-04 Listed $189,900 HARMLS
- 2025-05-27 Rental Removed $1,550 HARMLS
- 2025-05-27 Listing Removed — HARMLS
- 2025-05-07 Listed for Rent $1,550 HARMLS
- 2025-04-25 Price Changed $199,500 HARMLS
- 2025-04-08 Listed $204,900 HARMLS
- 2023-05-25 Rental Removed — HARMLS
Property tax history
+4.1%/yrLatest (2025): $2,669 · -3.4% YoY. Source: county tax records.
Cash-flow waterfall
monthlySold comps — $/sqft
last 12 mo · ≤1 miLoading sold comps…