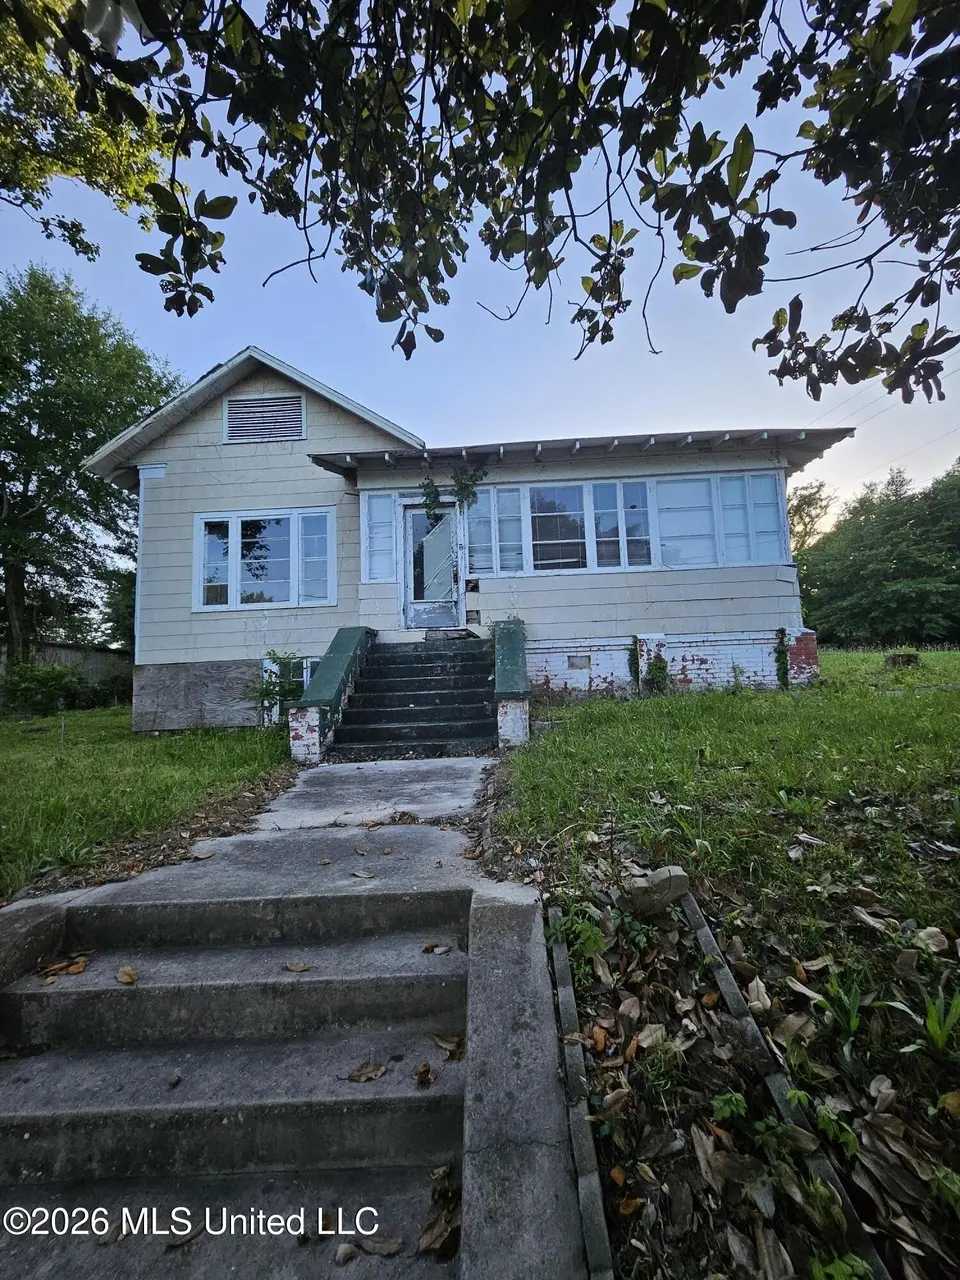
604 S Broadway St · McComb, MS
Flood risk 1/10 · Minimal
- FEMA flood zone
- X (unshaded)
- Chance of flooding over 30 yrs
- 0.0%
- Est. flood insurance / yr
- $507 – $1,088
Fire risk 4/10 · Minor
- Est. fire insurance / yr
- $1,241 – $2,305
Heat risk 8/10 · Major
- Hot days now (above 109°F)
- 7 days/yr
- Hot days in 30 yrs
- 21 days/yr
Wind risk 8/10 · Major
- Chance of severe wind over 30 yrs
- 99.0%
Air-quality risk 1/10 · Minimal
- Unhealthy air days now
- 0 days/yr
- Unhealthy air days in 30 yrs
- 0 days/yr
Risk factors via First Street. Map © Google.
Why this score? — see what drove the B- grade
The composite is a weighted blend of 9 inputs, each scored 0–100. Each bar is that input's sub-score; the figure is the points it added to the 100-point composite (weight × sub-score).
- Cash flow +30.0/30.0
- 1% rule +10.0/10.0
- DSCR +10.0/10.0
- ARV discount +7.5/15.0
- Livability +3.5/5.0
- Rent growth +2.5/5.0
- Condition / age +2.5/5.0
- Schools +1.2/10.0
- Appreciation +0.0/10.0
$45,000
🖨 Deal sheet 📄 Offer letter ✓ Due diligence
Listing remarks
Step back in time with this charming 1954 time-capsule waiting for your modern touch! Located in a nice neighborhood on a corner lot, this home is being sold as-is. Perfect for flippers, contractors, or those looking to restore a vintage home to its former glory. The property offers tremendous potential for expansion or a complete custom redesign. Property is being sold in its current condition; bring your contractor and imagination. Seller is saying bring your offer.
Key facts
- 0.33 acre lot
- Built 1954
- Listed 34 days
Property features AI
Exterior
- Parking: Driveway; Parking pad
- Utilities: Public water; Public sewer; Electricity available; Sewer available
- Home design: Single Family Residence; House with two stories; Living area reported from public records
- Construction: Masonry construction; Conventional foundation; Built year reported from public records
- Exterior features: Asphalt shingle roof; Lot approximately 0.33 acres
Interior
- Bathrooms: 2 bathrooms
- Heating & cooling: No central cooling indicated
- Interior features: Two-level layout
Neighborhood map
What this means for you Summary
Snapshot
- This is a 4-bed/2.0-bath single-family listed at $45k.
Deal economics
- At list price, monthly cash flow is $845 ($10k/yr) — positive.
- The deal already cash-flows at list — no discount required.
- Meets the 1% rule at list price ($1k rent vs $45k).
- Recommended offer: $44k (3.0% below list) — sets the bar for market timing.
- Cap rate 28.8% vs local median 6.5% in McComb — top-decile yield for the area; either an underpriced asset or a hidden risk that comps aren't pricing in. Stress-test before assuming the spread holds.
Location & tenants
- Location reads 69/100 on livability (#50 in MS) — a middle-class / working-renter tenant base. Strengths: cost of living A+, health & safety A+, housing A-; Watch: schools D-, amenities F, commute F.
- Mccomb School District (town): math 15% / reading 16% proficiency, ranked #106 of 130 in MS (top 82%) — low school quality limits family demand, transient renter base, plan for 1-2y turnover; 93% free/reduced lunch — lower-income household profile, screen leases tightly.
- Market conditions: 190 active listings in the ZIP; 10 units permitted in Pike County in 2024 (0 in 5+ unit buildings).
Forward outlook
- Local home prices are declining (-3.0%/yr); year-one equity from $311 of loan paydown is wiped out by about $1k of value loss. Plan a longer hold.
- Pike County population projected at -14% by 2050 — secular population decline; favor cash flow + early exit over multi-decade hold.
- At projected returns (-3.0% appreciation + 3.0% rent growth), your $13k cash investment doubles in ~2 years — after that, you're playing with house money.
Negotiation context
- It's been on market 35 days — a 3% lower offer ($44k) is reasonable based on typical stale-listing flexibility.
- 2 sale attempts since 4y ago with the ask held roughly flat each time — persistent listings suggest the price (not the market) is what's stuck; bring a comps-based counter.
Risks & watch-outs
- Watch-outs: built in 1954 — expect roof / HVAC / electrical / plumbing capex.
- Climate carrying-cost: severe wind risk, 99% chance of damaging wind over 30y; extreme-heat days projected 7→21/yr by 2055 (HVAC capex compounding) — expect insurance premiums to compound above CPI over the hold.
Questions for the listing agent
- It's been on market 35 days. Have you received any prior offers? Is the seller open to a 3% concession, seller financing, or rate buy-down credit?
- Built in 1954 — when were the roof, HVAC, electrical panel, plumbing, and water heater last replaced?
- Is there a deadline driving the sale (1031 exchange, divorce, estate, relocation)? That informs how much negotiation room exists.
- Schools are D-rated, which usually means shorter tenancies and higher turnover. Who's the typical renter profile here, and what's been the actual vacancy rate?
- What's the average days-on-market for RENTAL listings here right now (not sales)? A rising rental-DOM trend means longer vacancies and softer asking-rent achievability than the comps imply.
- What's the recent tenant-quality profile in this submarket — average credit score on applications, eviction rate, late-payment / NSF rate, and stable-employment percentage? A property-management company in the area should have these aggregated.
- How much new for-sale + rental construction is in the pipeline within 1–3 miles? Heavy new supply typically softens prices + rents 12–24 months out; constrained supply supports both.
Investment metrics
- 1% rule
- 3.22% ✓
- Cap rate
- 28.82%
- Cash-on-cash
- 80.46%
- DSCR
- 4.58
- GRM
- 2.6
CMA / ARV
- ARV (median comp)
- $90,948
- List price
- $45,000
- Delta
- -50.52%
- Verdict
- UNDERPRICED
- Comps
- 20 within 1.0 mi
Show comp detail 5 sales within ~0.75 mi
| Address | Dist | Beds/Ba | Sqft | Sold | Price | $/sf | Match |
|---|---|---|---|---|---|---|---|
| 419 24th | 0.36mi | 3/2.0 (-1) | 2,753 (-1%) | 17mo | $40,000 | $15 | 62 |
| 601 Pennsylvania Ave | 0.44mi | 4/2.0 | 3,095 (+11%) | 1mo | $100,000 | $32 | 61 |
| 116 5th Ave | 0.32mi | 5/2.0 (+1) | 2,584 (-7%) | 13mo | $69,900 | $27 | 57 |
| 424 3 Rd | 0.35mi | 5/3.0 (+1) | 2,571 (-8%) | 10mo | $68,000 | $26 | 53 |
| 430 3rd St | 0.35mi | 4/2.0 | 2,478 (-11%) | 24mo | $65,000 | $26 | 45 |
Match score weights: distance 35% · size 25% · config 20% · recency 20%. Top-matched comps best support the ARV.
Projected returns pro-forma
-3.0% appreciation · 3.0% rent growth · sell at horizon
- IRR
- 80.7%
- Equity multiple
- 4.69×
- Total profit
- $46,532
- Equity at exit
- $6,710
- IRR
- 84.1%
- Equity multiple
- 9.72×
- Total profit
- $109,865
- Equity at exit
- $3,891
Cash invested: $12,600 (down + closing). Projections, not guarantees.
Landlord ↔ Tenant lean methodology
- Overall (STATE)
- 90 Strongly Landlord-Friendly
- State Mississippi
- 90 Strongly Landlord-Friendly · R+11
- County
- — inherits STATE
- City
- — inherits STATE
ZIP-level market 39648
- Active inventory
- 190
- Price-to-rent
- 2.6×
Monthly cashflow live
- Estimated rent
- $1,448 medium interval (Pro) →
- Mortgage (P&I)
- −$236
- Tax from tax record
- −$44 /mo · $528/yr
- Insurance
- −$19
- HOA
- −$0
- Vacancy / Maint / Mgmt
- −$304
- Net cashflow
- $845
Break-even live
UW: 25.0% down · 7.5% · 30yr · 1.5% tax · 5.0% vac · 8.0% maint · 8.0% mgmt
Financing live
Cash to close
- Down payment
- $11,250
- Closing costs
- $1,350
- Reserves months
- —
- Total cash needed
- —
Loan-product check · same deal, 3 products live
Conventional
25% down · 7.5% · 30yr
- Down + closing
- —
- Monthly P&I
- —
- Monthly cashflow
- —
- DSCR
- —
- Eligible?
- —
Personal DTI + credit; lowest rate.
DSCR
20% down · 8.5% · 30yr
- Down + closing
- —
- Monthly P&I
- —
- Monthly cashflow
- —
- DSCR
- —
- Eligible?
- —
No personal income docs; deal must DSCR.
Hard money
10% down · 12.0% · 12mo
- Down + closing
- —
- Monthly P&I
- —
- Monthly cashflow
- —
- DSCR
- —
- Eligible?
- —
Short-term bridge; refi at stabilization.
Listing history 20 events
-
2026-06-18days on market $45,000 Active 35 DOM
-
2026-06-17days on market $45,000 Active 34 DOM
-
2026-06-16days on market $45,000 Active 33 DOM
-
2026-06-15days on market $45,000 Active 32 DOM
-
2026-06-13days on market $45,000 Active 30 DOM
-
2026-06-12days on market $45,000 Active 29 DOM
-
2026-06-09days on market $45,000 Active 26 DOM
-
2026-06-08days on market $45,000 Active 25 DOM
-
2026-06-07days on market $45,000 Active 24 DOM
-
2026-06-07days on market $45,000 Active 23 DOM
-
2026-06-04days on market $45,000 Active 20 DOM
-
2026-06-02days on market $45,000 Active 19 DOM
-
2026-06-01days on market $45,000 Active 18 DOM
-
2026-05-31days on market $45,000 Active 17 DOM
-
2026-05-14$45,000 Active 472-char remark
-
2022-05-27soldstatus
-
2022-05-10historical
-
2022-01-28$35,000
-
2005-04-14soldstatus
-
2004-09-09soldstatus
ⓘ Source: listings_history table (triggers on properties + properties_extension) + one-shot
backfill from property_details.listing_events for pre-trigger history.
Tax reassessment forecast MS · Resets to sale price
- Current annual tax
- $528 · $44/mo
- Projected year-2 tax
- $528 · $44/mo
- Expected delta
- $0/yr ($0/mo · 0.0%)
ⓘ Screening estimate from a state-policy table — verify with the county assessor before closing.
Climate risk First Street
- Flood 1/10 Low FEMA zone X (unshaded) · 0% chance over 30 yrs
- Wildfire 4/10 Moderate
- Heat 8/10 Severe 7 d/yr ≥109°F today · 21 d/yr by 30 yrs out
- Wind 8/10 Severe 99% chance of damaging wind over 30 yrs
- Air quality 1/10 Low 0 unhealthy d/yr today · 0 by 30 yrs out
Nearby sold comps map
Loading sold comps map…
Walkable amenities ~0.75 mi
Loading nearby amenities…
Taxation est. · year 1
- Rental income
- $17,371
- − Mortgage interest
- −$2,521
- − Property taxes
- −$528
- − Insurance
- −$225
- − Repairs & maintenance
- −$1,390
- − Management
- −$1,390
- − Depreciation
- −$1,309
- Taxable income
- $10,009
- Est. tax owed @ 24.0%
- −$2,402
- After-tax cash flow
- $7,736/yr
For passive investors: Depreciation is non-cash, so a rental often shows a tax loss while cash-flowing — sheltering income. Rental losses are passive: they offset passive income freely, and up to $25,000/yr can offset ordinary (W-2) income if you actively participate and your MAGI is under $100k (phasing out to $0 by $150k); unused losses carry forward. On sale, claimed depreciation is recaptured at up to 25%, and gains may owe capital-gains tax (a 1031 exchange can defer both). Figures are a year-1 estimate at your 24.0% rate — not tax advice; consult a CPA.
Schools (NCES district)
- District
- Mccomb School District
- NCES district ID
- 2802880
- Math proficiency
- 15% ▼ -20.00%
- Reading proficiency
- 16% ▼ -5.00%
- Median HH income
- $29,855
- Composite
- 12.26/100
- National rank
- #9645
- State rank
- #106 of 130 in MS
Livability — McComb
- Score
- 69/100
- State rank
- #50
- US rank
- #8347
Category grades
Schools grade is shown separately in the Schools card above.
Census & demographics
- Census place
- McComb, MS
- Population (ZIP)
- 19,767
Population outlook (Pike County) Hauer SSP2
- Today (2025)
- 38,766 people
- By 2030
- 37,874 · -2.3%
- By 2040
- 35,743 · -7.8%
- By 2050
- 33,276 · -14.2%
- By 2075
- 26,799 · -30.9%
- By 2100
- 18,562 · -52.1%
Race, ethnicity, and origin ACS 2023
- Neighborhood character
- Majority Black (64%)
- Race & ethnicity
- Black 64% White 32% Two or more races 2% Hispanic / Latino 2%
- Common ancestry
- Slovak 2% Lithuanian 1% Italian 1%
- Foreign-born
- 1%
- Languages at home
- 98% English-only · Spanish 1%
Political lean MEDSL · Pike
- 2024 margin
- Toss-up / Even · D 47.8% · R 51.3%
- 2008→2024 swing
- -7.0pp toward R · 2008: 3.5pp · 2024: -3.5pp
- All cycles
- 2024: R+3.5 2020: D+1.0 2016: R+0.7 2012: D+7.6 2008: D+3.5
Not yet ingested
- Civics
- —
Market trends
- HPI YoY
- ▼ -88.61%
- Current HPI
- 92.2495
- Rent YoY
- —
- Metro
- —
- State GDP YoY
- —
- F500 in state
- 0
Price history
+28.6% since first listed6 events — show timeline
- 2026-05-14 Listed $45,000 MLSU
- 2022-05-27 Sold (Public Records) — Public Records
- 2022-05-10 Listing Removed — MLSU
- 2022-01-28 Listed $35,000 MLSU
- 2005-04-14 Sold (Public Records) — Public Records
- 2004-09-09 Sold (Public Records) — Public Records
Property tax history
-8.4%/yrLatest (2025): $528 · -0.4% YoY. Source: county tax records.
Cash-flow waterfall
monthlySold comps — $/sqft
last 12 mo · ≤1 miLoading sold comps…