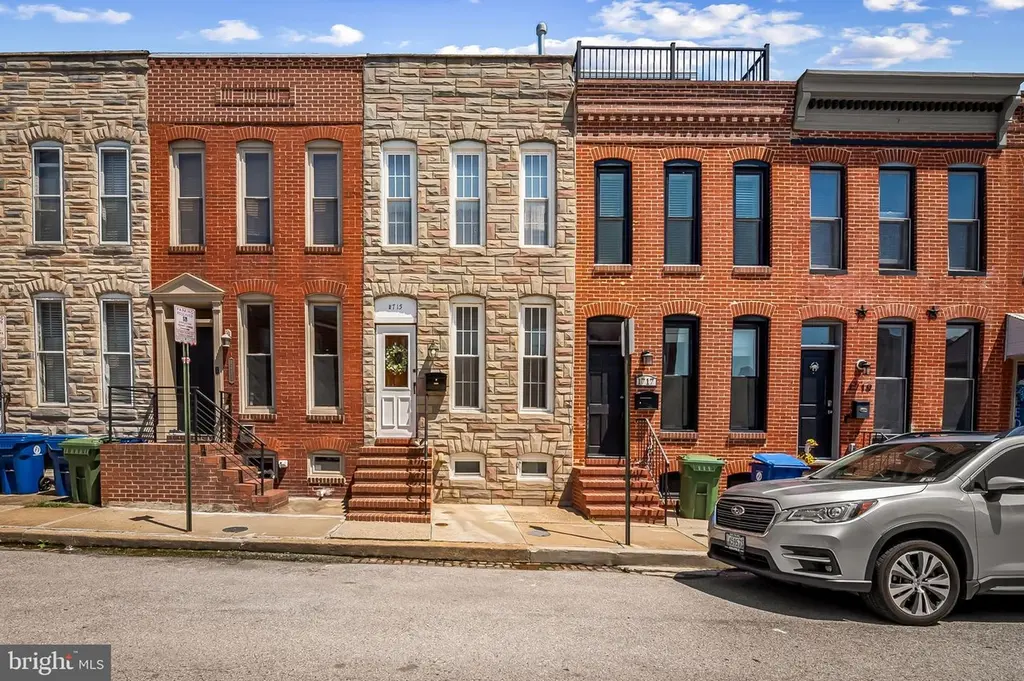
1715 Byrd St · Baltimore, MD
Flood risk 1/10 · Minimal
- FEMA flood zone
- X (unshaded)
- Chance of flooding over 30 yrs
- 0.0%
- Est. flood insurance / yr
- $473 – $860
Fire risk 1/10 · Minimal
- Est. fire insurance / yr
- $755 – $1,403
Heat risk 8/10 · Major
- Hot days now (above 102°F)
- 7 days/yr
- Hot days in 30 yrs
- 15 days/yr
Wind risk 6/10 · Moderate
- Chance of severe wind over 30 yrs
- 27.0%
Air-quality risk 4/10 · Minor
- Unhealthy air days now
- 6 days/yr
- Unhealthy air days in 30 yrs
- 7 days/yr
Risk factors via First Street. Map © Google.
Why this score? — see what drove the C grade
The composite is a weighted blend of 9 inputs, each scored 0–100. Each bar is that input's sub-score; the figure is the points it added to the 100-point composite (weight × sub-score).
- Cash flow +21.0/30.0
- ARV discount +15.0/15.0
- DSCR +6.7/10.0
- 1% rule +5.2/10.0
- Livability +3.8/5.0
- Condition / age +2.5/5.0
- Rent growth +2.2/5.0
- Schools +1.0/10.0
- Appreciation +0.0/10.0
$232,900
🖨 Deal sheet 📄 Offer letter ✓ Due diligence
Listing remarks
Welcome to 1715 Byrd St, this 2 bed 1 bath row home is located right down the street from Riverside Park, Thomas Johnson Elementary School, shops, restaurants and local bars. Walk in to this home and be greeted with an open floor plan that makes seamless living easy. This home has some amazing features which include a fenced in back yard patio with a shed, a spacious eat-in kitchen with a summer kitchen both with ample counter space. and 2 generously sized bedrooms with an abundance of closet space. This home is move in ready with great bones but if you want to do some small projects you can make it your own! Don't miss your opportunity to own this Gem of a home!
Key facts
- Built 1900
- Listed 37 days
Property features AI
Exterior
- Parking: On-street parking
- Utilities: Public water; Public sewer; Electric cooling; Natural gas heating and hot water
- Home design: Interior townhouse/rowhouse; Fee simple ownership
- Construction: Brick construction; Brick/mortar foundation; Above-grade and below-grade structures; Built year per assessor
- Exterior features: No tidal water
Interior
- Kitchen: Dishwasher; Microwave; Stove; Refrigerator; Exhaust fan
- Bedrooms: Two bedrooms on the first upper level
- Bathrooms: One full bathroom
- Heating & cooling: Central heating (natural gas); Central air conditioning (electric)
- Interior features: Unfinished basement; Assessor-provided living area
- Laundry & utility: Washer; Dryer; Natural gas hot water
Neighborhood map
What this means for you Summary
Snapshot
- This is a 2-bed/1.0-bath townhouse listed at $233k.
Deal economics
- At list price, monthly cash flow is $329 ($4k/yr) — positive.
- The deal already cash-flows at list — no discount required.
- Meets the 1% rule at list price ($2k rent vs $233k).
- Recommended offer: $226k (3.0% below list) — sets the bar for market timing.
- Cap rate 8.0% vs local median 6.0% in Baltimore — top-decile yield for the area; either an underpriced asset or a hidden risk that comps aren't pricing in. Stress-test before assuming the spread holds.
Location & tenants
- Location reads 76/100 on livability (#90 in MD, #3,396 nationally) — a middle-class / working-renter tenant base. Strengths: amenities A+, commute A+, housing A+; Watch: schools D, crime F.
- Baltimore City Public Schools (urban): math 7% / reading 16% proficiency, ranked #24 of 24 in MD (top 100%) — low school quality limits family demand, transient renter base, plan for 1-2y turnover; 79% free/reduced lunch — lower-income household profile, screen leases tightly.
- Market conditions: Rents soft (-1.0%/yr); 362 active listings in the ZIP; 40 comparable units currently listed for rent nearby; rentals at typical pace (median 18d on market — plan ~3-4 weeks tenant-placement turnaround); solid renter incomes; 1,273 units permitted in Baltimore city in 2024 (1,104 in 5+ unit buildings).
- This rent runs 31% of the median local income ($92k/yr) — at the standard rent-burdened threshold; future hikes will face affordability resistance.
Forward outlook
- Local home prices are declining (-3.0%/yr); year-one equity from $2k of loan paydown is wiped out by about $7k of value loss. Plan a longer hold.
- Baltimore County population projected to shrink 4% by 2050 — rents likely to lag national; underwrite the cash flow, not the appreciation.
Negotiation context
- It's been on market 37 days — a 3% lower offer ($226k) is reasonable based on typical stale-listing flexibility.
Risks & watch-outs
- Watch-outs: built in 1900 — expect roof / HVAC / electrical / plumbing capex.
- Climate carrying-cost: major wind risk, 27% chance of damaging wind over 30y; extreme-heat days projected 7→15/yr by 2055 (HVAC capex compounding) — expect insurance premiums to compound above CPI over the hold.
Questions for the listing agent
- It's been on market 37 days. Have you received any prior offers? Is the seller open to a 3% concession, seller financing, or rate buy-down credit?
- Built in 1900 — when were the roof, HVAC, electrical panel, plumbing, and water heater last replaced?
- Is there a deadline driving the sale (1031 exchange, divorce, estate, relocation)? That informs how much negotiation room exists.
- Schools are D-rated, which usually means shorter tenancies and higher turnover. Who's the typical renter profile here, and what's been the actual vacancy rate?
- Crime grade is F in this area — have there been break-ins, vandalism, or insurance claims at this property in the last 3 years? What carrier currently insures it and at what premium?
- What's the average days-on-market for RENTAL listings here right now (not sales)? A rising rental-DOM trend means longer vacancies and softer asking-rent achievability than the comps imply.
- What's the recent tenant-quality profile in this submarket — average credit score on applications, eviction rate, late-payment / NSF rate, and stable-employment percentage? A property-management company in the area should have these aggregated.
- How much new for-sale + rental construction is in the pipeline within 1–3 miles? Heavy new supply typically softens prices + rents 12–24 months out; constrained supply supports both.
Investment metrics
- 1% rule
- 1.02% ✓
- Cap rate
- 7.99%
- Cash-on-cash
- 6.06%
- DSCR
- 1.27
- GRM
- 8.2
CMA / ARV
- ARV (median comp)
- $283,800
- List price
- $232,900
- Delta
- -17.94%
- Verdict
- UNDERPRICED
- Comps
- 20 within 1.0 mi
Show comp detail 12 sales within ~0.75 mi
| Address | Dist | Beds/Ba | Sqft | Sold | Price | $/sf | Match |
|---|---|---|---|---|---|---|---|
| 1405 Covington St | 0.35mi | 2/1.0 | 1,124 (-1%) | 0mo | $315,000 | $280 | 81 |
| 3 East Ostend St | 0.36mi | 2/1.5 | 1,148 (+1%) | 2mo | $275,000 | $240 | 79 |
| 443 E Gittings St | 0.34mi | 2/1.0 | 1,100 (-4%) | 2mo | $245,000 | $223 | 77 |
| 139 E Randall St | 0.10mi | 2/1.0 | 1,005 (-12%) | 2mo | $265,000 | $264 | 74 |
| 1416 Jackson St | 0.36mi | 2/2.0 | 1,208 (+6%) | 1mo | $191,000 | $158 | 68 |
| 1513 Byrd St | 0.15mi | 3/2.5 (+1) | 1,022 (-10%) | 2mo | $330,000 | $323 | 64 |
| 29 E Henrietta St | 0.62mi | 2/1.0 | 1,067 (-6%) | 1mo | $250,000 | $234 | 60 |
| 30 E Wheeling St | 0.61mi | 2/2.5 | 1,104 (-3%) | 1mo | $200,000 | $181 | 59 |
| 1433 Patapsco St | 0.27mi | 2/2.0 | 1,305 (+14%) | 1mo | $285,000 | $218 | 58 |
| 213 Grindall St | 0.51mi | 3/2.0 (+1) | 1,043 (-8%) | 2mo | $270,000 | $259 | 51 |
| 122 Burnett St | 0.44mi | 2/2.5 | 984 (-14%) | 1mo | $310,000 | $315 | 50 |
| 109 W Montgomery St | 0.67mi | 2/2.5 | 1,300 (+14%) | 0mo | $390,000 | $300 | 39 |
Match score weights: distance 35% · size 25% · config 20% · recency 20%. Top-matched comps best support the ARV.
Projected returns pro-forma
-3.0% appreciation · 0.0% rent growth · sell at horizon
- IRR
- -10.3%
- Equity multiple
- 0.64×
- Total profit
- $-23,726
- Equity at exit
- $34,726
- IRR
- -5.6%
- Equity multiple
- 0.69×
- Total profit
- $-20,536
- Equity at exit
- $20,137
Cash invested: $65,212 (down + closing). Projections, not guarantees.
Landlord ↔ Tenant lean methodology
- Overall (CITY)
- 12 Strongly Tenant-Friendly
- State Maryland
- 27 Tenant-Leaning · D+14
- County
- — inherits STATE
- City Baltimore
- 12 Strongly Tenant-Friendly · D+58
ZIP-level market 21230
- Rents YoY
- -1.0%
- Active inventory
- 362
- Price-to-rent
- 8.2×
Monthly cashflow live
- Estimated rent
- $2,371 high interval (Pro) →
- Mortgage (P&I)
- −$1,221
- Tax from tax record
- −$226 /mo · $2,710/yr
- Insurance
- −$97
- HOA
- −$0
- Vacancy / Maint / Mgmt
- −$498
- Net cashflow
- $329
Break-even live
UW: 25.0% down · 7.5% · 30yr · 1.5% tax · 5.0% vac · 8.0% maint · 8.0% mgmt
Financing live
Cash to close
- Down payment
- $58,225
- Closing costs
- $6,987
- Reserves months
- —
- Total cash needed
- —
Loan-product check · same deal, 3 products live
Conventional
25% down · 7.5% · 30yr
- Down + closing
- —
- Monthly P&I
- —
- Monthly cashflow
- —
- DSCR
- —
- Eligible?
- —
Personal DTI + credit; lowest rate.
DSCR
20% down · 8.5% · 30yr
- Down + closing
- —
- Monthly P&I
- —
- Monthly cashflow
- —
- DSCR
- —
- Eligible?
- —
No personal income docs; deal must DSCR.
Hard money
10% down · 12.0% · 12mo
- Down + closing
- —
- Monthly P&I
- —
- Monthly cashflow
- —
- DSCR
- —
- Eligible?
- —
Short-term bridge; refi at stabilization.
Rent comps 40 comps
| Address | Beds | Baths | Sqft | Rent | $/sqft | DOM | Units | Dist |
|---|---|---|---|---|---|---|---|---|
| 1807 Westphal Pl Baltimore, MD | 2.0 | 2.5 | 1378 | $2,500 | $1.81 | 4d | 1 | 0.09mi |
| 1702 Light St Unit 302 Baltimore, MD | 2.0 | 2.0 | 735 | $2,300 | $3.13 | 17d | 1 | 0.10mi |
| 1710 Marshall St Baltimore, MD | 2.0 | 1.0 | 1110 | $2,500 | $2.25 | 43d | 1 | 0.12mi |
| 49 E Heath St Baltimore, MD | 2.0 | 1.5 | 858 | $1,800 | $2.10 | 11d | 1 | 0.13mi |
| 103 E Wells St Baltimore, MD | 1.0–2.0 | 1.0 | 1008 | $2,415 | $2.39 | 2d | 11 | 0.14mi |
| 1600 Light St Unit C Baltimore, MD | 3.0 | 2.0 | 1500 | $1,800 | $1.20 | 10d | 1 | 0.14mi |
| 1815 S Charles St Baltimore, MD | 2.0 | 2.0 | 1208 | $2,100 | $1.74 | 43d | 1 | 0.20mi |
| 1631 S Charles St Baltimore, MD | 2.0 | 3.0 | 1460 | $2,607 | $1.79 | 4d | 1 | 0.21mi |
| 1942 Light St Baltimore, MD | 2.0 | 2.5 | 1150 | $2,200 | $1.91 | 21d | 1 | 0.21mi |
| 1839 S Charles St Baltimore, MD | 3.0 | 2.5 | 1238 | $2,600 | $2.10 | 43d | 1 | 0.21mi |
| 8 E Randall St Baltimore, MD | 2.0 | 2.5 | 1148 | $2,600 | $2.26 | 4d | 1 | 0.23mi |
| 110 Birckhead St Baltimore, MD | 2.0 | 2.5 | 1220 | $2,750 | $2.25 | 43d | 1 | 0.24mi |
| 1444 Henry St Baltimore, MD | 2.0 | 2.5 | 1248 | $2,950 | $2.36 | 14d | 1 | 0.26mi |
| 1503 S Charles St Unit 2 Baltimore, MD | 2.0 | 2.0 | 1100 | $2,375 | $2.16 | 43d | 1 | 0.27mi |
| 1601 S Hanover St Apt 1R Baltimore, MD | 2.0 | 1.0 | 900 | $1,600 | $1.78 | 1d | 1 | 0.28mi |
| 1746 S Hanover St Baltimore, MD | 3.0 | 2.0 | 1490 | $2,700 | $1.81 | 10d | 1 | 0.28mi |
| 1718 S Hanover St Baltimore, MD | 2.0 | 2.5 | 1296 | $2,700 | $2.08 | 23d | 1 | 0.29mi |
| 1412 Light St Unit 2 Baltimore, MD | 1.0 | 1.0 | 800 | $1,700 | $2.12 | 2d | 1 | 0.29mi |
| 1608 S Hanover St Baltimore, MD | 3.0 | 3.5 | 1346 | $3,000 | $2.23 | 17d | 1 | 0.30mi |
| 1900 S Hanover St Baltimore, MD | 3.0 | 1.0–2.0 | 875 | $3,119 | $3.56 | 1d | 66 | 0.31mi |
| 1290 Battery Ave Baltimore, MD | 2.0 | 2.5 | 968 | $2,900 | $3.00 | 23d | 1 | 0.31mi |
| 118 E Gittings St Baltimore, MD | 3.0 | 2.5 | 1148 | $2,600 | $2.26 | 23d | 1 | 0.31mi |
| 1265 Riverside Ave Unit 1st Floor Baltimore, MD | 1.0 | 1.0 | 700 | $1,350 | $1.93 | 23d | 1 | 0.32mi |
| 1409 Covington St Baltimore, MD | 2.0 | 2.0 | 1458 | $2,300 | $1.58 | 3d | 1 | 0.34mi |
| 111 W Heath St Baltimore, MD | 2.0 | 1.0–2.5 | 1263 | $2,850 | $2.26 | 2d | 7 | 0.34mi |
| 1303 Patapsco St Baltimore, MD | 2.0 | 2.5 | 1200 | $3,000 | $2.50 | 2d | 1 | 0.35mi |
| 1516 Clarkson St Baltimore, MD | 2.0 | 1.5 | 1050 | $1,795 | $1.71 | 23d | 1 | 0.37mi |
| 250 Mission Blvd Baltimore, MD | 2.0 | 1.0–2.0 | 790 | $3,406 | $4.31 | 1d | 21 | 0.38mi |
| 639 Harvey St Unit 1 Baltimore, MD | 2.0 | 1.5 | 1188 | $3,000 | $2.53 | 43d | 1 | 0.39mi |
| 1211 Light St Baltimore, MD | 2.0 | 2.0 | 921 | $2,172 | $2.36 | 23d | 1 | 0.40mi |
| 651 E Clement St Baltimore, MD | 3.0 | 3.5 | 1292 | $2,800 | $2.17 | 43d | 1 | 0.41mi |
| 803 E Fort Ave Unit 1 Baltimore, MD | 2.0 | 1.0 | 1100 | $2,300 | $2.09 | 4d | 1 | 0.42mi |
| 1403 Race St Baltimore, MD | 3.0 | 3.0 | 1008 | $2,200 | $2.18 | 43d | 1 | 0.42mi |
| 1312 S Hanover St Apt 3 Baltimore, MD | 2.0 | 1.0 | 750 | $2,200 | $2.93 | 43d | 1 | 0.42mi |
| 2450 Rye St Baltimore, MD | 2.0 | 1.0–2.0 | 926 | $3,789 | $4.09 | 1d | 31 | 0.43mi |
| 1201 S Charles St Baltimore, MD | 2.0–3.0 | 2.0 | 1341 | $2,200 | $1.64 | 4d | 4 | 0.44mi |
| 1125 Light St Baltimore, MD | 1.0 | 1.0 | 800 | $1,300 | $1.62 | 23d | 1 | 0.45mi |
| 126 Burnett St Baltimore, MD | 2.0 | 2.5 | 984 | $2,200 | $2.24 | 23d | 1 | 0.47mi |
| 1110 Key Hwy Baltimore, MD | 1.0–2.0 | 1.0–2.5 | 1197 | $3,696 | $3.09 | 1d | 33 | 0.49mi |
| 1111 Light St Baltimore, MD | 2.0 | 1.0–2.0 | 982 | $2,449 | $2.49 | 4d | 13 | 0.49mi |
Listing history 15 events
-
2026-06-18days on market $232,900 Active 37 DOM
-
2026-06-17days on market $232,900 Active 36 DOM
-
2026-06-16days on market $232,900 Active 35 DOM
-
2026-06-15days on market $232,900 Active 34 DOM
-
2026-06-13days on market $232,900 Active 32 DOM
-
2026-06-09days on market $232,900 Active 28 DOM
-
2026-06-08days on market $232,900 Active 27 DOM
-
2026-06-07days on market $232,900 Active 26 DOM
-
2026-06-04pricedays on market $232,900 Active 23 DOM
-
2026-06-03days on market $239,900 Active 22 DOM
-
2026-06-02days on market $239,900 Active 21 DOM
-
2026-06-01days on market $239,900 Active 20 DOM
-
2026-05-31days on market $239,900 Active 19 DOM
-
2026-05-13$239,900 Active 676-char remark
-
2026-05-09historical $239,900 676-char remark
ⓘ Source: listings_history table (triggers on properties + properties_extension) + one-shot
backfill from property_details.listing_events for pre-trigger history.
Tax reassessment forecast MD · Partial reset (capped growth)
- Current annual tax
- $2,710 · $226/mo
- Projected year-2 tax
- $2,710 · $226/mo
- Expected delta
- $0/yr ($0/mo · 0.0%)
ⓘ Screening estimate from a state-policy table — verify with the county assessor before closing.
Climate risk First Street
- Flood 1/10 Low FEMA zone X (unshaded) · 0% chance over 30 yrs
- Wildfire 1/10 Low
- Heat 8/10 Severe 7 d/yr ≥102°F today · 15 d/yr by 30 yrs out
- Wind 6/10 Major 27% chance of damaging wind over 30 yrs
- Air quality 4/10 Moderate 6 unhealthy d/yr today · 7 by 30 yrs out
Nearby sold comps map
Loading sold comps map…
Walkable amenities ~0.75 mi
Loading nearby amenities…
Taxation est. · year 1
- Rental income
- $28,457
- − Mortgage interest
- −$13,046
- − Property taxes
- −$2,710
- − Insurance
- −$1,164
- − Repairs & maintenance
- −$2,277
- − Management
- −$2,277
- − Depreciation
- −$6,775
- Taxable income
- $208
- Est. tax owed @ 24.0%
- −$50
- After-tax cash flow
- $3,901/yr
For passive investors: Depreciation is non-cash, so a rental often shows a tax loss while cash-flowing — sheltering income. Rental losses are passive: they offset passive income freely, and up to $25,000/yr can offset ordinary (W-2) income if you actively participate and your MAGI is under $100k (phasing out to $0 by $150k); unused losses carry forward. On sale, claimed depreciation is recaptured at up to 25%, and gains may owe capital-gains tax (a 1031 exchange can defer both). Figures are a year-1 estimate at your 24.0% rate — not tax advice; consult a CPA.
Schools (NCES district)
- District
- Baltimore City Public Schools
- NCES district ID
- 2400090
- Math proficiency
- 7% ▼ -9.00%
- Reading proficiency
- 16% ▼ -5.00%
- Median HH income
- $42,108
- Composite
- 10.08/100
- National rank
- #9805
- State rank
- #24 of 24 in MD
Livability — Baltimore
- Score
- 76/100
- State rank
- #90
- US rank
- #3396
Category grades
Schools grade is shown separately in the Schools card above.
Census & demographics
- Census place
- Baltimore, MD
- County
- Baltimore City · 558,601 people
- City population
- 588,727
- Metro
- Baltimore-Columbia-Towson, MD
- Population (ZIP)
- 32,977
- Household income
- $91,842
- Rent vs Own
- Severe rent burden
- 1463.0
Population outlook (Baltimore County) Hauer SSP2
- Today (2025)
- 624,249 people
- By 2030
- 621,541 · -0.4%
- By 2040
- 609,756 · -2.3%
- By 2050
- 597,249 · -4.3%
- By 2075
- 552,236 · -11.5%
- By 2100
- 513,934 · -17.7%
Race, ethnicity, and origin ACS 2023
- Neighborhood character
- Diverse neighborhood (Simpson 0.63)
- Race & ethnicity
- White 55% Black 23% Hispanic / Latino 13% Two or more races 6% Asian 4%
- Hispanic origin (detail)
- Mexican 1% Puerto Rican 1%
- Common ancestry
- Romanian 5% Lithuanian 2% Italian 2%
- Foreign-born
- 10% · Canada, China
- Languages at home
- 85% English-only · Spanish 9% Other Indo-European 1% Other Asian/Pacific 1%
Political lean MEDSL · Baltimore
- 2024 margin
- Solid D (+73.0) · D 85.2% · R 12.2% · Other 2.6%
- 2008→2024 swing
- -2.5pp toward R · 2008: 75.5pp · 2024: 73.0pp
- All cycles
- 2024: D+73.0 2020: D+76.6 2016: D+74.6 2012: D+76.4 2008: D+75.5
Not yet ingested
- Civics
- —
Market trends
- HPI YoY
- ▼ -311.43%
- Current HPI
- 284.338
- Rent YoY
- ▼ -1.00%
- Metro
- Baltimore-Columbia-Towson, MD
- State GDP YoY
- ▲ 2.97%
- F500 in state
- 12
Industry mix (Fortune 500 HQ in MD)
| Industry | F500 HQs | Revenue |
|---|---|---|
| Aerospace / Defense | 1 | $71B |
|
||
| Utilities | 1 | $25B |
|
||
| Hotels | 1 | $24B |
|
||
| Consumer Goods | 1 | $7B |
|
||
| Real Estate | 1 | $6B |
|
||
| Chemicals | 1 | $2B |
|
||
Price history
-2.9% since first listed3 events — show timeline
- 2026-06-03 Price Changed $232,900 BRIGHT MLS
- 2026-05-13 Listed $239,900 BRIGHT MLS
- 2026-05-09 Coming Soon $239,900 BRIGHT MLS
Property tax history
-2.2%/yrLatest (2025): $2,710 · +4.6% YoY. Source: county tax records.
Cash-flow waterfall
monthlySold comps — $/sqft
last 12 mo · ≤1 miLoading sold comps…