1650 Gillette Dr · East Marion, NY
Flood risk No data
- FEMA flood zone
- —
- Chance of flooding over 30 yrs
- —
- Est. flood insurance / yr
- —
Fire risk No data
- Est. fire insurance / yr
- —
Heat risk No data
- Hot days now (above threshold)
- —
- Hot days in 30 yrs
- —
Wind risk No data
- Chance of severe wind over 30 yrs
- —
Air-quality risk No data
- Unhealthy air days now
- —
- Unhealthy air days in 30 yrs
- —
Risk factors via First Street. Map © Google.
Why this score? — see what drove the A- grade
The composite is a weighted blend of 9 inputs, each scored 0–100. Each bar is that input's sub-score; the figure is the points it added to the 100-point composite (weight × sub-score).
- Cash flow +30.0/30.0
- ARV discount +15.0/15.0
- DSCR +10.0/10.0
- 1% rule +8.3/10.0
- Appreciation +6.7/10.0
- Schools +4.3/10.0
- Livability +2.9/5.0
- Rent growth +2.5/5.0
- Condition / age +2.5/5.0
$875,000
🖨 Deal sheet 📄 Offer letter ✓ Due diligence
Listing remarks MLS
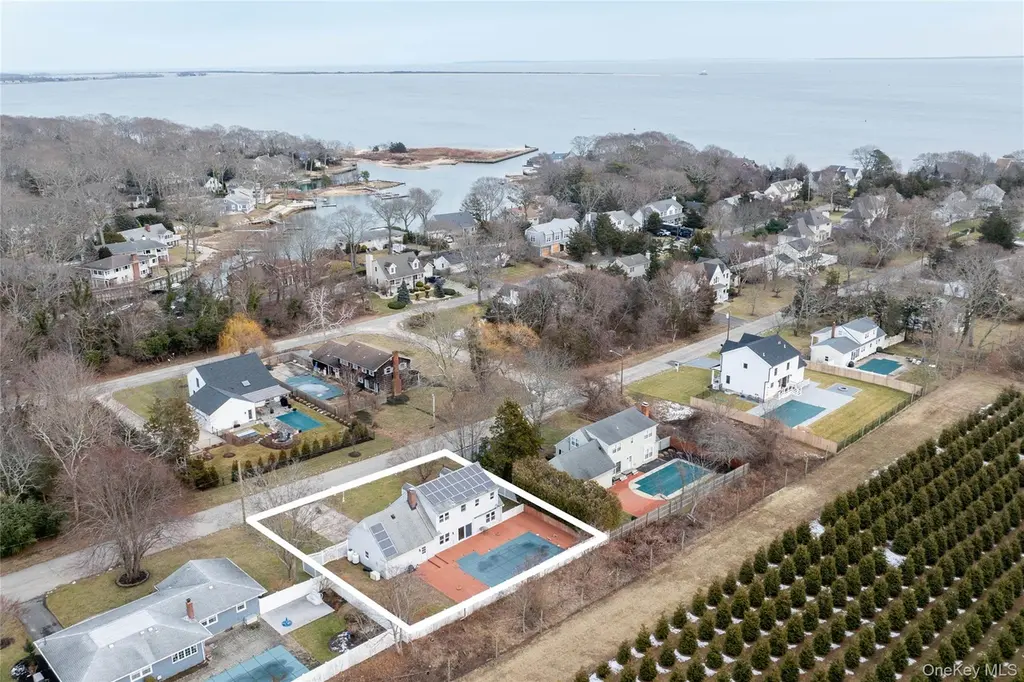
Charming Cape with a large pool, farm views, and a sandy bay beach at the end of the street. The light-filled first floor features a welcoming foyer, a spacious living room, dining room, and a generous eat-in kitchen that opens to a cozy den with a fireplace. Outdoors, the backyard is anchored by a beautiful swimming pool with southwest exposure and overlooks a picturesque farm and nursery, offering exceptional privacy and a serene North Fork setting. Three oversized bedrooms and two full baths provide ample space for hosting guests. Conveniently located just minutes from Greenport Village, Orient Village, and both the Cross Sound Ferry to Connecticut and the North Ferry to Shelter Island and Sag Harbor.
Key facts
- Cozy den
- Large pool
- Welcoming foyer
Tags
Neighborhood map
What this means for you Summary
Snapshot
- This is a 3-bed/2.0-bath single-family listed at $875k.
Deal economics
- At list price, monthly cash flow is $4k ($46k/yr) — positive.
- The deal already cash-flows at list — no discount required.
- Meets the 1% rule at list price ($12k rent vs $875k).
- Recommended offer: $770k (12.0% below list) — sets the bar for market timing.
Location & tenants
- Location reads 58/100 on livability (#1,051 in NY) — a working-class tenant base; expect higher turnover. Strengths: crime A+, employment A+, health & safety A; Watch: housing C-, schools D-, amenities F.
- Oysterponds Union Free School District (rural): math 30% / reading 60% proficiency, ranked #506 of 755 in NY (top 67%) — families likely to look elsewhere, expect single-tenant / working-renter base with shorter leases; only 4% free/reduced lunch — higher-income household profile.
- Market conditions: 19 active listings in the ZIP; 11 comparable units currently listed for rent nearby; rentals lingering (median 44d on market — plan ~5-8 weeks vacancy on turnover, expect pricing pressure); 73% of comp listings sitting > 30 days — soft ceiling on asking rent; 1,366 units permitted in Suffolk County in 2024 (216 in 5+ unit buildings).
Forward outlook
- In year one you build about $36k of equity ($6k loan paydown + $30k appreciation (3.5% local appreciation)).
- Suffolk County population projected to shrink 5% by 2050 — rents likely to lag national; underwrite the cash flow, not the appreciation.
- At projected returns (3.5% appreciation + 3.0% rent growth), your $245k cash investment doubles in ~3 years — after that, you're playing with house money.
- By year 2, paydown + projected appreciation supports a ~$59k cash-out refi (75% LTV) — recoverable capital for the next deal without selling this one.
Negotiation context
- It's been on market 140 days — a 12% lower offer ($770k) is reasonable based on typical stale-listing flexibility.
- Current owner paid $438k; list at $875k implies a 100% gain — meaningful room to come down on a strong offer.
Questions for the listing agent
- It's been on market 140 days. Have you received any prior offers? Is the seller open to a 12% concession, seller financing, or rate buy-down credit?
- Built in 1978 — when were the roof, HVAC, electrical panel, plumbing, and water heater last replaced?
- Why hasn't it sold? Are there any deal-killer items the seller is aware of (foundation, flood, title, zoning, code violations)?
- Is there a deadline driving the sale (1031 exchange, divorce, estate, relocation)? That informs how much negotiation room exists.
- Schools are D-rated, which usually means shorter tenancies and higher turnover. Who's the typical renter profile here, and what's been the actual vacancy rate?
- What's the average days-on-market for RENTAL listings here right now (not sales)? A rising rental-DOM trend means longer vacancies and softer asking-rent achievability than the comps imply.
- What's the recent tenant-quality profile in this submarket — average credit score on applications, eviction rate, late-payment / NSF rate, and stable-employment percentage? A property-management company in the area should have these aggregated.
- How much new for-sale + rental construction is in the pipeline within 1–3 miles? Heavy new supply typically softens prices + rents 12–24 months out; constrained supply supports both.
Investment metrics
- 1% rule
- 1.33% ✓
- Cap rate
- 11.59%
- Cash-on-cash
- 18.90%
- DSCR
- 1.84
- GRM
- 6.3
CMA / ARV
- ARV (median comp)
- $1,360,100
- List price
- $875,000
- Delta
- -35.67%
- Verdict
- UNDERPRICED
- Comps
- 17 within 1.0 mi
Show comp detail 5 sales within ~0.75 mi
| Address | Dist | Beds/Ba | Sqft | Sold | Price | $/sf | Match |
|---|---|---|---|---|---|---|---|
| 155 Manor Rd | 0.19mi | 4/2.5 (+1) | 2,140 (+6%) | 9mo | $1,490,000 | $696 | 67 |
| 1117 Cedar Ln | 0.20mi | 4/2.0 (+1) | 2,200 (+9%) | 9mo | $2,000,000 | $909 | 63 |
| 600 Shipyard Ln | 0.24mi | 3/2.5 | 1,800 (-11%) | 9mo | $1,100,000 | $611 | 61 |
| 2255 Old Orchard Rd | 0.31mi | 4/3.0 (+1) | 2,310 (+14%) | 12mo | $1,131,000 | $490 | 42 |
| 3900 Route 25 | 0.62mi | 3/2.5 | 2,162 (+7%) | 19mo | $1,090,000 | $504 | 41 |
Match score weights: distance 35% · size 25% · config 20% · recency 20%. Top-matched comps best support the ARV.
Projected returns pro-forma
3.47% appreciation · 3.0% rent growth · sell at horizon
- IRR
- 26.2%
- Equity multiple
- 2.52×
- Total profit
- $372,868
- Equity at exit
- $416,793
- IRR
- 26.5%
- Equity multiple
- 4.90×
- Total profit
- $956,034
- Equity at exit
- $661,109
Cash invested: $245,000 (down + closing). Projections, not guarantees.
Landlord ↔ Tenant lean methodology
- Overall (STATE)
- 15 Strongly Tenant-Friendly
- State New York
- 15 Strongly Tenant-Friendly · D+10
- County
- — inherits STATE
- City
- — inherits STATE
ZIP-level market 11939
- Home prices YoY
- 1.2%
- Active inventory
- 19
- Price-to-rent
- 6.3×
Monthly cashflow live
- Estimated rent
- $11,627 high interval (Pro) →
- Mortgage (P&I)
- −$4,589
- Tax from tax record
- −$374 /mo · $4,482/yr
- Insurance
- −$365
- HOA
- −$0
- Vacancy / Maint / Mgmt
- −$2,442
- Net cashflow
- $3,859
Break-even live
UW: 25.0% down · 7.5% · 30yr · 1.5% tax · 5.0% vac · 8.0% maint · 8.0% mgmt
Financing live
Cash to close
- Down payment
- $218,750
- Closing costs
- $26,250
- Reserves months
- —
- Total cash needed
- —
Loan-product check · same deal, 3 products live
Conventional
25% down · 7.5% · 30yr
- Down + closing
- —
- Monthly P&I
- —
- Monthly cashflow
- —
- DSCR
- —
- Eligible?
- —
Personal DTI + credit; lowest rate.
DSCR
20% down · 8.5% · 30yr
- Down + closing
- —
- Monthly P&I
- —
- Monthly cashflow
- —
- DSCR
- —
- Eligible?
- —
No personal income docs; deal must DSCR.
Hard money
10% down · 12.0% · 12mo
- Down + closing
- —
- Monthly P&I
- —
- Monthly cashflow
- —
- DSCR
- —
- Eligible?
- —
Short-term bridge; refi at stabilization.
Rent comps 11 comps
| Address | Beds | Baths | Sqft | Rent | $/sqft | DOM | Units | Dist |
|---|---|---|---|---|---|---|---|---|
| 1110 Gillette Dr East Marion, NY | 4.0 | 2.0 | 1500 | $7,000 | $4.67 | 18d | 1 | 0.10mi |
| 580 South Ln East Marion, NY | 3.0 | 2.5 | 2000 | $20,000 | $10.00 | 18d | 1 | 0.39mi |
| 300 Marion Pl East Marion, NY | 3.0 | 2.0 | 1750 | $19,000 | $10.86 | 24d | 1 | 0.46mi |
| 460 Bay Ave East Marion, NY | 3.0 | 1.5 | 1500 | $8,000 | $5.33 | 43d | 1 | 0.55mi |
| 580 Stars Rd East Marion, NY | 4.0 | 3.5 | 2700 | $35,000 | $12.96 | 43d | 1 | 0.78mi |
| 870 Stars Rd East Marion, NY | 3.0 | 3.0 | 1500 | $10,000 | $6.67 | 43d | 1 | 0.83mi |
| 11003 Main Rd East Marion, NY | 3.0 | 2.0 | 3000 | $15,000 | $5.00 | 43d | 1 | 0.90mi |
| 11930 Main Rd East Marion, NY | 4.0 | 2.0 | 2200 | $3,500 | $1.59 | 43d | 1 | 0.93mi |
| 3045 Rocky Point Rd East Marion, NY | 3.0 | 2.0 | 2025 | $12,000 | $5.93 | 43d | 1 | 0.97mi |
| 3600 Rocky Point Rd East Marion, NY | 3.0 | 2.5 | 3000 | $16,000 | $5.33 | 43d | 1 | 1.09mi |
| 123 Sterling Ave #2 Greenport, NY | 3.0 | 3.0 | 1528 | $45,000 | $29.45 | 43d | 1 | 1.20mi |
Listing history 17 events
-
2026-06-18days on market $875,000 Active 140 DOM
-
2026-06-17days on market $875,000 Active 139 DOM
-
2026-06-16days on market $875,000 Active 138 DOM
-
2026-06-15days on market $875,000 Active 137 DOM
-
2026-06-13days on market $875,000 Active 135 DOM
-
2026-06-12days on market $875,000 Active 134 DOM
-
2026-06-09days on market $875,000 Active 131 DOM
-
2026-06-08days on market $875,000 Active 130 DOM
-
2026-06-07days on market $875,000 Active 129 DOM
-
2026-06-07days on market $875,000 Active 128 DOM
-
2026-06-04days on market $875,000 Active 125 DOM
-
2026-06-02days on market $875,000 Active 124 DOM
-
2026-06-01days on market $875,000 Active 123 DOM
-
2026-05-31days on market $875,000 Active 122 DOM
-
2026-01-29$995,000 Active 713-char remark
Show marketing remark (713 chars)
Charming Cape with a large pool, farm views, and a sandy bay beach at the end of the street. The light-filled first floor features a welcoming foyer, a spacious living room, dining room, and a generous eat-in kitchen that opens to a cozy den with a fireplace. Outdoors, the backyard is anchored by a beautiful swimming pool with southwest exposure and overlooks a picturesque farm and nursery, offering exceptional privacy and a serene North Fork setting. Three oversized bedrooms and two full baths provide ample space for hosting guests. Conveniently located just minutes from Greenport Village, Orient Village, and both the Cross Sound Ferry to Connecticut and the North Ferry to Shelter Island and Sag Harbor.
-
2011-06-07soldstatus $437,500
-
1998-01-02soldstatus $160,000
ⓘ Source: listings_history table (triggers on properties + properties_extension) + one-shot
backfill from property_details.listing_events for pre-trigger history.
Tax reassessment forecast NY · Partial reset (capped growth)
- Current annual tax
- $4,482 · $374/mo
- Projected year-2 tax
- $9,635 · $803/mo
- Expected delta
- +$5,153/yr (+$429/mo · 115.0%)
ⓘ Screening estimate from a state-policy table — verify with the county assessor before closing.
Nearby sold comps map
Loading sold comps map…
Walkable amenities ~0.75 mi
Loading nearby amenities…
Taxation est. · year 1
- Rental income
- $139,528
- − Mortgage interest
- −$49,014
- − Property taxes
- −$4,482
- − Insurance
- −$4,375
- − Repairs & maintenance
- −$11,162
- − Management
- −$11,162
- − Depreciation
- −$25,455
- Taxable income
- $33,878
- Est. tax owed @ 24.0%
- −$8,131
- After-tax cash flow
- $38,176/yr
For passive investors: Depreciation is non-cash, so a rental often shows a tax loss while cash-flowing — sheltering income. Rental losses are passive: they offset passive income freely, and up to $25,000/yr can offset ordinary (W-2) income if you actively participate and your MAGI is under $100k (phasing out to $0 by $150k); unused losses carry forward. On sale, claimed depreciation is recaptured at up to 25%, and gains may owe capital-gains tax (a 1031 exchange can defer both). Figures are a year-1 estimate at your 24.0% rate — not tax advice; consult a CPA.
Schools (NCES district)
- District
- Oysterponds Union Free School District
- NCES district ID
- 3621930
- Math proficiency
- 30% ▼ -10.00%
- Reading proficiency
- 60% ▲ 20.00%
- Median HH income
- $71,948
- Composite
- 42.9/100
- National rank
- #6712
- State rank
- #506 of 755 in NY
Livability — East Marion
- Score
- 58/100
- State rank
- #1051
- US rank
- #20822
Category grades
Schools grade is shown separately in the Schools card above.
Census & demographics
- Census place
- East Marion, NY
- Population (ZIP)
- 1,741
Population outlook (Suffolk County) Hauer SSP2
- Today (2025)
- 1,505,262 people
- By 2030
- 1,498,318 · -0.5%
- By 2040
- 1,471,101 · -2.3%
- By 2050
- 1,424,848 · -5.3%
- By 2075
- 1,337,157 · -11.2%
- By 2100
- 1,217,720 · -19.1%
Race, ethnicity, and origin ACS 2023
- Neighborhood character
- Predominantly White (93%)
- Race & ethnicity
- White 93% Hispanic / Latino 4% Two or more races 2%
- Common ancestry
- Romanian 4% Scottish 1% Scotch-Irish 1%
- Foreign-born
- 9% · China
- Languages at home
- 89% English-only · Other Indo-European 7% Other Asian/Pacific 3% German/W. Germanic 1%
Political lean MEDSL · Suffolk
- 2024 margin
- Lean R (+10.0) · D 45.0% · R 55.0%
- 2008→2024 swing
- -16.0pp toward R · 2008: 6.0pp · 2024: -10.0pp
- All cycles
- 2024: R+10.0 2020: R+0.0 2016: R+8.2 2012: D+2.9 2008: D+6.0
Not yet ingested
- Civics
- —
Market trends
- HPI YoY
- ▲ 3.47%
- Current HPI
- 281.05
- Rent YoY
- —
- Metro
- —
- State GDP YoY
- ▲ 2.60%
- F500 in state
- 92
Industry mix (Fortune 500 HQ in NY)
| Industry | F500 HQs | Revenue |
|---|---|---|
| Financial Services | 10 | $950B |
|
||
| Consumer Goods | 9 | $162B |
|
||
| Insurance | 4 | $225B |
|
||
| Telecommunications | 2 | $144B |
|
||
| Pharmaceuticals | 2 | $112B |
|
||
| Media / Entertainment | 2 | $69B |
|
||
Price history
+521.9% since first listed3 events — show timeline
- 2026-01-29 Listed $995,000 OneKey® MLS as Distributed by MLS Grid
- 2011-06-07 Sold (Public Records) $437,500 Public Records
- 1998-01-02 Sold (Public Records) $160,000 Public Records
Property tax history
+0.9%/yrLatest (2025): $4,482 · +0.0% YoY. Source: county tax records.
Cash-flow waterfall
monthlySold comps — $/sqft
last 12 mo · ≤1 miLoading sold comps…