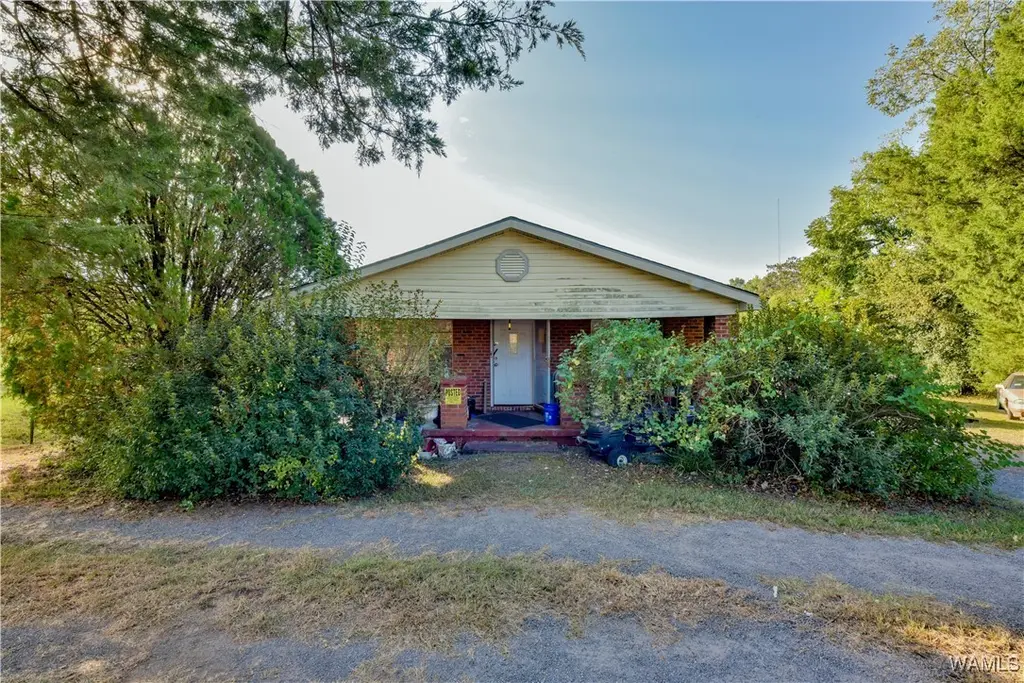
955 Rice Mine Rd · Northport, AL
Flood risk 4/10 · Minor
- FEMA flood zone
- X (shaded)
- Chance of flooding over 30 yrs
- 0.24%
- Est. flood insurance / yr
- $473 – $860
Fire risk 1/10 · Minimal
- Est. fire insurance / yr
- $916 – $1,700
Heat risk 7/10 · Major
- Hot days now (above 108°F)
- 7 days/yr
- Hot days in 30 yrs
- 20 days/yr
Wind risk 6/10 · Moderate
- Chance of severe wind over 30 yrs
- 59.0%
Air-quality risk 1/10 · Minimal
- Unhealthy air days now
- 0 days/yr
- Unhealthy air days in 30 yrs
- 0 days/yr
Risk factors via First Street. Map © Google.
Why this score? — see what drove the B+ grade
The composite is a weighted blend of 9 inputs, each scored 0–100. Each bar is that input's sub-score; the figure is the points it added to the 100-point composite (weight × sub-score).
- Cash flow +30.0/30.0
- ARV discount +15.0/15.0
- 1% rule +10.0/10.0
- DSCR +10.0/10.0
- Livability +3.9/5.0
- Schools +2.9/10.0
- Rent growth +2.5/5.0
- Condition / age +2.5/5.0
- Appreciation +0.0/10.0
$119,900
🖨 Deal sheet 📄 Offer letter ✓ Due diligence
Listing remarks MLS
Great investment opportunity in the heart of Northport! This 3 bedroom, 1 bath home offers tons of potential and sits in a convenient location close to everything. Perfect for a rental, flip, or portfolio addition. Schedule your appointment today!
Key facts
- 0.29 acre lot
- Built 1976
- Listed 143 days
Neighborhood map
What this means for you Summary
Snapshot
- This is a 3-bed/1.0-bath single-family listed at $120k.
Deal economics
- At list price, monthly cash flow is $832 ($10k/yr) — positive.
- The deal already cash-flows at list — no discount required.
- Meets the 1% rule at list price ($2k rent vs $120k).
- Recommended offer: $106k (12.0% below list) — sets the bar for market timing.
- Cap rate 14.6% vs local median 4.2% in Northport — top-decile yield for the area; either an underpriced asset or a hidden risk that comps aren't pricing in. Stress-test before assuming the spread holds.
Location & tenants
- Location reads 78/100 on livability (#8 in AL, #2,686 nationally) — a middle-class / working-renter tenant base. Strengths: cost of living A+, housing A+, health & safety A+; Watch: commute F.
- Tuscaloosa County (suburban): math 21% / reading 45% proficiency, ranked #47 of 129 in AL (top 36%) — families likely to look elsewhere, expect single-tenant / working-renter base with shorter leases.
- Market conditions: 44 active listings in the ZIP; 5 comparable units currently listed for rent nearby; rentals leasing fast (median 13d on market — plan ~1-2 weeks tenant-placement turnaround); 40% of comp listings sitting > 30 days — soft ceiling on asking rent; 622 units permitted in Tuscaloosa County in 2024 (69 in 5+ unit buildings).
- This rent runs 39% of the median local income ($61k/yr) — at the standard rent-burdened threshold; future hikes will face affordability resistance.
Forward outlook
- Local home prices are declining (-3.0%/yr); year-one equity from $829 of loan paydown is wiped out by about $4k of value loss. Plan a longer hold.
- Tuscaloosa County population projected at +26% by 2050 — long-run rental-demand tailwind backs the buy-and-hold thesis.
- At projected returns (-3.0% appreciation + 3.0% rent growth), your $34k cash investment doubles in ~5 years — after that, you're playing with house money.
Negotiation context
- It's been on market 143 days — a 12% lower offer ($106k) is reasonable based on typical stale-listing flexibility.
- 2 sale attempts; this cycle's ask has dropped $30k (20%) from the opening price — seller is motivated, your offer sets the floor, not the list.
- Current owner paid $90k; 33% above their basis — modest negotiation headroom, anchor on the comps not their cost.
Risks & watch-outs
- Climate carrying-cost: major wind risk, 59% chance of damaging wind over 30y; extreme-heat days projected 7→20/yr by 2055 (HVAC capex compounding) — expect insurance premiums to compound above CPI over the hold.
Questions for the listing agent
- It's been on market 143 days. Have you received any prior offers? Is the seller open to a 12% concession, seller financing, or rate buy-down credit?
- Built in 1976 — when were the roof, HVAC, electrical panel, plumbing, and water heater last replaced?
- Why hasn't it sold? Are there any deal-killer items the seller is aware of (foundation, flood, title, zoning, code violations)?
- Is there a deadline driving the sale (1031 exchange, divorce, estate, relocation)? That informs how much negotiation room exists.
- What's the average days-on-market for RENTAL listings here right now (not sales)? A rising rental-DOM trend means longer vacancies and softer asking-rent achievability than the comps imply.
- What's the recent tenant-quality profile in this submarket — average credit score on applications, eviction rate, late-payment / NSF rate, and stable-employment percentage? A property-management company in the area should have these aggregated.
- How much new for-sale + rental construction is in the pipeline within 1–3 miles? Heavy new supply typically softens prices + rents 12–24 months out; constrained supply supports both.
Investment metrics
- 1% rule
- 1.67% ✓
- Cap rate
- 14.62%
- Cash-on-cash
- 29.73%
- DSCR
- 2.32
- GRM
- 5.0
CMA / ARV
- ARV (median comp)
- $184,001
- List price
- $119,900
- Delta
- -34.84%
- Verdict
- UNDERPRICED
- Comps
- 20 within 1.0 mi
Show comp detail 12 sales within ~0.75 mi
| Address | Dist | Beds/Ba | Sqft | Sold | Price | $/sf | Match |
|---|---|---|---|---|---|---|---|
| 920 Rice Mine Rd | 0.01mi | 3/1.0 | 1,803 (0%) | 2mo | $60,000 | $33 | 98 |
| 2141 Fox Ridge Rd | 0.48mi | 3/2.0 | 1,793 (-1%) | 9mo | $305,000 | $170 | 65 |
| 1709 Hollow Ln | 0.59mi | 3/2.0 | 1,816 (+1%) | 6mo | $339,900 | $187 | 62 |
| 241 Placid Lane Ln | 0.55mi | 3/2.0 | 1,721 (-4%) | 3mo | $450,000 | $261 | 60 |
| 1818 Fox Ridge Rd | 0.49mi | 3/2.0 | 1,679 (-7%) | 4mo | $326,000 | $194 | 58 |
| 311 Reston Dr | 0.59mi | 3/2.5 | 1,820 (+1%) | 9mo | $325,000 | $179 | 58 |
| 1506 Shallow Creek Rd | 0.66mi | 3/2.0 | 1,678 (-7%) | 8mo | $314,900 | $188 | 47 |
| 509 Beacon Ridge Rd | 0.63mi | 3/2.0 | 1,655 (-8%) | 7mo | $409,000 | $247 | 47 |
| 2122 Bellwood Dr | 0.71mi | 3/2.0 | 1,970 (+9%) | 2mo | $270,000 | $137 | 46 |
| 1711 St. Andrews Dr | 0.55mi | 3/2.5 | 2,017 (+12%) | 6mo | $359,000 | $178 | 44 |
| 1738 Hollow Ln | 0.54mi | 2/2.0 (-1) | 1,569 (-13%) | 1mo | $304,900 | $194 | 43 |
| 508 Shallow Creek Rd | 0.65mi | 3/2.0 | 1,574 (-13%) | 4mo | $329,900 | $210 | 41 |
Match score weights: distance 35% · size 25% · config 20% · recency 20%. Top-matched comps best support the ARV.
Projected returns pro-forma
-3.0% appreciation · 3.0% rent growth · sell at horizon
- IRR
- 24.2%
- Equity multiple
- 2.00×
- Total profit
- $33,526
- Equity at exit
- $17,877
- IRR
- 32.1%
- Equity multiple
- 3.90×
- Total profit
- $97,328
- Equity at exit
- $10,367
Cash invested: $33,572 (down + closing). Projections, not guarantees.
Landlord ↔ Tenant lean methodology
- Overall (STATE)
- 90 Strongly Landlord-Friendly
- State Alabama
- 90 Strongly Landlord-Friendly · R+15
- County
- — inherits STATE
- City
- — inherits STATE
ZIP-level market 35476
- Home prices YoY
- -32.3%
- Active inventory
- 44
- Price-to-rent
- 5.0×
Monthly cashflow live
- Estimated rent
- $2,000 high interval (Pro) →
- Mortgage (P&I)
- −$629
- Tax from tax record
- −$69 /mo · $830/yr
- Insurance
- −$50
- HOA
- −$0
- Vacancy / Maint / Mgmt
- −$420
- Net cashflow
- $832
Break-even live
UW: 25.0% down · 7.5% · 30yr · 1.5% tax · 5.0% vac · 8.0% maint · 8.0% mgmt
Financing live
Cash to close
- Down payment
- $29,975
- Closing costs
- $3,597
- Reserves months
- —
- Total cash needed
- —
Loan-product check · same deal, 3 products live
Conventional
25% down · 7.5% · 30yr
- Down + closing
- —
- Monthly P&I
- —
- Monthly cashflow
- —
- DSCR
- —
- Eligible?
- —
Personal DTI + credit; lowest rate.
DSCR
20% down · 8.5% · 30yr
- Down + closing
- —
- Monthly P&I
- —
- Monthly cashflow
- —
- DSCR
- —
- Eligible?
- —
No personal income docs; deal must DSCR.
Hard money
10% down · 12.0% · 12mo
- Down + closing
- —
- Monthly P&I
- —
- Monthly cashflow
- —
- DSCR
- —
- Eligible?
- —
Short-term bridge; refi at stabilization.
Rent comps 5 comps
| Address | Beds | Baths | Sqft | Rent | $/sqft | DOM | Units | Dist |
|---|---|---|---|---|---|---|---|---|
| 201 Marina Dr Tuscaloosa, AL | 1.0–3.0 | 1.0–2.0 | 1099 | $1,595 | $1.45 | 13d | 1 | 0.43mi |
| 120 Main Ave Northport, AL | 4.0 | 4.5 | 2000 | $4,000 | $2.00 | 13d | 1 | 0.70mi |
| 303 Reed St Tuscaloosa, AL | 1.0–2.0 | 1.0 | 1150 | $1,400 | $1.22 | 43d | 2 | 0.96mi |
| 2209 9th St #401 Tuscaloosa, AL | 2.0 | 2.0 | 1304 | $1,650 | $1.27 | 43d | 1 | 1.11mi |
| 800 Energy Center Blvd Northport, AL | 3.0 | 1.0–2.5 | 950 | $1,784 | $1.88 | 13d | 1 | 1.47mi |
Listing history 21 events
-
2026-06-18days on market $119,900 Active 143 DOM
-
2026-06-17days on market $119,900 Active 142 DOM
-
2026-06-16days on market $119,900 Active 141 DOM
-
2026-06-15days on market $119,900 Active 140 DOM
-
2026-06-14days on market $119,900 Active 138 DOM
-
2026-06-13days on market $119,900 Active 137 DOM
-
2026-06-10days on market $119,900 Active 135 DOM
-
2026-06-09days on market $119,900 Active 134 DOM
-
2026-06-08days on market $119,900 Active 133 DOM
-
2026-06-07days on market $119,900 Active 132 DOM
-
2026-06-05days on market $119,900 Active 129 DOM
-
2026-06-03days on market $119,900 Active 128 DOM
-
2026-06-02days on market $119,900 Active 127 DOM
-
2026-06-01days on market $119,900 Active 126 DOM
-
2026-05-31days on market $119,900 Active 125 DOM
-
2026-05-30days on market $119,900 Active 124 DOM
-
2026-04-14price $119,900 247-char remark
Show marketing remark (247 chars)
Great investment opportunity in the heart of Northport! This 3 bedroom, 1 bath home offers tons of potential and sits in a convenient location close to everything. Perfect for a rental, flip, or portfolio addition. Schedule your appointment today!
-
2026-04-09soldstatus $90,000
-
2026-02-11status Active 247-char remark
Show marketing remark (247 chars)
Great investment opportunity in the heart of Northport! This 3 bedroom, 1 bath home offers tons of potential and sits in a convenient location close to everything. Perfect for a rental, flip, or portfolio addition. Schedule your appointment today!
-
2025-12-18status Pending 247-char remark
Show marketing remark (247 chars)
Great investment opportunity in the heart of Northport! This 3 bedroom, 1 bath home offers tons of potential and sits in a convenient location close to everything. Perfect for a rental, flip, or portfolio addition. Schedule your appointment today!
-
2025-12-02$149,900 Active 247-char remark
Show marketing remark (247 chars)
Great investment opportunity in the heart of Northport! This 3 bedroom, 1 bath home offers tons of potential and sits in a convenient location close to everything. Perfect for a rental, flip, or portfolio addition. Schedule your appointment today!
ⓘ Source: listings_history table (triggers on properties + properties_extension) + one-shot
backfill from property_details.listing_events for pre-trigger history.
Tax reassessment forecast AL · Resets to sale price
- Current annual tax
- $830 · $69/mo
- Projected year-2 tax
- $830 · $69/mo
- Expected delta
- $0/yr ($0/mo · 0.0%)
ⓘ Screening estimate from a state-policy table — verify with the county assessor before closing.
Climate risk First Street
- Flood 4/10 Moderate FEMA zone X (shaded) · 24% chance over 30 yrs
- Wildfire 1/10 Low
- Heat 7/10 Severe 7 d/yr ≥108°F today · 20 d/yr by 30 yrs out
- Wind 6/10 Major 59% chance of damaging wind over 30 yrs
- Air quality 1/10 Low 0 unhealthy d/yr today · 0 by 30 yrs out
Nearby sold comps map
Loading sold comps map…
Walkable amenities ~0.75 mi
Loading nearby amenities…
Taxation est. · year 1
- Rental income
- $23,995
- − Mortgage interest
- −$6,716
- − Property taxes
- −$830
- − Insurance
- −$600
- − Repairs & maintenance
- −$1,920
- − Management
- −$1,920
- − Depreciation
- −$3,488
- Taxable income
- $8,522
- Est. tax owed @ 24.0%
- −$2,045
- After-tax cash flow
- $7,936/yr
For passive investors: Depreciation is non-cash, so a rental often shows a tax loss while cash-flowing — sheltering income. Rental losses are passive: they offset passive income freely, and up to $25,000/yr can offset ordinary (W-2) income if you actively participate and your MAGI is under $100k (phasing out to $0 by $150k); unused losses carry forward. On sale, claimed depreciation is recaptured at up to 25%, and gains may owe capital-gains tax (a 1031 exchange can defer both). Figures are a year-1 estimate at your 24.0% rate — not tax advice; consult a CPA.
Schools (NCES district)
- District
- Tuscaloosa County
- NCES district ID
- 0103390
- Math proficiency
- 21% ▼ -24.00%
- Reading proficiency
- 45% ▲ 2.00%
- Median HH income
- $53,000
- Composite
- 28.88/100
- National rank
- #6641
- State rank
- #47 of 129 in AL
Livability — Northport
- Score
- 78/100
- State rank
- #8
- US rank
- #2686
Category grades
Schools grade is shown separately in the Schools card above.
Census & demographics
- Census place
- Northport, AL
- County
- Tuscaloosa County · 206,491 people
- City population
- 47,464
- Metro
- Tuscaloosa, AL
- Population (ZIP)
- 8,521
- Household income
- $61,154
- Rent vs Own
- Severe rent burden
- 281.0
Population outlook (Tuscaloosa County) Hauer SSP2
- Today (2025)
- 228,293 people
- By 2030
- 240,551 · +5.4%
- By 2040
- 263,856 · +15.6%
- By 2050
- 286,491 · +25.5%
- By 2075
- 335,783 · +47.1%
- By 2100
- 370,520 · +62.3%
Race, ethnicity, and origin ACS 2023
- Neighborhood character
- Diverse neighborhood (Simpson 0.58)
- Race & ethnicity
- Black 50% White 40% Hispanic / Latino 8% Two or more races 5%
- Hispanic origin (detail)
- Mexican 2% Cuban 2%
- Common ancestry
- Lithuanian 2% Slovak 1% Italian 1%
- Foreign-born
- 5% · Canada
- Languages at home
- 93% English-only · Spanish 7%
Political lean MEDSL · Tuscaloosa
- 2024 margin
- Strong R (+20.4) · D 39.4% · R 59.8%
- 2008→2024 swing
- -4.4pp toward R · 2008: -16.0pp · 2024: -20.4pp
- All cycles
- 2024: R+20.4 2020: R+14.8 2016: R+19.5 2012: R+17.4 2008: R+16.0
Not yet ingested
- Civics
- —
Market trends
- HPI YoY
- ▼ -104.98%
- Current HPI
- 219.7539
- Rent YoY
- —
- Metro
- Tuscaloosa, AL
- State GDP YoY
- ▲ 2.94%
- F500 in state
- 4
Industry mix (Fortune 500 HQ in AL)
| Industry | F500 HQs | Revenue |
|---|---|---|
| Financial Services | 1 | $8B |
|
||
| Healthcare | 1 | $5B |
|
||
Price history
-20.0% since first listed5 events — show timeline
- 2026-04-14 Price Changed $119,900 WAMLS
- 2026-04-09 Sold (Public Records) $90,000 Public Records
- 2026-02-11 Relisted — WAMLS
- 2025-12-18 Pending — WAMLS
- 2025-12-02 Listed $149,900 WAMLS
Property tax history
+2.5%/yrLatest (2025): $830 · +6.9% YoY. Source: county tax records.
Cash-flow waterfall
monthlySold comps — $/sqft
last 12 mo · ≤1 miLoading sold comps…