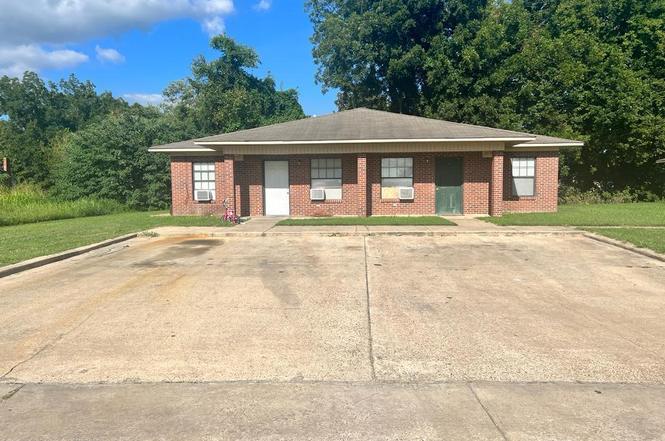
 14-Plex
412 E Hays St · Hollandale, MS
Flood risk 1/10 · Minimal
- FEMA flood zone
- X
- Chance of flooding over 30 yrs
- 0.0%
- Est. flood insurance / yr
- $507 – $1,088
Fire risk 1/10 · Minimal
- Est. fire insurance / yr
- $1,241 – $2,305
Heat risk 7/10 · Major
- Hot days now (above 112°F)
- 7 days/yr
- Hot days in 30 yrs
- 20 days/yr
Wind risk 6/10 · Moderate
- Chance of severe wind over 30 yrs
- 53.0%
Air-quality risk 1/10 · Minimal
- Unhealthy air days now
- 0 days/yr
- Unhealthy air days in 30 yrs
- 0 days/yr
Risk factors via First Street. Map © Google.
Why this score? — see what drove the B grade
The composite is a weighted blend of 9 inputs, each scored 0–100. Each bar is that input's sub-score; the figure is the points it added to the 100-point composite (weight × sub-score).
- Cash flow +30.0/30.0
- 1% rule +10.0/10.0
- DSCR +10.0/10.0
- ARV discount +7.5/15.0
- Appreciation +5.3/10.0
- Livability +3.1/5.0
- Rent growth +2.5/5.0
- Condition / age +2.5/5.0
- Schools +0.8/10.0
$660,000
🖨 Deal sheet 📄 Offer letter ✓ Due diligence
Multi-family units
County records classify this as Multi-Family (2-4 Unit). Listing-text estimate: 14 units. estimate disagrees with records
Listing remarks
Investment opportunity with excellent income potential. These 7 duplexes totaling 14 units consist of 3 bedrooms and 2 bathrooms in each unit. Open concept den and kitchen. There is potential 100% occupancy with one unit at this time vacant. Each unit is equipped with an oven and refrigerator. There is also a laundry room for your washer an dryer. This property is 4.30 acres to add additional units to for further income potential. Section 8 is available. Rent rolls are available upon request.
Key facts
- Income potential
- Laundry room
- 4.30 acres
Tags
Neighborhood map
What this means for you Summary
Snapshot
- This is a 14 × 3-bed/2.0-bath units multifamily listed at $660k.
Deal economics
- At list price, monthly cash flow is $5k ($59k/yr) — positive. Per door: $354/mo.
- The deal already cash-flows at list — no discount required.
- Meets the 1% rule at list price ($12k rent vs $660k).
- Recommended offer: $601k (9.0% below list) — sets the bar for market timing.
Location & tenants
- Location reads 61/100 on livability (#202 in MS) — a middle-class / working-renter tenant base. Strengths: crime A+, cost of living A+, housing A+; Watch: schools F, amenities F, commute F.
- Hollandale School District (town): math 5% / reading 16% proficiency, ranked #116 of 130 in MS (top 89%) — low school quality limits family demand, transient renter base, plan for 1-2y turnover; 96% free/reduced lunch — lower-income household profile, screen leases tightly.
- Market conditions: 12 active listings in the ZIP; 10 units permitted in Washington County in 2024 (0 in 5+ unit buildings).
Forward outlook
- In year one you build about $8k of equity ($5k loan paydown + $4k appreciation (0.6% local appreciation)).
- Washington County population projected at -36% by 2050 — secular population decline; favor cash flow + early exit over multi-decade hold.
- At projected returns (0.6% appreciation + 3.0% rent growth), your $185k cash investment doubles in ~3 years — after that, you're playing with house money.
- By year 5, paydown + projected appreciation supports a ~$42k cash-out refi (75% LTV) — recoverable capital for the next deal without selling this one.
Negotiation context
- It's been on market 107 days — a 9% lower offer ($601k) is reasonable based on typical stale-listing flexibility.
- 2 sale attempts with the ask held roughly flat each time — persistent listings suggest the price (not the market) is what's stuck; bring a comps-based counter.
Risks & watch-outs
- Climate carrying-cost: major wind risk, 53% chance of damaging wind over 30y; extreme-heat days projected 7→20/yr by 2055 (HVAC capex compounding) — expect insurance premiums to compound above CPI over the hold.
Questions for the listing agent
- It's been on market 107 days. Have you received any prior offers? Is the seller open to a 9% concession, seller financing, or rate buy-down credit?
- Can we see the unit-by-unit rent roll, current vacancy, and any below-market leases? What's the average tenancy length?
- What capital expenditures (roof, boiler, parking lot, exteriors) have been made in the last 5 years, and what's planned in the next 2?
- Why hasn't it sold? Are there any deal-killer items the seller is aware of (foundation, flood, title, zoning, code violations)?
- Is there a deadline driving the sale (1031 exchange, divorce, estate, relocation)? That informs how much negotiation room exists.
- Schools are F-rated, which usually means shorter tenancies and higher turnover. Who's the typical renter profile here, and what's been the actual vacancy rate?
- What's the average days-on-market for RENTAL listings here right now (not sales)? A rising rental-DOM trend means longer vacancies and softer asking-rent achievability than the comps imply.
- What's the recent tenant-quality profile in this submarket — average credit score on applications, eviction rate, late-payment / NSF rate, and stable-employment percentage? A property-management company in the area should have these aggregated.
- How much new apartment / multifamily construction is in the pipeline within 1–3 miles? Heavy new supply (>2% of stock underway) typically softens rents 12–24 months out; light construction supports rent growth.
Investment metrics
- 1% rule
- 1.83% ✓
- Cap rate
- 15.31%
- Cash-on-cash
- 32.19%
- DSCR
- 2.43
- GRM
- 4.6
CMA / ARV
No comps found within radius.
Projected returns pro-forma
0.59% appreciation · 3.0% rent growth · sell at horizon
- IRR
- 33.9%
- Equity multiple
- 2.71×
- Total profit
- $315,260
- Equity at exit
- $211,466
- IRR
- 36.6%
- Equity multiple
- 5.28×
- Total profit
- $790,029
- Equity at exit
- $270,606
Cash invested: $184,800 (down + closing). Projections, not guarantees.
Landlord ↔ Tenant lean methodology
- Overall (STATE)
- 90 Strongly Landlord-Friendly
- State Mississippi
- 90 Strongly Landlord-Friendly · R+11
- County
- — inherits STATE
- City
- — inherits STATE
ZIP-level market 38748
- Home prices YoY
- 1.1%
- Active inventory
- 12
- Price-to-rent
- 63.9×
Monthly cashflow live
- Estimated rent
- $12,049 medium interval (Pro) →
- Mortgage (P&I)
- −$3,461
- Tax est. 1.5%
- −$825 /mo · $9,900/yr
- Insurance
- −$275
- HOA
- −$0
- Vacancy / Maint / Mgmt
- −$2,530
- Net cashflow
- $4,958
Break-even live
14-unit breakdown (identical units grouped — click to expand)
| Units | Beds | Baths | Est. rent |
|---|---|---|---|
| 14× units | 3 | 2 | $12,054 |
| #1 | 3 | 2 | $861 |
| #2 | 3 | 2 | $861 |
| #3 | 3 | 2 | $861 |
| #4 | 3 | 2 | $861 |
| #5 | 3 | 2 | $861 |
| #6 | 3 | 2 | $861 |
| #7 | 3 | 2 | $861 |
| #8 | 3 | 2 | $861 |
| #9 | 3 | 2 | $861 |
| #10 | 3 | 2 | $861 |
| #11 | 3 | 2 | $861 |
| #12 | 3 | 2 | $861 |
| #13 | 3 | 2 | $861 |
| #14 | 3 | 2 | $861 |
| Total (14 units) | $12,049 | ||
UW: 25.0% down · 7.5% · 30yr · 1.5% tax · 5.0% vac · 8.0% maint · 8.0% mgmt
Financing live
Cash to close
- Down payment
- $165,000
- Closing costs
- $19,800
- Reserves months
- —
- Total cash needed
- —
Loan-product check · same deal, 3 products live
Conventional
25% down · 7.5% · 30yr
- Down + closing
- —
- Monthly P&I
- —
- Monthly cashflow
- —
- DSCR
- —
- Eligible?
- —
Personal DTI + credit; lowest rate.
DSCR
20% down · 8.5% · 30yr
- Down + closing
- —
- Monthly P&I
- —
- Monthly cashflow
- —
- DSCR
- —
- Eligible?
- —
No personal income docs; deal must DSCR.
Hard money
10% down · 12.0% · 12mo
- Down + closing
- —
- Monthly P&I
- —
- Monthly cashflow
- —
- DSCR
- —
- Eligible?
- —
Short-term bridge; refi at stabilization.
Listing history 10 events
-
2026-06-18days on market $660,000 Active 107 DOM
-
2026-06-17days on market $660,000 Active 106 DOM
-
2026-06-16days on market $660,000 Active 105 DOM
-
2026-06-15days on market $660,000 Active 104 DOM
-
2026-06-13statusdays on market $660,000 Active 102 DOM
-
2026-02-18status Pending
-
2026-01-18status Active
-
2025-08-08status Pending
-
2025-07-09price $660,000
-
2025-05-26$675,000 Active
ⓘ Source: listings_history table (triggers on properties + properties_extension) + one-shot
backfill from property_details.listing_events for pre-trigger history.
Climate risk First Street
- Flood 1/10 Low FEMA zone X · 0% chance over 30 yrs
- Wildfire 1/10 Low
- Heat 7/10 Severe 7 d/yr ≥112°F today · 20 d/yr by 30 yrs out
- Wind 6/10 Major 53% chance of damaging wind over 30 yrs
- Air quality 1/10 Low 0 unhealthy d/yr today · 0 by 30 yrs out
Nearby sold comps map
Loading sold comps map…
Walkable amenities ~0.75 mi
Loading nearby amenities…
Taxation est. · year 1
- Rental income
- $144,588
- − Mortgage interest
- −$36,970
- − Property taxes
- −$9,900
- − Insurance
- −$3,300
- − Repairs & maintenance
- −$11,567
- − Management
- −$11,567
- − Depreciation
- −$19,200
- Taxable income
- $52,084
- Est. tax owed @ 24.0%
- −$12,500
- After-tax cash flow
- $46,991/yr
For passive investors: Depreciation is non-cash, so a rental often shows a tax loss while cash-flowing — sheltering income. Rental losses are passive: they offset passive income freely, and up to $25,000/yr can offset ordinary (W-2) income if you actively participate and your MAGI is under $100k (phasing out to $0 by $150k); unused losses carry forward. On sale, claimed depreciation is recaptured at up to 25%, and gains may owe capital-gains tax (a 1031 exchange can defer both). Figures are a year-1 estimate at your 24.0% rate — not tax advice; consult a CPA.
Schools (NCES district)
- District
- Hollandale School District
- NCES district ID
- 2801890
- Math proficiency
- 5% ▼ -20.00%
- Reading proficiency
- 16% ▼ -4.00%
- Median HH income
- $26,801
- Composite
- 7.78/100
- National rank
- #9935
- State rank
- #116 of 130 in MS
Livability — Hollandale
- Score
- 61/100
- State rank
- #202
- US rank
- #18250
Category grades
Schools grade is shown separately in the Schools card above.
Census & demographics
- Census place
- Hollandale, MS
- Population (ZIP)
- 3,047
Population outlook (Washington County) Hauer SSP2
- Today (2025)
- 41,424 people
- By 2030
- 38,061 · -8.1%
- By 2040
- 31,752 · -23.3%
- By 2050
- 26,394 · -36.3%
- By 2075
- 17,180 · -58.5%
- By 2100
- 12,936 · -68.8%
Race, ethnicity, and origin ACS 2023
- Neighborhood character
- Predominantly Black (75%)
- Race & ethnicity
- Black 75% White 24%
- Common ancestry
- Italian 1%
- Foreign-born
- 1%
Political lean MEDSL · Washington
- 2024 margin
- Solid D (+35.0) · D 67.0% · R 32.0% · Other 1.1%
- 2008→2024 swing
- +0.2pp no change · 2008: 34.7pp · 2024: 35.0pp
- All cycles
- 2024: D+35.0 2020: D+40.0 2016: D+36.4 2012: D+42.7 2008: D+34.7
Not yet ingested
- Civics
- —
Market trends
- HPI YoY
- ▲ 0.59%
- Current HPI
- 56.0958
- Rent YoY
- —
- Metro
- —
- State GDP YoY
- —
- F500 in state
- 0
Price history
-2.2% since first listed5 events — show timeline
- 2026-02-18 Pending — MLSU
- 2026-01-18 Relisted — MLSU
- 2025-08-08 Pending — MLSU
- 2025-07-09 Price Changed $660,000 MLSU
- 2025-05-26 Listed $675,000 MLSU
Property tax history
-31.6%/yrLatest (2025): $158 · -1.1% YoY. Source: county tax records.
Cash-flow waterfall
monthlySold comps — $/sqft
last 12 mo · ≤1 miLoading sold comps…