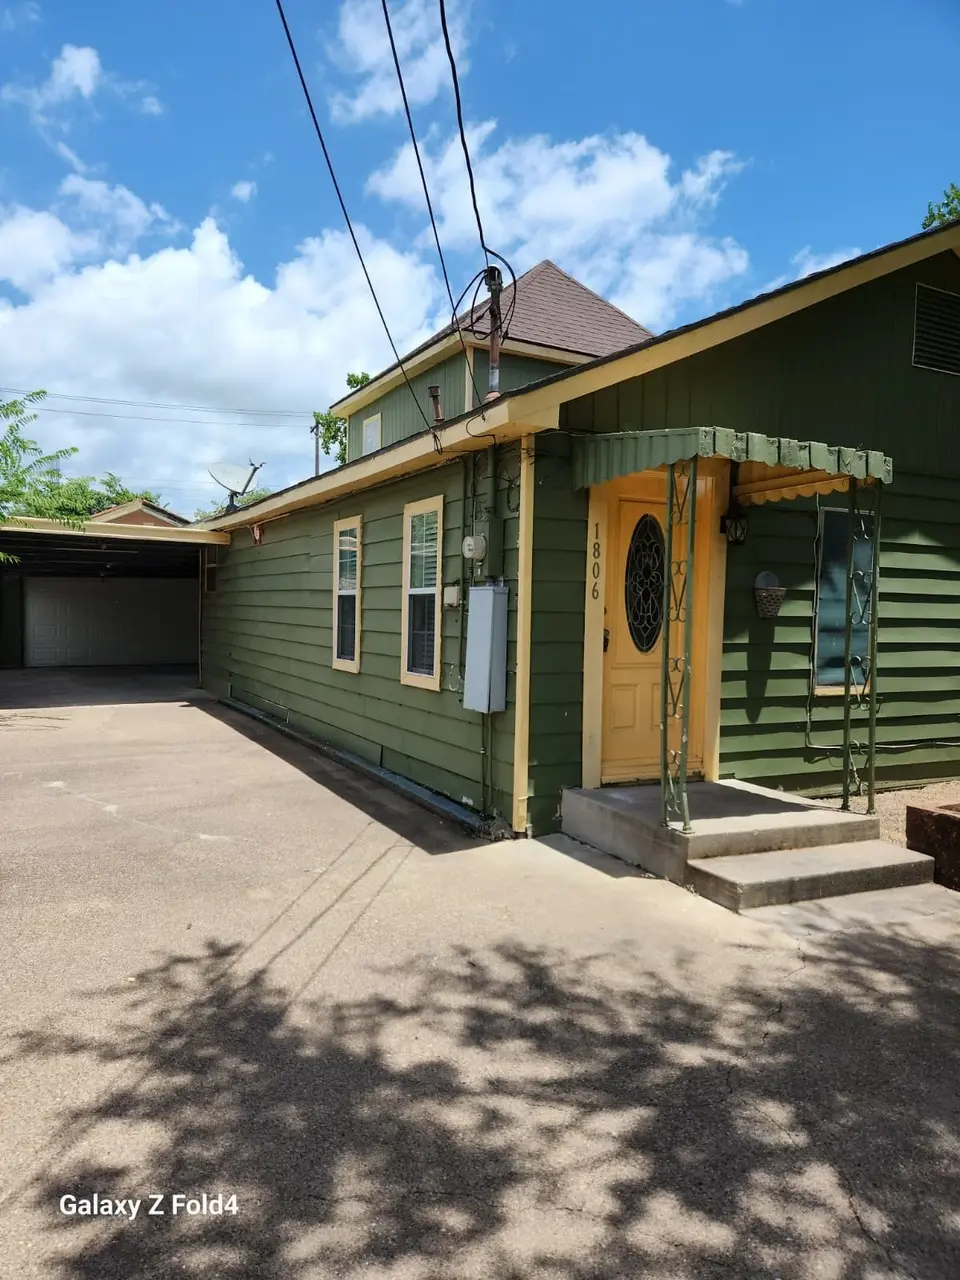
1806 N Avenue S · Freeport, TX
Flood risk 8/10 · Major
- FEMA flood zone
- X (unshaded)
- Chance of flooding over 30 yrs
- 0.6%
- Est. flood insurance / yr
- $507 – $1,088
Fire risk 3/10 · Minor
- Est. fire insurance / yr
- $1,222 – $2,270
Heat risk 10/10 · Severe
- Hot days now (above 114°F)
- 7 days/yr
- Hot days in 30 yrs
- 26 days/yr
Wind risk 9/10 · Severe
- Chance of severe wind over 30 yrs
- 99.0%
Air-quality risk 2/10 · Minimal
- Unhealthy air days now
- 1 days/yr
- Unhealthy air days in 30 yrs
- 1 days/yr
Risk factors via First Street. Map © Google.
Why this score? — see what drove the C- grade
The composite is a weighted blend of 9 inputs, each scored 0–100. Each bar is that input's sub-score; the figure is the points it added to the 100-point composite (weight × sub-score).
- Cash flow +17.2/30.0
- ARV discount +15.0/15.0
- DSCR +5.4/10.0
- 1% rule +5.2/10.0
- Schools +3.7/10.0
- Livability +2.9/5.0
- Rent growth +2.5/5.0
- Condition / age +2.5/5.0
- Appreciation +0.0/10.0
$139,900
🖨 Deal sheet (PDF) 📄 Offer letter ✓ Due diligence
Listing remarks
UPDATED BEAUTIFUL HOME IN FREEPORT, TX Spacious 3 BDR, 1.5 Story Home with a 2 car Garage and a Carport. The Home was recently remodeled in 2025. No Carpet, Brand New Tile All Throughout. Laminated Wood Floor at Master Bedroom which is located Upstairs. Price Reduced, As Is. The Dishwasher, and stove are fairly new. The bath has a bidet toilet. Utility room in garage. This home comes with a Huge Yard. PROPERTY FOR SALE AS IS. Enjoy the great outdoors with easy access to 288, near Freeport Beach, the Brazos River for fishing, Buc-ee's and a variety of dining options. Do Not Miss this Move-In-Ready Home. Schedule your Showing and Become Part of this Community Today!
Key facts
- Huge yard
- Recently remodeled
- New tile
Tags
Neighborhood map
What this means for you Summary
Snapshot
- This is a 3-bed/1.0-bath single-family listed at $140k.
Deal economics
- At list price, monthly cash flow is $34 ($403/yr) — positive.
- The deal already cash-flows at list — no discount required.
- Meets the 1% rule at list price ($1k rent vs $140k).
- Cap rate 7.2% vs local median 3.8% in Freeport — top-decile yield for the area; either an underpriced asset or a hidden risk that comps aren't pricing in. Stress-test before assuming the spread holds.
Location & tenants
- Location reads 58/100 on livability (#1,205 in TX) — a working-class tenant base; expect higher turnover. Strengths: cost of living A+, housing A+; Watch: crime D, schools F, amenities F.
- Brazosport ISD (suburban): math 43% / reading 41% proficiency, ranked #305 of 826 in TX (top 37%) — families likely to look elsewhere, expect single-tenant / working-renter base with shorter leases.
- Market conditions: 590 active listings in the ZIP; 3 comparable units currently listed for rent nearby; rentals lingering (median 44d on market — plan ~5-8 weeks vacancy on turnover, expect pricing pressure); 100% of comp listings sitting > 30 days — soft ceiling on asking rent; 3,960 units permitted in Brazoria County in 2024 (593 in 5+ unit buildings).
Forward outlook
- Local home prices are declining (-3.0%/yr); year-one equity from $967 of loan paydown is wiped out by about $4k of value loss. Plan a longer hold.
- Brazoria County population projected at +44% by 2050 — long-run rental-demand tailwind backs the buy-and-hold thesis.
Negotiation context
- Only 5 days on market — expect competitive offers; lowballing is unlikely to land.
- 8 sale attempts since 8y ago with the ask held roughly flat each time — persistent listings suggest the price (not the market) is what's stuck; bring a comps-based counter.
- Current owner paid $26k; list at $140k implies a 438% gain — meaningful room to come down on a strong offer.
Risks & watch-outs
- Watch-outs: flood insurance adds $66/mo; built in 1946 — expect roof / HVAC / electrical / plumbing capex.
- Climate carrying-cost: severe flood risk; severe wind risk, 99% chance of damaging wind over 30y; extreme-heat days projected 7→26/yr by 2055 (HVAC capex compounding) — expect insurance premiums to compound above CPI over the hold.
Questions for the listing agent
- Built in 1946 — when were the roof, HVAC, electrical panel, plumbing, and water heater last replaced?
- What's the actual annual flood-insurance premium (NFIP or private), and is the property in a SFHA with mandatory coverage?
- Is there a deadline driving the sale (1031 exchange, divorce, estate, relocation)? That informs how much negotiation room exists.
- Schools are F-rated, which usually means shorter tenancies and higher turnover. Who's the typical renter profile here, and what's been the actual vacancy rate?
- Crime grade is D in this area — have there been break-ins, vandalism, or insurance claims at this property in the last 3 years? What carrier currently insures it and at what premium?
- What's the average days-on-market for RENTAL listings here right now (not sales)? A rising rental-DOM trend means longer vacancies and softer asking-rent achievability than the comps imply.
- What's the recent tenant-quality profile in this submarket — average credit score on applications, eviction rate, late-payment / NSF rate, and stable-employment percentage? A property-management company in the area should have these aggregated.
- How much new for-sale + rental construction is in the pipeline within 1–3 miles? Heavy new supply typically softens prices + rents 12–24 months out; constrained supply supports both.
Investment metrics
- 1% rule
- 1.02% ✓
- Cap rate
- 7.15%
- Cash-on-cash
- 3.07%
- DSCR
- 1.14
- GRM
- 8.2
CMA / ARV
- ARV (median comp)
- $178,910
- List price
- $139,900
- Delta
- -21.80%
- Verdict
- UNDERPRICED
- Comps
- 20 within 1.0 mi
Show comp detail 4 sales within ~0.75 mi
| Address | Dist | Beds/Ba | Sqft | Sold | Price | $/sf | Match |
|---|---|---|---|---|---|---|---|
| 1611 N Avenue O | 0.32mi | 3/2.0 | 1,395 (-8%) | 8mo | $225,000 | $161 | 62 |
| 1513 N Avenue N | 0.40mi | 3/2.0 | 1,395 (-8%) | 22mo | $234,000 | $168 | 47 |
| 1719 N Avenue H | 0.74mi | 4/2.0 (+1) | 1,608 (+7%) | 14mo | $199,900 | $124 | 34 |
| 1920 N Avenue H | 0.73mi | 3/1.5 | 1,314 (-13%) | 19mo | $139,500 | $106 | 27 |
Match score weights: distance 35% · size 25% · config 20% · recency 20%. Top-matched comps best support the ARV.
Projected returns pro-forma
-3.0% appreciation · 3.0% rent growth · sell at horizon
- IRR
- -14.6%
- Equity multiple
- 0.48×
- Total profit
- $-20,430
- Equity at exit
- $20,860
- IRR
- -5.7%
- Equity multiple
- 0.63×
- Total profit
- $-14,629
- Equity at exit
- $12,096
Cash invested: $39,172 (down + closing). Projections, not guarantees.
Landlord ↔ Tenant lean methodology
- Overall (STATE)
- 87 Strongly Landlord-Friendly
- State Texas
- 87 Strongly Landlord-Friendly · R+5
- County
- — inherits STATE
- City
- — inherits STATE
ZIP-level market 77541
- Home prices YoY
- -29.3%
- Active inventory
- 590
- Price-to-rent
- 8.2×
Monthly cashflow live
- Estimated rent
- $1,427 medium interval (Pro) →
- Mortgage (P&I)
- −$734
- Tax from tax record
- −$235 /mo · $2,822/yr
- Insurance
- −$58
- Flood insurance flood zone
- −$66 /mo · $798/yr
- HOA
- −$0
- Vacancy / Maint / Mgmt
- −$300
- Net cashflow
- $34
Break-even live
Sensitivity live
| Price | -10% $113 | -5% $73 | +0% $34 | +5% $-6 | +10% $-46 |
|---|---|---|---|---|---|
| Rent | -10% $-79 | -5% $-23 | +0% $34 | +5% $90 | +10% $146 |
| Rate | -1.0pp $104 | -0.5pp $69 | base $34 | +0.5pp $-3 | +1.0pp $-40 |
UW: 25.0% down · 7.5% · 30yr · 1.5% tax · 5.0% vac · 8.0% maint · 8.0% mgmt
Financing live
Cash to close
- Down payment
- $34,975
- Closing costs
- $4,197
- Reserves months
- —
- Total cash needed
- —
Loan-product check · same deal, 3 products live
Conventional
25% down · 7.5% · 30yr
- Down + closing
- —
- Monthly P&I
- —
- Monthly cashflow
- —
- DSCR
- —
- Eligible?
- —
Personal DTI + credit; lowest rate.
DSCR
20% down · 8.5% · 30yr
- Down + closing
- —
- Monthly P&I
- —
- Monthly cashflow
- —
- DSCR
- —
- Eligible?
- —
No personal income docs; deal must DSCR.
Hard money
10% down · 12.0% · 12mo
- Down + closing
- —
- Monthly P&I
- —
- Monthly cashflow
- —
- DSCR
- —
- Eligible?
- —
Short-term bridge; refi at stabilization.
Rent comps 3 comps
| Address | Beds | Baths | Sqft | Rent | $/sqft | DOM | Units | Dist |
|---|---|---|---|---|---|---|---|---|
| 1708 North Avenue R Unit R Freeport, TX | 3.0 | 2.0 | 1300 | $1,225 | $0.94 | 44d | 1 | 0.06mi |
| 1410 North Avenue R Unit R Freeport, TX | 3.0 | 2.0 | 1395 | $1,277 | $0.92 | 44d | 1 | 0.26mi |
| 905 N Avenue J Freeport, TX | 3.0 | 2.0 | 1161 | $871 | $0.75 | 44d | 1 | 0.87mi |
Listing history 29 events
-
2026-06-18days on market $139,900 Active 5 DOM
-
2026-06-17days on market $139,900 Active 4 DOM
-
2026-06-16days on market $139,900 Active 3 DOM
-
2026-06-15days on market $139,900 Active 2 DOM
-
2026-06-13statusdays on market $139,900 Active 1 DOM
-
2026-05-19historical
-
2026-02-04$139,900 Active
-
2025-12-23historical $1,600
-
2025-12-23historical
-
2025-12-16price $168,000
-
2025-12-07$1,600
-
2025-11-29price $178,000
-
2025-08-06historical $1,800
-
2025-08-05$188,000 Active
-
2025-07-26$1,800
-
2018-10-22soldstatus Sold
-
2018-10-22soldstatus
-
2018-10-22soldstatus
-
2018-08-07status Pending
-
2018-08-03status Option Pending
-
2018-07-19status Active
-
2018-06-22status Pending
-
2018-06-19status Option Pending
-
2018-05-02price $95,000
-
2018-04-23status Active
-
2018-04-19status Option Pending
-
2018-02-13$99,900 Active
-
2018-02-13$95,000
-
1997-03-31soldstatus $26,000
ⓘ Source: listings_history table (triggers on properties + properties_extension) + one-shot
backfill from property_details.listing_events for pre-trigger history.
Tax reassessment forecast TX · Resets to sale price
- Current annual tax
- $2,822 · $235/mo
- Projected year-2 tax
- $2,822 · $235/mo
- Expected delta
- $0/yr ($0/mo · 0.0%)
ⓘ Screening estimate from a state-policy table — verify with the county assessor before closing.
Climate risk First Street
- Flood 8/10 Severe FEMA zone X (unshaded) · 60% chance over 30 yrs
- Wildfire 3/10 Moderate
- Heat 10/10 Extreme 7 d/yr ≥114°F today · 26 d/yr by 30 yrs out
- Wind 9/10 Extreme 99% chance of damaging wind over 30 yrs
- Air quality 2/10 Low 1 unhealthy d/yr today · 1 by 30 yrs out
Nearby sold comps map
Loading sold comps map…
Walkable amenities ~0.75 mi
Loading nearby amenities…
Taxation est. · year 1
- Rental income
- $17,121
- − Mortgage interest
- −$7,837
- − Property taxes
- −$2,822
- − Insurance
- −$1,497
- − Repairs & maintenance
- −$1,370
- − Management
- −$1,370
- − Depreciation
- −$4,070
- Taxable loss
- −$1,843
- Est. tax savings @ 24.0%
- +$442
- After-tax cash flow
- $846/yr
For passive investors: Depreciation is non-cash, so a rental often shows a tax loss while cash-flowing — sheltering income. Rental losses are passive: they offset passive income freely, and up to $25,000/yr can offset ordinary (W-2) income if you actively participate and your MAGI is under $100k (phasing out to $0 by $150k); unused losses carry forward. On sale, claimed depreciation is recaptured at up to 25%, and gains may owe capital-gains tax (a 1031 exchange can defer both). Figures are a year-1 estimate at your 24.0% rate — not tax advice; consult a CPA.
Schools (NCES district)
- District
- Brazosport ISD
- NCES district ID
- 4811190
- Math proficiency
- 43% ▼ -6.00%
- Reading proficiency
- 41% ▼ -2.00%
- Median HH income
- $57,024
- Composite
- 36.84/100
- National rank
- #4557
- State rank
- #305 of 826 in TX
Livability — Freeport
- Score
- 58/100
- State rank
- #1205
- US rank
- #21044
Category grades
Schools grade is shown separately in the Schools card above.
Census & demographics
- Census place
- Freeport, TX
- County
- Brazoria County · 374,982 people
- City population
- 16,996
- Metro
- Houston-The Woodlands-Sugar Land, TX
- Population (ZIP)
- 16,996
- Household income
- $66,507
- Rent vs Own
- Severe rent burden
- 354.0
Population outlook (Brazoria County) Hauer SSP2
- Today (2025)
- 420,414 people
- By 2030
- 457,585 · +8.8%
- By 2040
- 532,232 · +26.6%
- By 2050
- 605,399 · +44.0%
- By 2075
- 779,358 · +85.4%
- By 2100
- 883,759 · +110.2%
Race, ethnicity, and origin ACS 2023
- Neighborhood character
- Diverse neighborhood (Simpson 0.62)
- Race & ethnicity
- Hispanic / Latino 47% White 38% Two or more races 23% Black 12%
- Hispanic origin (detail)
- Mexican 42%
- Common ancestry
- Romanian 1% Italian 1% Lithuanian 1%
- Foreign-born
- 12% · Canada
- Languages at home
- 71% English-only · Spanish 29%
Political lean MEDSL · Brazoria
- 2024 margin
- R (+19.7) · D 39.5% · R 59.2% · Other 1.3%
- 2008→2024 swing
- +9.9pp toward D · 2008: -29.6pp · 2024: -19.7pp
- All cycles
- 2024: R+19.7 2020: R+18.2 2016: R+24.6 2012: R+34.2 2008: R+29.6
Not yet ingested
- Civics
- —
Market trends
- HPI YoY
- ▼ -110.12%
- Current HPI
- 265.9301
- Rent YoY
- —
- Metro
- Houston-The Woodlands-Sugar Land, TX
- State GDP YoY
- ▲ 3.95%
- F500 in state
- 110
Industry mix (Fortune 500 HQ in TX)
| Industry | F500 HQs | Revenue |
|---|---|---|
| Energy | 16 | $1,198B |
|
||
| Technology | 5 | $198B |
|
||
| Engineering / Construction | 4 | $72B |
|
||
| Energy Services | 3 | $60B |
|
||
| Utilities | 3 | $41B |
|
||
| Healthcare | 2 | $330B |
|
||
Price history
+438.1% since first listed24 events — show timeline
- 2026-05-19 Listing Removed — HARMLS
- 2026-02-04 Listed $139,900 HARMLS
- 2025-12-23 Rental Removed $1,600 HARMLS
- 2025-12-23 Listing Removed — HARMLS
- 2025-12-16 Price Changed $168,000 HARMLS
- 2025-12-07 Listed for Rent $1,600 HARMLS
- 2025-11-29 Price Changed $178,000 HARMLS
- 2025-08-06 Rental Removed $1,800 HARMLS
- 2025-08-05 Listed $188,000 HARMLS
- 2025-07-26 Listed for Rent $1,800 HARMLS
- 2018-10-22 Sold (Public Records) — Public Records
- 2018-10-22 Sold (MLS) — BCBR
- 2018-10-22 Sold (MLS) — HARMLS
- 2018-08-07 Pending — HARMLS
- 2018-08-03 Pending — HARMLS
- 2018-07-19 Relisted — HARMLS
- 2018-06-22 Pending — HARMLS
- 2018-06-19 Pending — HARMLS
- 2018-05-02 Price Changed $95,000 HARMLS
- 2018-04-23 Relisted — HARMLS
- 2018-04-19 Pending — HARMLS
- 2018-02-13 Listed $95,000 BCBR
- 2018-02-13 Listed $99,900 HARMLS
- 1997-03-31 Sold (Public Records) $26,000 Public Records
Property tax history
+4.6%/yrLatest (2025): $2,822 · -16.4% YoY. Source: county tax records.
Cash-flow waterfall
monthlySold comps — $/sqft
last 12 mo · ≤1 miLoading sold comps…