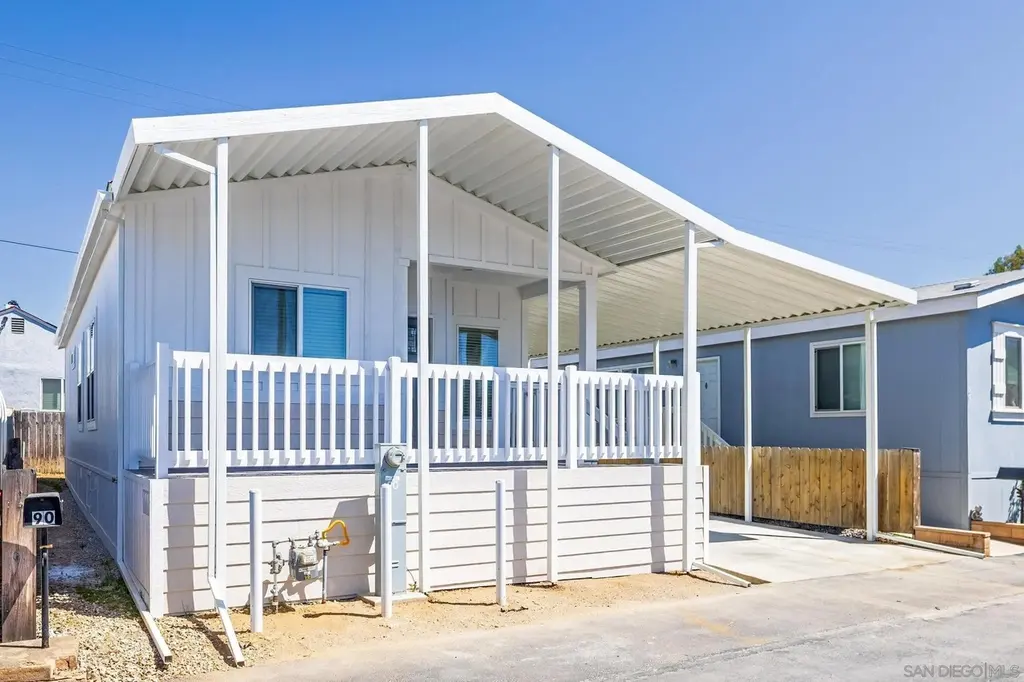
1315 Pepper Dr #90 · Bostonia, CA
Flood risk 6/10 · Moderate
- FEMA flood zone
- X (unshaded)
- Chance of flooding over 30 yrs
- 0.74%
- Est. flood insurance / yr
- $507 – $1,088
Fire risk 3/10 · Minor
- Est. fire insurance / yr
- $659 – $1,223
Heat risk 5/10 · Moderate
- Hot days now (above 98°F)
- 5 days/yr
- Hot days in 30 yrs
- 15 days/yr
Wind risk 1/10 · Minimal
- Chance of severe wind over 30 yrs
- —
Air-quality risk 4/10 · Minor
- Unhealthy air days now
- 6 days/yr
- Unhealthy air days in 30 yrs
- 7 days/yr
Risk factors via First Street. Map © Google.
Why this score? — see what drove the F grade
The composite is a weighted blend of 9 inputs, each scored 0–100. Each bar is that input's sub-score; the figure is the points it added to the 100-point composite (weight × sub-score).
- Cash flow +12.0/30.0
- Schools +4.0/10.0
- DSCR +3.6/10.0
- 1% rule +3.5/10.0
- Livability +3.2/5.0
- Condition / age +2.5/5.0
- Rent growth +2.3/5.0
- ARV discount +0.0/15.0
- Appreciation +0.0/10.0
$278,500
🖨 Deal sheet (PDF) 📄 Offer letter ✓ Due diligence
Listing remarks
This soft palette home, in a well maintained family park, offers the rustic charm of board & batten, 9' ceilings, custom laminate flooring throughout and upgraded carpeting in bedrooms. The kitchen offers an upgraded package that includes stainless steel: dishwasher, self-cleaning gas range, stainless single bowl sink, microwave, side-by-side refrigerator w/ water & ice dispenser. Kitchen also offers LED recessed lighting, upgraded spring faucet, full tiled backsplash. Throughout it offers: Upgraded 5-1/4 baseboard molding, soft close cabinet doors, 6 panel interior doors w/ lever handles, & black hardware. Ceiling fans/lights in both bedrooms and living room. Primary bathr
Key facts
- 2 parking spots
- Community pool
- Built 2026
Tags
Property features AI
Finance
- HOA & community: Located in a community with a shared pool
Exterior
- Parking: 2 parking spaces
- Utilities: Sewer connected
- Home design: Manufactured home; Single-story; No one above or below (no common walls); Located in the Pepper Villa community, El Cajon
- Construction: HardiPlank-type siding; Shingle roof; Built as a manufactured home
- Exterior features: Covered porch with awnings; Partial fencing; Community pool; Shed(s)
Interior
- Kitchen: Dishwasher; Disposal; Microwave; Refrigerator; Free-standing range / Oven; Self-cleaning oven; Ice maker; Gas range
- Bedrooms: 2 possible bedrooms
- Bathrooms: 2 full bathrooms
- Heating & cooling: Central air conditioning; Forced air heating (natural gas)
- Interior features: Dishwasher; Disposal; Microwave; Refrigerator; Free-standing range / Oven; Self-cleaning oven; Ice maker; Gas range; Range
- Laundry & utility: Washer hookup
Neighborhood map
What this means for you Summary
Snapshot
- This is a 2-bed/2.0-bath manufactured listed at $278k.
Deal economics
- At list price, monthly cash flow is $-65 ($-780/yr) — negative.
- To cash-flow at today's rent, offer at most $269k (3.4% below list).
- To meet the 1% rule (rent ≥ 1% of price), the offer needs to be $235k (15.5% below list).
- Recommended offer: $235k (15.5% below list) — sets the bar for 1% rule.
Location & tenants
- Location reads 65/100 on livability (#383 in CA) — a middle-class / working-renter tenant base. Strengths: commute A+, housing B+; Watch: crime F, amenities F, cost of living F.
- Grossmont Union High (suburban): math 31% / reading 60% proficiency, ranked #173 of 517 in CA (top 34%) — families likely to look elsewhere, expect single-tenant / working-renter base with shorter leases; only 17% free/reduced lunch — higher-income household profile.
- Zoned schools: W. D. Hall Elementary (540 students, 81% FRL); Greenfield Middle (663 students, 84% FRL); El Cajon Valley High (math 22% / reading 45%, grade F, #656 of 1,170 statewide, top 57%, 1,652 students, 91% FRL) — zoned schools average 85% FRL vs 17% district-wide (69 pts higher); higher-poverty schools than district average — tighter screening recommended.
- Zoned-school proficiency averages 34% at this address vs 46% district-wide (-12 pts) — the specific schools serving this property underperform the Grossmont Union High average; the district grade overstates school quality for this exact location.
- Market conditions: Rents soft (-0.8%/yr); 244 active listings in the ZIP; 39 comparable units currently listed for rent nearby; rentals leasing fast (median 0d on market — plan ~1-2 weeks tenant-placement turnaround); 11,759 units permitted in San Diego County in 2024 (7,244 in 5+ unit buildings).
- This rent runs 38% of the median local income ($74k/yr) — at the standard rent-burdened threshold; future hikes will face affordability resistance.
Forward outlook
- Local home prices are declining (-3.0%/yr); year-one equity from $2k of loan paydown is wiped out by about $8k of value loss. Plan a longer hold.
- San Diego County population projected at +20% by 2050 — long-run rental-demand tailwind backs the buy-and-hold thesis.
Negotiation context
- It's been on market 72 days — a 6% lower offer ($262k) is reasonable based on typical stale-listing flexibility.
Risks & watch-outs
- Climate carrying-cost: major flood risk; extreme-heat days projected 5→15/yr by 2055 (HVAC capex compounding) — expect insurance premiums to compound above CPI over the hold.
Questions for the listing agent
- What do current leases actually rent for vs. the listed asking? Can we see a recent rent roll and the last 12 months of T-12 income?
- It's been on market 72 days. Have you received any prior offers? Is the seller open to a 15% concession, seller financing, or rate buy-down credit?
- Why hasn't it sold? Are there any deal-killer items the seller is aware of (foundation, flood, title, zoning, code violations)?
- Is there a deadline driving the sale (1031 exchange, divorce, estate, relocation)? That informs how much negotiation room exists.
- Schools are D-rated, which usually means shorter tenancies and higher turnover. Who's the typical renter profile here, and what's been the actual vacancy rate?
- Crime grade is F in this area — have there been break-ins, vandalism, or insurance claims at this property in the last 3 years? What carrier currently insures it and at what premium?
- The area grade is low — what's the realistic commute time and amenity access for the typical tenant pool here? Any planned neighborhood developments (good or bad) we should know about?
- What's the average days-on-market for RENTAL listings here right now (not sales)? A rising rental-DOM trend means longer vacancies and softer asking-rent achievability than the comps imply.
- What's the recent tenant-quality profile in this submarket — average credit score on applications, eviction rate, late-payment / NSF rate, and stable-employment percentage? A property-management company in the area should have these aggregated.
- How much new for-sale + rental construction is in the pipeline within 1–3 miles? Heavy new supply typically softens prices + rents 12–24 months out; constrained supply supports both.
Investment metrics
- 1% rule
- 0.85% ✗
- Cap rate
- 6.01%
- Cash-on-cash
- -1.00%
- DSCR
- 0.96
- GRM
- 9.9
CMA / ARV
- ARV (on-the-fly)
- $202,560
- Comps found
- 7
Show comp detail 7 sales within ~0.75 mi
| Address | Dist | Beds/Ba | Sqft | Sold | Price | $/sf | Match |
|---|---|---|---|---|---|---|---|
| 1351 Pepper Dr Spc 62 | 0.11mi | 2/2.0 | 1,056 (+10%) | 2mo | $226,900 | $215 | 76 |
| 1315 Pepper Dr #82 | 0.07mi | 3/2.0 (+1) | 878 (-8%) | 6mo | $185,000 | $211 | 72 |
| 1120 Pepper Dr #101 | 0.46mi | 2/2.0 | 960 (0%) | 11mo | $139,000 | $145 | 70 |
| 12044 Royal Rd #63 | 0.32mi | 3/2.0 (+1) | 1,000 (+4%) | 5mo | $257,321 | $257 | 69 |
| 12044 Royal Rd #76 | 0.32mi | 2/2.0 | 880 (-8%) | 4mo | $1,450,000 | $1,648 | 68 |
| 1351 Pepper Dr Spc 40 | 0.11mi | 2/2.0 | 1,056 (+10%) | 20mo | $171,000 | $162 | 62 |
| 12044 Royal Rd Spc 66 | 0.32mi | 3/2.0 (+1) | 880 (-8%) | 21mo | $155,000 | $176 | 49 |
Match score weights: distance 35% · size 25% · config 20% · recency 20%. Top-matched comps best support the ARV.
Projected returns pro-forma
-3.0% appreciation · 0.0% rent growth · sell at horizon
- IRR
- -21.4%
- Equity multiple
- 0.28×
- Total profit
- $-56,130
- Equity at exit
- $41,525
- IRR
- -24.2%
- Equity multiple
- -0.04×
- Total profit
- $-80,721
- Equity at exit
- $24,080
Cash invested: $77,980 (down + closing). Projections, not guarantees.
Landlord ↔ Tenant lean methodology
- Overall (STATE)
- 18 Strongly Tenant-Friendly
- State California
- 18 Strongly Tenant-Friendly · D+13
- County
- — inherits STATE
- City
- — inherits STATE
ZIP-level market 92021
- Rents YoY
- -0.8%
- Active inventory
- 244
- Price-to-rent
- 9.9×
Monthly cashflow live
- Estimated rent
- $2,354 high interval (Pro) →
- Mortgage (P&I)
- −$1,460
- Tax est. 1.5%
- −$348 /mo · $4,178/yr
- Insurance
- −$116
- HOA
- −$0
- Vacancy / Maint / Mgmt
- −$494
- Net cashflow
- $-65
Break-even live
Sensitivity live
| Price | -10% $128 | -5% $31 | +0% $-65 | +5% $-161 | +10% $-257 |
|---|---|---|---|---|---|
| Rent | -10% $-251 | -5% $-158 | +0% $-65 | +5% $28 | +10% $121 |
| Rate | -1.0pp $75 | -0.5pp $6 | base $-65 | +0.5pp $-137 | +1.0pp $-211 |
UW: 25.0% down · 7.5% · 30yr · 1.5% tax · 5.0% vac · 8.0% maint · 8.0% mgmt
Financing live
Cash to close
- Down payment
- $69,625
- Closing costs
- $8,355
- Reserves months
- —
- Total cash needed
- —
Loan-product check · same deal, 3 products live
Conventional
25% down · 7.5% · 30yr
- Down + closing
- —
- Monthly P&I
- —
- Monthly cashflow
- —
- DSCR
- —
- Eligible?
- —
Personal DTI + credit; lowest rate.
DSCR
20% down · 8.5% · 30yr
- Down + closing
- —
- Monthly P&I
- —
- Monthly cashflow
- —
- DSCR
- —
- Eligible?
- —
No personal income docs; deal must DSCR.
Hard money
10% down · 12.0% · 12mo
- Down + closing
- —
- Monthly P&I
- —
- Monthly cashflow
- —
- DSCR
- —
- Eligible?
- —
Short-term bridge; refi at stabilization.
Rent comps 39 comps
| Address | Beds | Baths | Sqft | Rent | $/sqft | DOM | Units | Dist |
|---|---|---|---|---|---|---|---|---|
| 1651 Braddon Way Unit B El Cajon, CA | 1.0 | 2.0 | 800 | $2,000 | $2.50 | 0d | 1 | 0.13mi |
| 8031 Winter Gardens Blvd El Cajon, CA | 3.0 | 2.0 | 1124 | $2,995 | $2.66 | 0d | 1 | 0.20mi |
| 8424 Pueblo Rd Unit 8424 Lakeside, CA | 3.0 | 1.0 | 1000 | $2,650 | $2.65 | 0d | 1 | 0.64mi |
| 1221 Oro St El Cajon, CA | 2.0 | 1.5 | 1020 | $2,575 | $2.52 | 0d | 1 | 0.69mi |
| 12171 Winter Gardens Dr Lakeside, CA | 2.0 | 1.0 | 862 | $2,500 | $2.90 | 0d | 1 | 0.71mi |
| 1641 Greenfield Dr Unit 1641 El Cajon, CA | 1.0 | 1.0 | 600 | $1,900 | $3.17 | 0d | 1 | 0.78mi |
| 1365 Broadway El Cajon, CA | 3.0 | 2.0 | 1000 | $3,478 | $3.48 | 3d | 1 | 0.88mi |
| 1430 Diamond Ln El Cajon, CA | 2.0 | 1.0 | 863 | $2,695 | $3.12 | 4d | 1 | 0.88mi |
| 1314 5 D Dr Unit 1318 El Cajon, CA | 3.0 | 1.0 | 960 | $2,600 | $2.71 | 26d | 1 | 0.90mi |
| 1696 Buckeye Dr El Cajon, CA | 3.0 | 1.0 | 942 | $2,900 | $3.08 | 4d | 1 | 0.91mi |
| 1546 Broadway El Cajon, CA | 1.0 | 1.0 | 625 | $1,745 | $2.79 | 0d | 1 | 0.95mi |
| 745 E Bradley Ave Unit 46 El Cajon, CA | 3.0 | 1.0 | 806 | $2,298 | $2.85 | 26d | 1 | 1.07mi |
| 2000 E Main St El Cajon, CA | 3.0 | 1.5–2.5 | 1165 | $3,300 | $2.83 | 0d | 1 | 1.09mi |
| 1050 Peach Ave El Cajon, CA | 2.0 | 2.0 | 850 | $3,460 | $4.07 | 7d | 1 | 1.18mi |
| 1294 N Mollison Ave El Cajon, CA | 1.0–2.0 | 1.0 | 750 | $2,112 | $2.82 | 0d | 6 | 1.18mi |
| 1038 Peach Ave El Cajon, CA | 2.0 | 1.5 | 850 | $1,870 | $2.20 | 0d | 1 | 1.20mi |
| 8237 Churchill Dr El Cajon, CA | 1.0 | 1.0 | 560 | $1,950 | $3.48 | 0d | 1 | 1.20mi |
| 1005 N Mollison Ave El Cajon, CA | 2.0 | 1.0 | 750 | $2,195 | $2.93 | 0d | 1 | 1.24mi |
| 1037 Peach Ave El Cajon, CA | 1.0 | 1.0 | 560 | $1,694 | $3.03 | 0d | 4 | 1.24mi |
| 1343 Oakdale Ave El Cajon, CA | 1.0–2.0 | 1.0–2.0 | 800 | $2,195 | $2.74 | 0d | 1 | 1.25mi |
| 1377 Oakdale Ave Unit 03 El Cajon, CA | 2.0 | 2.0 | 900 | $2,425 | $2.69 | 1d | 1 | 1.25mi |
| 425 E Bradley Ave El Cajon, CA | 1.0–2.0 | 1.0 | 771 | $2,350 | $3.05 | 0d | 13 | 1.26mi |
| 1512 Oakdale Ave Unit 1512-2 El Cajon, CA | 2.0 | 1.0 | 805 | $1,925 | $2.39 | 0d | 1 | 1.27mi |
| 1520 Oakdale Ave Apt 3 El Cajon, CA | 2.0 | 1.0 | 840 | $2,125 | $2.53 | 9d | 1 | 1.27mi |
| 1019 Peach Ave El Cajon, CA | 1.0–2.0 | 1.0–2.0 | 700 | $2,161 | $3.09 | 0d | 7 | 1.29mi |
| 1360 E Madison Ave El Cajon, CA | 1.0–2.0 | 1.0 | 550 | $2,595 | $4.72 | 0d | 22 | 1.31mi |
| 360 E Bradley Ave El Cajon, CA | 3.0 | 2.0 | 1116 | $2,974 | $2.66 | 0d | 4 | 1.31mi |
| 523 Grape St El Cajon, CA | 1.0 | 1.0 | 648 | $1,695 | $2.62 | 0d | 2 | 1.33mi |
| 989 Peach Ave El Cajon, CA | 1.0–3.0 | 1.0–2.0 | 845 | $2,202 | $2.61 | 0d | 11 | 1.34mi |
| 8937 Fair Ln Lakeside, CA | 1.0 | 1.0 | 640 | $2,050 | $3.20 | 0d | 1 | 1.34mi |
| 500 Grape St El Cajon, CA | 2.0 | 1.0 | 900 | $2,150 | $2.39 | 0d | 1 | 1.35mi |
| 1261 Victor Ave Unit 9 El Cajon, CA | 2.0 | 2.0 | 810 | $2,195 | $2.71 | 0d | 1 | 1.36mi |
| 798 McClure St Apt 7 El Cajon, CA | 1.0 | 1.0 | 570 | $1,595 | $2.80 | 0d | 1 | 1.40mi |
| 798 McClure St Unit 14 El Cajon, CA | 3.0 | 1.0 | 916 | $2,295 | $2.51 | 0d | 1 | 1.40mi |
| 310 E Bradley Ave El Cajon, CA | 1.0–2.0 | 1.0 | 664 | $2,050 | $3.09 | 0d | 1 | 1.40mi |
| 421 Shady Ln El Cajon, CA | 1.0 | 1.0 | 575 | $1,708 | $2.97 | 0d | 3 | 1.44mi |
| 422 Shady Ln El Cajon, CA | 1.0–3.0 | 1.0–2.0 | 900 | $2,305 | $2.56 | 0d | 18 | 1.45mi |
| 541 N 1st St Apt 14 El Cajon, CA | 1.0 | 1.0 | 550 | $1,550 | $2.82 | 0d | 1 | 1.47mi |
| 848 N Mollison Ave El Cajon, CA | 1.0 | 1.0 | 690 | $2,101 | $3.04 | 0d | 5 | 1.48mi |
Listing history 16 events
-
2026-06-21days on market $278,500 Active 72 DOM
-
2026-06-18days on market $278,500 Active 69 DOM
-
2026-06-17days on market $278,500 Active 68 DOM
-
2026-06-16days on market $278,500 Active 67 DOM
-
2026-06-15days on market $278,500 Active 66 DOM
-
2026-06-13days on market $278,500 Active 64 DOM
-
2026-06-13days on market $278,500 Active 63 DOM
-
2026-06-09days on market $278,500 Active 60 DOM
-
2026-06-08days on market $278,500 Active 59 DOM
-
2026-06-07days on market $278,500 Active 58 DOM
-
2026-06-04days on market $278,500 Active 55 DOM
-
2026-06-03days on market $278,500 Active 54 DOM
-
2026-06-02days on market $278,500 Active 53 DOM
-
2026-06-01days on market $278,500 Active 52 DOM
-
2026-05-31days on market $278,500 Active 51 DOM
-
2026-04-10$278,500 Active
ⓘ Source: listings_history table (triggers on properties + properties_extension) + one-shot
backfill from property_details.listing_events for pre-trigger history.
Climate risk First Street
- Flood 6/10 Major FEMA zone X (unshaded) · 74% chance over 30 yrs
- Wildfire 3/10 Moderate
- Heat 5/10 Major 5 d/yr ≥98°F today · 15 d/yr by 30 yrs out
- Wind 1/10 Low
- Air quality 4/10 Moderate 6 unhealthy d/yr today · 7 by 30 yrs out
Nearby sold comps map
Loading sold comps map…
Walkable amenities ~0.75 mi
Loading nearby amenities…
Taxation est. · year 1
- Rental income
- $28,248
- − Mortgage interest
- −$15,600
- − Property taxes
- −$4,178
- − Insurance
- −$1,392
- − Repairs & maintenance
- −$2,260
- − Management
- −$2,260
- − Depreciation
- −$8,102
- Taxable loss
- −$5,543
- Est. tax savings @ 24.0%
- +$1,330
- After-tax cash flow
- $551/yr
For passive investors: Depreciation is non-cash, so a rental often shows a tax loss while cash-flowing — sheltering income. Rental losses are passive: they offset passive income freely, and up to $25,000/yr can offset ordinary (W-2) income if you actively participate and your MAGI is under $100k (phasing out to $0 by $150k); unused losses carry forward. On sale, claimed depreciation is recaptured at up to 25%, and gains may owe capital-gains tax (a 1031 exchange can defer both). Figures are a year-1 estimate at your 24.0% rate — not tax advice; consult a CPA.
Schools (NCES district)
- District
- Grossmont Union High
- NCES district ID
- 0616230
- Math proficiency
- 31% ▼ -1.00%
- Reading proficiency
- 60% ▲ 5.00%
- Median HH income
- $61,801
- Composite
- 40.07/100
- National rank
- #3810
- State rank
- #173 of 517 in CA
Livability — Bostonia
- Score
- 65/100
- State rank
- #383
- US rank
- #13065
Category grades
Schools grade is shown separately in the Schools card above.
Census & demographics
- Census place
- Bostonia, CA
- County
- San Diego County · 3,178,799 people
- Metro
- San Diego-Chula Vista-Carlsbad, CA
- Population (ZIP)
- 70,501
- Household income
- $74,013
- Rent vs Own
- Severe rent burden
- 4178.0
Population outlook (San Diego County) Hauer SSP2
- Today (2025)
- 3,678,185 people
- By 2030
- 3,856,546 · +4.8%
- By 2040
- 4,171,407 · +13.4%
- By 2050
- 4,421,607 · +20.2%
- By 2075
- 4,831,599 · +31.4%
- By 2100
- 4,832,502 · +31.4%
Race, ethnicity, and origin ACS 2023
- Neighborhood character
- Diverse neighborhood (Simpson 0.62)
- Race & ethnicity
- White 54% Hispanic / Latino 28% Two or more races 14% Black 6% Asian 5% Native American 2%
- Hispanic origin (detail)
- Mexican 24%
- Common ancestry
- Arab 6% Italian 2% Lithuanian 2%
- Foreign-born
- 22% · Canada
- Languages at home
- 65% English-only · Spanish 18% Arabic 7% Other Indo-European 3%
Political lean MEDSL · San Diego
- 2024 margin
- D (+16.8) · D 56.9% · R 40.1% · Other 2.9%
- 2008→2024 swing
- +6.6pp toward D · 2008: 10.2pp · 2024: 16.8pp
- All cycles
- 2024: D+16.8 2020: D+22.8 2016: D+17.8 2012: D+5.1 2008: D+10.2
Not yet ingested
- Civics
- —
Market trends
- HPI YoY
- ▼ -654.88%
- Current HPI
- 335.0617
- Rent YoY
- ▼ -0.83%
- Metro
- San Diego-Chula Vista-Carlsbad, CA
- State GDP YoY
- ▲ 3.21%
- F500 in state
- 116
Industry mix (Fortune 500 HQ in CA)
| Industry | F500 HQs | Revenue |
|---|---|---|
| Technology | 27 | $1,492B |
|
||
| Financial Services | 3 | $174B |
|
||
| Retail | 3 | $44B |
|
||
| Insurance | 3 | $26B |
|
||
| Media / Entertainment | 2 | $115B |
|
||
| Pharmaceuticals / Biotech | 2 | $62B |
|
||
Price history
1 event — show timeline
- 2026-04-10 Listed $278,500 SDMLS
Property tax history
+3.4%/yrLatest (2013): $207 · +5.9% YoY. Source: county tax records.
Cash-flow waterfall
monthlySold comps — $/sqft
last 12 mo · ≤1 miLoading sold comps…