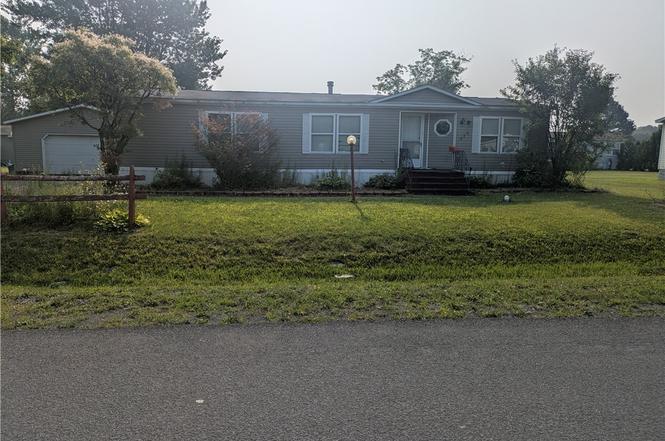
222 Pazdur Blvd West · Rome, NY
Flood risk 1/10 · Minimal
- FEMA flood zone
- X (unshaded)
- Chance of flooding over 30 yrs
- 0.0%
- Est. flood insurance / yr
- $507 – $1,088
Fire risk 1/10 · Minimal
- Est. fire insurance / yr
- $691 – $1,283
Heat risk 3/10 · Minor
- Hot days now (above 94°F)
- 7 days/yr
- Hot days in 30 yrs
- 17 days/yr
Wind risk 1/10 · Minimal
- Chance of severe wind over 30 yrs
- —
Air-quality risk 2/10 · Minimal
- Unhealthy air days now
- 0 days/yr
- Unhealthy air days in 30 yrs
- 2 days/yr
Risk factors via First Street. Map © Google.
Why this score? — see what drove the B+ grade
The composite is a weighted blend of 9 inputs, each scored 0–100. Each bar is that input's sub-score; the figure is the points it added to the 100-point composite (weight × sub-score).
- Cash flow +30.0/30.0
- ARV discount +15.0/15.0
- 1% rule +10.0/10.0
- DSCR +10.0/10.0
- Schools +5.6/10.0
- Livability +3.2/5.0
- Rent growth +2.5/5.0
- Condition / age +2.5/5.0
- Appreciation +0.0/10.0
$45,000
🖨 Deal sheet 📄 Offer letter ✓ Due diligence
Key facts
- 2 garage spots
- Built 1989
- Listed 108 days
Property features AI
Finance
- Financial info: Monthly land lease: $623
- HOA & community: Land lease in place
Exterior
- Parking: Detached garage; Two garage spaces
- Utilities: Public water (connected); Public sewer (connected); Electric service with circuit breakers
- Home design: Double-wide mobile home; Single-story; Existing/resale property; Beaumont model; Entry on main level
- Construction: Aluminum siding; Asphalt shingle roof; Block, pillar/post/pier and slab foundation; Attic/crawl hatchway(s) insulated
- Exterior features: Deck; Blacktop driveway; Rectangular lot
Interior
- Kitchen: Electric oven; Electric range; Gas cooktop; Range hood; Microwave; Refrigerator; Dishwasher; Exhaust fan; Kitchen island; Pantry
- Bedrooms: Three main-level bedrooms
- Flooring: Carpet; Hardwood; Laminate; Varies
- Bathrooms: One full bathroom; One half bathroom; Two main-level bathrooms
- Heating & cooling: Gas forced-air heating; Window air conditioning units; Circuit breaker electrical panel
- Interior features: Cathedral ceilings; Separate/formal living room; Kitchen island; Kitchen/family room combo; Living/dining room; Pantry; Sliding glass doors; Window treatments; Drapes; Accessible doors; No stairs (accessible entry)
- Laundry & utility: Main-level laundry; Washer; Dryer; Gas water heater
Neighborhood map
What this means for you Summary
Snapshot
- This is a 3-bed/1.5-bath manufactured listed at $45k.
Deal economics
- At list price, monthly cash flow is $967 ($12k/yr) — positive.
- The deal already cash-flows at list — no discount required.
- Meets the 1% rule at list price ($2k rent vs $45k).
- Recommended offer: $41k (9.0% below list) — sets the bar for market timing.
- Cap rate 32.1% vs local median 5.6% in Rome — top-decile yield for the area; either an underpriced asset or a hidden risk that comps aren't pricing in. Stress-test before assuming the spread holds.
Location & tenants
- Location reads 64/100 on livability (#722 in NY) — a middle-class / working-renter tenant base. Strengths: cost of living A+, housing A+; Watch: health & safety C-, schools F, amenities F.
- Westmoreland Central School District (rural): math 61% / reading 68% proficiency, ranked #173 of 590 in NY (top 29%) — acceptable for families but not a draw, mixed tenant base, ~2y average lease.
- Market conditions: 272 active listings in the ZIP; 204 units permitted in Oneida County in 2024 (68 in 5+ unit buildings).
Forward outlook
- Local home prices are declining (-3.0%/yr); year-one equity from $311 of loan paydown is wiped out by about $1k of value loss. Plan a longer hold.
- Oneida County population projected at -12% by 2050 — secular population decline; favor cash flow + early exit over multi-decade hold.
- At projected returns (-3.0% appreciation + 3.0% rent growth), your $13k cash investment doubles in ~2 years — after that, you're playing with house money.
Negotiation context
- It's been on market 109 days — a 9% lower offer ($41k) is reasonable based on typical stale-listing flexibility.
- 4 sale attempts with the ask held roughly flat each time — persistent listings suggest the price (not the market) is what's stuck; bring a comps-based counter.
Questions for the listing agent
- It's been on market 109 days. Have you received any prior offers? Is the seller open to a 9% concession, seller financing, or rate buy-down credit?
- Why hasn't it sold? Are there any deal-killer items the seller is aware of (foundation, flood, title, zoning, code violations)?
- Is there a deadline driving the sale (1031 exchange, divorce, estate, relocation)? That informs how much negotiation room exists.
- Schools are F-rated, which usually means shorter tenancies and higher turnover. Who's the typical renter profile here, and what's been the actual vacancy rate?
- What's the average days-on-market for RENTAL listings here right now (not sales)? A rising rental-DOM trend means longer vacancies and softer asking-rent achievability than the comps imply.
- What's the recent tenant-quality profile in this submarket — average credit score on applications, eviction rate, late-payment / NSF rate, and stable-employment percentage? A property-management company in the area should have these aggregated.
- How much new for-sale + rental construction is in the pipeline within 1–3 miles? Heavy new supply typically softens prices + rents 12–24 months out; constrained supply supports both.
Investment metrics
- 1% rule
- 3.59% ✓
- Cap rate
- 32.07%
- Cash-on-cash
- 92.08%
- DSCR
- 5.10
- GRM
- 2.3
CMA / ARV
- ARV (on-the-fly)
- $84,672
- Comps found
- 4
Show comp detail 4 sales within ~0.75 mi
| Address | Dist | Beds/Ba | Sqft | Sold | Price | $/sf | Match |
|---|---|---|---|---|---|---|---|
| 9 Sunrise Blvd E | 0.15mi | 3/2.0 | 1,568 (+4%) | 10mo | $125,000 | $80 | 77 |
| 11 Carmel Dr #109 | 0.07mi | 3/2.0 | 1,632 (+8%) | 19mo | $90,000 | $55 | 66 |
| 126 Pazdur Blvd, S | 0.20mi | 3/2.0 | 1,456 (-4%) | 21mo | $81,000 | $56 | 65 |
| 105 Pazdur Blvd | 0.34mi | 3/2.0 | 1,680 (+11%) | 23mo | $46,000 | $27 | 45 |
Match score weights: distance 35% · size 25% · config 20% · recency 20%. Top-matched comps best support the ARV.
Projected returns pro-forma
-3.0% appreciation · 3.0% rent growth · sell at horizon
- IRR
- 92.8%
- Equity multiple
- 5.31×
- Total profit
- $54,308
- Equity at exit
- $6,710
- IRR
- 95.7%
- Equity multiple
- 11.05×
- Total profit
- $126,678
- Equity at exit
- $3,891
Cash invested: $12,600 (down + closing). Projections, not guarantees.
Landlord ↔ Tenant lean methodology
- Overall (STATE)
- 15 Strongly Tenant-Friendly
- State New York
- 15 Strongly Tenant-Friendly · D+10
- County
- — inherits STATE
- City
- — inherits STATE
ZIP-level market 13440
- Home prices YoY
- -8.0%
- Active inventory
- 272
- Price-to-rent
- 2.3×
Monthly cashflow live
- Estimated rent
- $1,617 medium interval (Pro) →
- Mortgage (P&I)
- −$236
- Tax est. 1.5%
- −$56 /mo · $675/yr
- Insurance
- −$19
- HOA
- −$0
- Vacancy / Maint / Mgmt
- −$340
- Net cashflow
- $967
Break-even live
UW: 25.0% down · 7.5% · 30yr · 1.5% tax · 5.0% vac · 8.0% maint · 8.0% mgmt
Financing live
Cash to close
- Down payment
- $11,250
- Closing costs
- $1,350
- Reserves months
- —
- Total cash needed
- —
Loan-product check · same deal, 3 products live
Conventional
25% down · 7.5% · 30yr
- Down + closing
- —
- Monthly P&I
- —
- Monthly cashflow
- —
- DSCR
- —
- Eligible?
- —
Personal DTI + credit; lowest rate.
DSCR
20% down · 8.5% · 30yr
- Down + closing
- —
- Monthly P&I
- —
- Monthly cashflow
- —
- DSCR
- —
- Eligible?
- —
No personal income docs; deal must DSCR.
Hard money
10% down · 12.0% · 12mo
- Down + closing
- —
- Monthly P&I
- —
- Monthly cashflow
- —
- DSCR
- —
- Eligible?
- —
Short-term bridge; refi at stabilization.
Listing history 24 events
-
2026-06-19days on market $45,000 Active 109 DOM
-
2026-06-18days on market $45,000 Active 108 DOM
-
2026-06-17days on market $45,000 Active 107 DOM
-
2026-06-16days on market $45,000 Active 106 DOM
-
2026-06-15days on market $45,000 Active 105 DOM
-
2026-06-14days on market $45,000 Active 103 DOM
-
2026-06-13days on market $45,000 Active 102 DOM
-
2026-06-10days on market $45,000 Active 100 DOM
-
2026-06-09days on market $45,000 Active 99 DOM
-
2026-06-08days on market $45,000 Active 98 DOM
-
2026-06-07days on market $45,000 Active 97 DOM
-
2026-06-03days on market $45,000 Active 93 DOM
-
2026-06-02days on market $45,000 Active 92 DOM
-
2026-06-01days on market $45,000 Active 91 DOM
-
2026-05-31days on market $45,000 Active 90 DOM
-
2026-05-30days on market $45,000 Active 89 DOM
-
2026-05-22status Active
-
2026-04-10historical Active Under Contract
-
2026-03-02$45,000 Active
-
2026-02-28historical
-
2025-12-23$45,000 Active
-
2025-12-19historical
-
2025-10-19price $60,000
-
2025-09-26$70,000 Active
ⓘ Source: listings_history table (triggers on properties + properties_extension) + one-shot
backfill from property_details.listing_events for pre-trigger history.
Climate risk First Street
- Flood 1/10 Low FEMA zone X (unshaded) · 0% chance over 30 yrs
- Wildfire 1/10 Low
- Heat 3/10 Moderate 7 d/yr ≥94°F today · 17 d/yr by 30 yrs out
- Wind 1/10 Low
- Air quality 2/10 Low 0 unhealthy d/yr today · 2 by 30 yrs out
Nearby sold comps map
Loading sold comps map…
Walkable amenities ~0.75 mi
Loading nearby amenities…
Taxation est. · year 1
- Rental income
- $19,409
- − Mortgage interest
- −$2,521
- − Property taxes
- −$675
- − Insurance
- −$225
- − Repairs & maintenance
- −$1,553
- − Management
- −$1,553
- − Depreciation
- −$1,309
- Taxable income
- $11,574
- Est. tax owed @ 24.0%
- −$2,778
- After-tax cash flow
- $8,824/yr
For passive investors: Depreciation is non-cash, so a rental often shows a tax loss while cash-flowing — sheltering income. Rental losses are passive: they offset passive income freely, and up to $25,000/yr can offset ordinary (W-2) income if you actively participate and your MAGI is under $100k (phasing out to $0 by $150k); unused losses carry forward. On sale, claimed depreciation is recaptured at up to 25%, and gains may owe capital-gains tax (a 1031 exchange can defer both). Figures are a year-1 estimate at your 24.0% rate — not tax advice; consult a CPA.
Schools (NCES district)
- District
- Westmoreland Central School District
- NCES district ID
- 3631050
- Math proficiency
- 61% ▼ -1.00%
- Reading proficiency
- 68% ▲ 7.00%
- Median HH income
- $64,671
- Composite
- 56.19/100
- National rank
- #1176
- State rank
- #173 of 590 in NY
Livability — Rome
- Score
- 64/100
- State rank
- #722
- US rank
- #13676
Category grades
Schools grade is shown separately in the Schools card above.
Census & demographics
- City population
- 41,418
- Population (ZIP)
- 41,273
Population outlook (Oneida County) Hauer SSP2
- Today (2025)
- 225,223 people
- By 2030
- 220,384 · -2.1%
- By 2040
- 209,071 · -7.2%
- By 2050
- 197,920 · -12.1%
- By 2075
- 175,541 · -22.1%
- By 2100
- 148,491 · -34.1%
Race, ethnicity, and origin ACS 2023
- Neighborhood character
- Predominantly White (82%)
- Race & ethnicity
- White 82% Hispanic / Latino 7% Two or more races 6% Black 4% Asian 1%
- Hispanic origin (detail)
- Mexican 1% Puerto Rican 4%
- Common ancestry
- Romanian 9% Lithuanian 4% Slovak 1%
- Foreign-born
- 3% · Canada, China
- Languages at home
- 94% English-only · Spanish 3% Other Indo-European 1%
Political lean MEDSL · Oneida
- 2024 margin
- Strong R (+21.3) · D 39.4% · R 60.6%
- 2008→2024 swing
- -15.2pp toward R · 2008: -6.1pp · 2024: -21.3pp
- All cycles
- 2024: R+21.3 2020: R+15.5 2016: R+21.1 2012: R+5.3 2008: R+6.1
Not yet ingested
- Civics
- —
Market trends
- HPI YoY
- ▼ -29.58%
- Current HPI
- 339.3589
- Rent YoY
- —
- Metro
- —
- State GDP YoY
- ▲ 2.60%
- F500 in state
- 92
Industry mix (Fortune 500 HQ in NY)
| Industry | F500 HQs | Revenue |
|---|---|---|
| Financial Services | 10 | $950B |
|
||
| Consumer Goods | 9 | $162B |
|
||
| Insurance | 4 | $225B |
|
||
| Telecommunications | 2 | $144B |
|
||
| Pharmaceuticals | 2 | $112B |
|
||
| Media / Entertainment | 2 | $69B |
|
||
Price history
-35.7% since first listed8 events — show timeline
- 2026-05-22 Relisted — CNYIS
- 2026-04-10 Contingent — CNYIS
- 2026-03-02 Listed $45,000 CNYIS
- 2026-02-28 Listing Removed — CNYIS
- 2025-12-23 Listed $45,000 CNYIS
- 2025-12-19 Listing Removed — CNYIS
- 2025-10-19 Price Changed $60,000 CNYIS
- 2025-09-26 Listed $70,000 CNYIS
Cash-flow waterfall
monthlySold comps — $/sqft
last 12 mo · ≤1 miLoading sold comps…