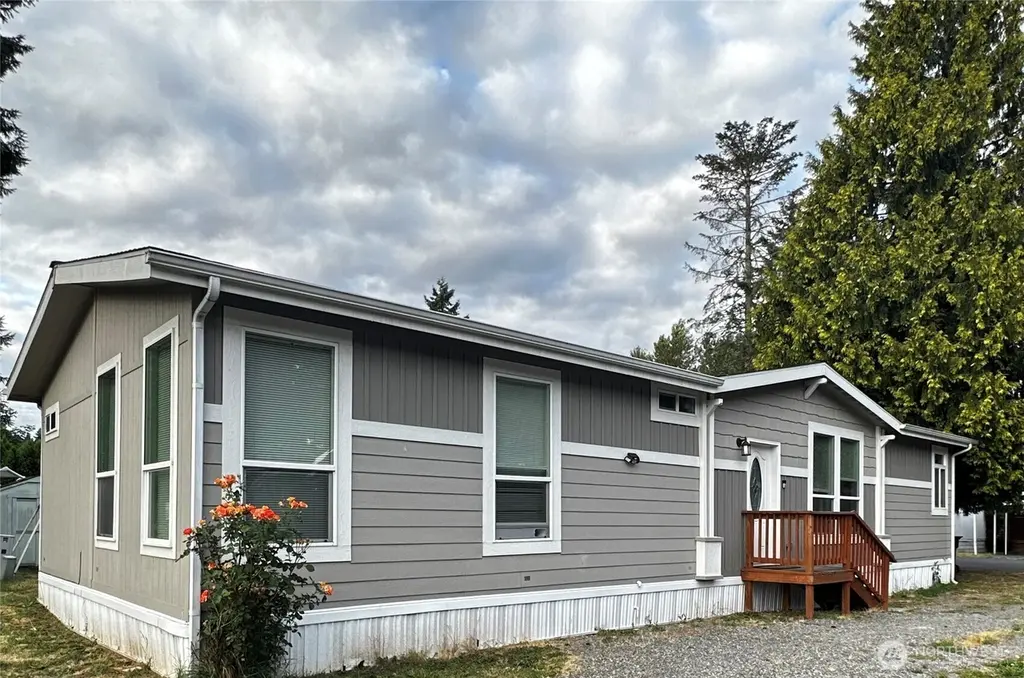
1720 Maple Ln #33 · Kent, WA
Flood risk 5/10 · Moderate
- FEMA flood zone
- X
- Chance of flooding over 30 yrs
- 0.24%
- Est. flood insurance / yr
- $507 – $1,088
Fire risk 1/10 · Minimal
- Est. fire insurance / yr
- $604 – $1,122
Heat risk 3/10 · Minor
- Hot days now (above 88°F)
- 7 days/yr
- Hot days in 30 yrs
- 15 days/yr
Wind risk 1/10 · Minimal
- Chance of severe wind over 30 yrs
- —
Air-quality risk 8/10 · Major
- Unhealthy air days now
- 12 days/yr
- Unhealthy air days in 30 yrs
- 12 days/yr
Risk factors via First Street. Map © Google.
Why this score? — see what drove the C grade
The composite is a weighted blend of 9 inputs, each scored 0–100. Each bar is that input's sub-score; the figure is the points it added to the 100-point composite (weight × sub-score).
- Cash flow +25.3/30.0
- DSCR +8.3/10.0
- 1% rule +6.6/10.0
- Schools +4.8/10.0
- Livability +4.0/5.0
- Condition / age +3.8/5.0
- Rent growth +3.4/5.0
- ARV discount +0.0/15.0
- Appreciation +0.0/10.0
$193,000
🖨 Deal sheet (PDF) 📄 Offer letter ✓ Due diligence
Listing remarks
Bright and Spacious Marlette Home in All-Ages Community! Welcome to this well-maintained 3-bedroom, 2-bath home located in the desirable Maple Lane community. Enjoy the convenience of keyless entry! Offering 1,440 sq ft of open living space, this home features a large living room, formal dining area, and a kitchen with a pantry, black appliances, and a stylish tile backsplash. The spacious primary suite includes a private bath and walk-in closet. Relax on the covered porch and appreciate the beautifully landscaped lot. This home has spacious parking which can accommodate for 6 vehicles! Conveniently located near the freeway and local amenities—this home combines comfort, style, and l
Key facts
- Black appliances
- Large living room
- Open living space
Tags
Neighborhood map
What this means for you Summary
Snapshot
- This is a 3-bed/2.0-bath manufactured listed at $193k. Condition is rated good.
Deal economics
- At list price, monthly cash flow is $439 ($5k/yr) — positive.
- The deal already cash-flows at list — no discount required.
- Meets the 1% rule at list price ($2k rent vs $193k).
- Recommended offer: $170k (12.0% below list) — sets the bar for market timing.
- Cap rate 9.0% vs local median 2.6% in Kent — top-decile yield for the area; either an underpriced asset or a hidden risk that comps aren't pricing in. Stress-test before assuming the spread holds.
Location & tenants
- Location reads 79/100 on livability (#109 in WA, #2,154 nationally) — a middle-class / working-renter tenant base. Strengths: amenities A+, commute A+, housing A+; Watch: crime F, cost of living F.
- Kent School District (urban): math 47% / reading 57% proficiency, ranked #109 of 291 in WA (top 38%) — acceptable for families but not a draw, mixed tenant base, ~2y average lease.
- Zoned schools: Scenic Hill Elementary School (559 students, 78% FRL); Mill Creek Middle School (794 students, 83% FRL); Kent-Meridian High School (2,128 students, 77% FRL) — zoned schools average 79% FRL vs 41% district-wide (39 pts higher); higher-poverty schools than district average — tighter screening recommended.
- Market conditions: Rents rising (+3.5%/yr); 169 active listings in the ZIP; 27 comparable units currently listed for rent nearby; rentals leasing fast (median 7d on market — plan ~1-2 weeks tenant-placement turnaround); solid renter incomes; 10,555 units permitted in King County in 2024 (7,119 in 5+ unit buildings).
Forward outlook
- Local home prices are declining (-3.0%/yr); year-one equity from $1k of loan paydown is wiped out by about $6k of value loss. Plan a longer hold.
- King County population projected at +44% by 2050 — long-run rental-demand tailwind backs the buy-and-hold thesis.
Negotiation context
- It's been on market 349 days — a 12% lower offer ($170k) is reasonable based on typical stale-listing flexibility.
- 3 sale attempts since 6y ago with the ask held roughly flat each time — persistent listings suggest the price (not the market) is what's stuck; bring a comps-based counter.
- Current owner paid $135k; 43% above their basis — modest negotiation headroom, anchor on the comps not their cost.
Risks & watch-outs
- Climate carrying-cost: moderate flood risk — expect insurance premiums to compound above CPI over the hold.
Questions for the listing agent
- It's been on market 349 days. Have you received any prior offers? Is the seller open to a 12% concession, seller financing, or rate buy-down credit?
- Why hasn't it sold? Are there any deal-killer items the seller is aware of (foundation, flood, title, zoning, code violations)?
- Is there a deadline driving the sale (1031 exchange, divorce, estate, relocation)? That informs how much negotiation room exists.
- Crime grade is F in this area — have there been break-ins, vandalism, or insurance claims at this property in the last 3 years? What carrier currently insures it and at what premium?
- What's the average days-on-market for RENTAL listings here right now (not sales)? A rising rental-DOM trend means longer vacancies and softer asking-rent achievability than the comps imply.
- What's the recent tenant-quality profile in this submarket — average credit score on applications, eviction rate, late-payment / NSF rate, and stable-employment percentage? A property-management company in the area should have these aggregated.
- How much new for-sale + rental construction is in the pipeline within 1–3 miles? Heavy new supply typically softens prices + rents 12–24 months out; constrained supply supports both.
Investment metrics
- 1% rule
- 1.16% ✓
- Cap rate
- 9.02%
- Cash-on-cash
- 9.75%
- DSCR
- 1.43
- GRM
- 7.2
CMA / ARV
- ARV (median comp)
- $133,877
- List price
- $193,000
- Delta
- 44.16%
- Verdict
- OVERPRICED
- Comps
- 2 within 1.0 mi
Show comp detail 1 sale within ~0.75 mi
| Address | Dist | Beds/Ba | Sqft | Sold | Price | $/sf | Match |
|---|---|---|---|---|---|---|---|
| 1540 Maple Ln #35 | 0.11mi | 3/2.0 | 1,400 (-3%) | 7mo | $165,000 | $118 | 84 |
Match score weights: distance 35% · size 25% · config 20% · recency 20%. Top-matched comps best support the ARV.
Projected returns pro-forma
-3.0% appreciation · 3.53% rent growth · sell at horizon
- IRR
- -1.0%
- Equity multiple
- 0.96×
- Total profit
- $-2,059
- Equity at exit
- $28,777
- IRR
- 9.2%
- Equity multiple
- 1.73×
- Total profit
- $39,361
- Equity at exit
- $16,687
Cash invested: $54,040 (down + closing). Projections, not guarantees.
Landlord ↔ Tenant lean methodology
- Overall (STATE)
- 28 Tenant-Leaning
- State Washington
- 28 Tenant-Leaning · D+8
- County
- — inherits STATE
- City
- — inherits STATE
ZIP-level market 98031
- Rents YoY
- 3.5%
- Active inventory
- 169
- Price-to-rent
- 7.2×
Monthly cashflow live
- Estimated rent
- $2,244 high interval (Pro) →
- Mortgage (P&I)
- −$1,012
- Tax est. 1.5%
- −$241 /mo · $2,895/yr
- Insurance
- −$80
- HOA
- −$0
- Vacancy / Maint / Mgmt
- −$471
- Net cashflow
- $439
Break-even live
Sensitivity live
| Price | -10% $573 | -5% $506 | +0% $439 | +5% $373 | +10% $306 |
|---|---|---|---|---|---|
| Rent | -10% $262 | -5% $351 | +0% $439 | +5% $528 | +10% $617 |
| Rate | -1.0pp $536 | -0.5pp $488 | base $439 | +0.5pp $389 | +1.0pp $338 |
UW: 25.0% down · 7.5% · 30yr · 1.5% tax · 5.0% vac · 8.0% maint · 8.0% mgmt
Financing live
Cash to close
- Down payment
- $48,250
- Closing costs
- $5,790
- Reserves months
- —
- Total cash needed
- —
Loan-product check · same deal, 3 products live
Conventional
25% down · 7.5% · 30yr
- Down + closing
- —
- Monthly P&I
- —
- Monthly cashflow
- —
- DSCR
- —
- Eligible?
- —
Personal DTI + credit; lowest rate.
DSCR
20% down · 8.5% · 30yr
- Down + closing
- —
- Monthly P&I
- —
- Monthly cashflow
- —
- DSCR
- —
- Eligible?
- —
No personal income docs; deal must DSCR.
Hard money
10% down · 12.0% · 12mo
- Down + closing
- —
- Monthly P&I
- —
- Monthly cashflow
- —
- DSCR
- —
- Eligible?
- —
Short-term bridge; refi at stabilization.
Rent comps 27 comps
| Address | Beds | Baths | Sqft | Rent | $/sqft | DOM | Units | Dist |
|---|---|---|---|---|---|---|---|---|
| 1605 Maple Ln Apt 2 Kent, WA | 2.0 | 1.0 | 930 | $1,700 | $1.83 | 0d | 1 | 0.11mi |
| 1406 Maple Ln Kent, WA | 2.0–4.0 | 1.0–2.0 | 916 | $1,631 | $1.78 | 0d | 2 | 0.20mi |
| 724 2nd Ave S Kent, WA | 2.0 | 1.0 | 875 | $1,699 | $1.94 | 45d | 1 | 0.80mi |
| 1220 E Laurel St Kent, WA | 3.0 | 2.0 | 1580 | $2,995 | $1.90 | 14d | 1 | 0.85mi |
| 713 3rd Ave S Kent, WA | 3.0 | 2.5 | 1350 | $2,795 | $2.07 | 45d | 1 | 0.87mi |
| 702 5th Ave S Kent, WA | 2.0–3.0 | 1.5 | 1150 | $2,400 | $2.09 | 6d | 3 | 0.92mi |
| 702 5th Ave S Unit T06 Kent, WA | 2.0 | 1.5 | 975 | $2,200 | $2.26 | 0d | 1 | 0.93mi |
| 707 6th Ave S Unit F103 Kent, WA | 2.0 | 1.5 | 979 | $1,700 | $1.74 | 45d | 1 | 0.96mi |
| 4750 Auburn Way N Auburn, WA | 1.0–4.0 | 1.0–2.0 | 1011 | $2,417 | $2.39 | 0d | 10 | 1.00mi |
| 622 6th Ave S Kent, WA | 3.0 | 2.0 | 1114 | $2,999 | $2.69 | 45d | 1 | 1.02mi |
| 25426 98th Ave S Kent, WA | 3.0 | 1.0 | 690 | $2,576 | $3.73 | 6d | 18 | 1.03mi |
| 1462 51st Pl NE Auburn, WA | 3.0 | 2.5 | 1539 | $2,900 | $1.88 | 4d | 1 | 1.05mi |
| 9626 S 252nd St Kent, WA | 2.0 | 1.0 | 880 | $1,675 | $1.90 | 4d | 4 | 1.15mi |
| 802 45th St NE Auburn, WA | 1.0–3.0 | 1.0–2.0 | 934 | $2,499 | $2.68 | 1d | 11 | 1.18mi |
| 25035 98th Pl S Kent, WA | 2.0 | 1.0 | 900 | $2,200 | $2.44 | 45d | 1 | 1.22mi |
| 106 Kensington Ave S #102 Kent, WA | 3.0 | 1.0 | 881 | $1,650 | $1.87 | 26d | 1 | 1.23mi |
| 106 Kensington Ave S Unit 104 Kent, WA | 3.0 | 1.0 | 881 | $1,650 | $1.87 | 0d | 1 | 1.23mi |
| 1254 Weiland St Kent, WA | 2.0 | 1.0 | 974 | $1,550 | $1.59 | 45d | 1 | 1.23mi |
| 24802 99th Pl S Kent, WA | 1.0–2.0 | 1.0–2.0 | 817 | $2,409 | $2.95 | 0d | 9 | 1.36mi |
| 420 W Smith St Kent, WA | 2.0 | 1.0–2.0 | 704 | $2,321 | $3.30 | 0d | 6 | 1.36mi |
| 10433 SE Kent Kangley Rd Kent, WA | 1.0–2.0 | 1.0–2.0 | 776 | $1,845 | $2.38 | 6d | 7 | 1.39mi |
| 24808 100th Pl SE Kent, WA | 1.0–3.0 | 1.0–2.0 | 880 | $2,460 | $2.80 | 0d | 14 | 1.41mi |
| 102 Madison Ave N Kent, WA | 2.0 | 1.0–2.0 | 774 | $2,925 | $3.78 | 0d | 23 | 1.43mi |
| 24928 103rd Ave SE Apt D302 Kent, WA | 2.0 | 2.0 | 886 | $2,095 | $2.36 | 23d | 1 | 1.44mi |
| 443 Ramsay Way Kent, WA | 1.0–2.0 | 1.0–2.0 | 726 | $2,299 | $3.17 | 0d | 14 | 1.48mi |
| 10215 SE 248th St Kent, WA | 2.0–3.0 | 2.0 | 1240 | $2,895 | $2.33 | 45d | 3 | 1.50mi |
| 10215 SE 248th St Kent, WA | 3.0 | 2.0 | 1250 | $2,895 | $2.32 | 22d | 1 | 1.50mi |
Listing history 21 events
-
2026-06-21days on market $193,000 Active 349 DOM
-
2026-06-18days on market $193,000 Active 346 DOM
-
2026-06-17days on market $193,000 Active 345 DOM
-
2026-06-16days on market $193,000 Active 344 DOM
-
2026-06-15days on market $193,000 Active 343 DOM
-
2026-06-13days on market $193,000 Active 341 DOM
-
2026-06-09days on market $193,000 Active 337 DOM
-
2026-06-08days on market $193,000 Active 336 DOM
-
2026-06-07days on market $193,000 Active 335 DOM
-
2026-06-04days on market $193,000 Active 332 DOM
-
2026-06-03days on market $193,000 Active 331 DOM
-
2026-06-02days on market $193,000 Active 330 DOM
-
2026-06-01days on market $193,000 Active 329 DOM
-
2026-05-31days on market $193,000 Active 328 DOM
-
2025-07-07$193,000 Active
-
2021-04-07soldstatus $134,900 Sold
-
2021-01-27status Pending
-
2021-01-21price $134,900
-
2021-01-16status Active
-
2020-10-27status Pending
-
2020-07-22$139,900 Active
ⓘ Source: listings_history table (triggers on properties + properties_extension) + one-shot
backfill from property_details.listing_events for pre-trigger history.
Climate risk First Street
- Flood 5/10 Major FEMA zone X · 24% chance over 30 yrs
- Wildfire 1/10 Low
- Heat 3/10 Moderate 7 d/yr ≥88°F today · 15 d/yr by 30 yrs out
- Wind 1/10 Low
- Air quality 8/10 Severe 12 unhealthy d/yr today · 12 by 30 yrs out
Nearby sold comps map
Loading sold comps map…
Walkable amenities ~0.75 mi
Loading nearby amenities…
Taxation est. · year 1
- Rental income
- $26,933
- − Mortgage interest
- −$10,811
- − Property taxes
- −$2,895
- − Insurance
- −$965
- − Repairs & maintenance
- −$2,155
- − Management
- −$2,155
- − Depreciation
- −$5,615
- Taxable income
- $2,338
- Est. tax owed @ 24.0%
- −$561
- After-tax cash flow
- $4,710/yr
For passive investors: Depreciation is non-cash, so a rental often shows a tax loss while cash-flowing — sheltering income. Rental losses are passive: they offset passive income freely, and up to $25,000/yr can offset ordinary (W-2) income if you actively participate and your MAGI is under $100k (phasing out to $0 by $150k); unused losses carry forward. On sale, claimed depreciation is recaptured at up to 25%, and gains may owe capital-gains tax (a 1031 exchange can defer both). Figures are a year-1 estimate at your 24.0% rate — not tax advice; consult a CPA.
Condition & rehab AI · 12 photos
This well-maintained 3-bedroom, 2-bath home in the Maple Lane community is ready for move-in with minor cosmetic updates to enhance curb appeal and value.
Value-add opportunities
- Both Paint exterior trim — Enhances curb appeal and value
- Both Clean gutters — Improves drainage and adds to overall home maintenance
Renovation cost estimate screening
Value-add ROI direction
- Both Paint exterior trim — Enhances curb appeal and value ↑
- Both Clean gutters — Improves drainage and adds to overall home maintenance ↑
ⓘ Cost ranges are severity-bucket heuristics (US national rule-of-thumb). Get contractor quotes + a written scope before underwriting a rehab budget.
Schools (NCES district)
- District
- Kent School District
- NCES district ID
- 5303960
- Math proficiency
- 47% ▼ -1.00%
- Reading proficiency
- 57% ▼ -1.00%
- Median HH income
- $69,823
- Composite
- 48.25/100
- National rank
- #4714
- State rank
- #109 of 291 in WA
Livability — Kent
- Score
- 79/100
- State rank
- #109
- US rank
- #2154
Category grades
Schools grade is shown separately in the Schools card above.
Census & demographics
- Census place
- Kent, WA
- County
- King County · 2,251,916 people
- City population
- 119,479
- Metro
- Seattle-Tacoma-Bellevue, WA
- Population (ZIP)
- 40,094
- Household income
- $105,965
- Rent vs Own
- Severe rent burden
- 1151.0
Population outlook (King County) Hauer SSP2
- Today (2025)
- 2,576,485 people
- By 2030
- 2,803,316 · +8.8%
- By 2040
- 3,255,921 · +26.4%
- By 2050
- 3,706,444 · +43.9%
- By 2075
- 4,746,063 · +84.2%
- By 2100
- 5,407,730 · +109.9%
Race, ethnicity, and origin ACS 2023
- Neighborhood character
- Highly diverse neighborhood (Simpson 0.77)
- Race & ethnicity
- White 36% Asian 27% Black 13% Hispanic / Latino 13% Two or more races 13% Pacific Islander 1%
- Hispanic origin (detail)
- Mexican 9%
- Common ancestry
- Italian 5% Portuguese 2% Subsaharan African 2%
- Foreign-born
- 31% · Canada, Vietnam, China
- Languages at home
- 58% English-only · Spanish 9% Other Indo-European 7% Vietnamese 4%
Political lean MEDSL · King
- 2024 margin
- Solid D (+51.7) · D 74.2% · R 22.5% · Other 3.4%
- 2008→2024 swing
- +9.6pp toward D · 2008: 42.1pp · 2024: 51.7pp
- All cycles
- 2024: D+51.7 2020: D+52.7 2016: D+50.4 2012: D+39.9 2008: D+42.1
Not yet ingested
- Civics
- —
Market trends
- HPI YoY
- ▼ -673.58%
- Current HPI
- 308.1747
- Rent YoY
- ▲ 3.53%
- Metro
- Seattle-Tacoma-Bellevue, WA
- State GDP YoY
- ▲ 4.65%
- F500 in state
- 22
Industry mix (Fortune 500 HQ in WA)
| Industry | F500 HQs | Revenue |
|---|---|---|
| Retail | 2 | $269B |
|
||
| Technology / Retail | 1 | $638B |
|
||
| Technology | 1 | $245B |
|
||
| Telecommunications | 1 | $38B |
|
||
| Food / Beverage | 1 | $36B |
|
||
| Automotive / Trucks | 1 | $34B |
|
||
Price history
+38.0% since first listed7 events — show timeline
- 2025-07-07 Listed $193,000 NWMLS as Distributed by MLS Grid
- 2021-04-07 Sold (MLS) $134,900 NWMLS as Distributed by MLS Grid
- 2021-01-27 Pending — NWMLS as Distributed by MLS Grid
- 2021-01-21 Price Changed $134,900 NWMLS as Distributed by MLS Grid
- 2021-01-16 Relisted — NWMLS as Distributed by MLS Grid
- 2020-10-27 Pending — NWMLS as Distributed by MLS Grid
- 2020-07-22 Listed $139,900 NWMLS as Distributed by MLS Grid
Cash-flow waterfall
monthlySold comps — $/sqft
last 12 mo · ≤1 miLoading sold comps…