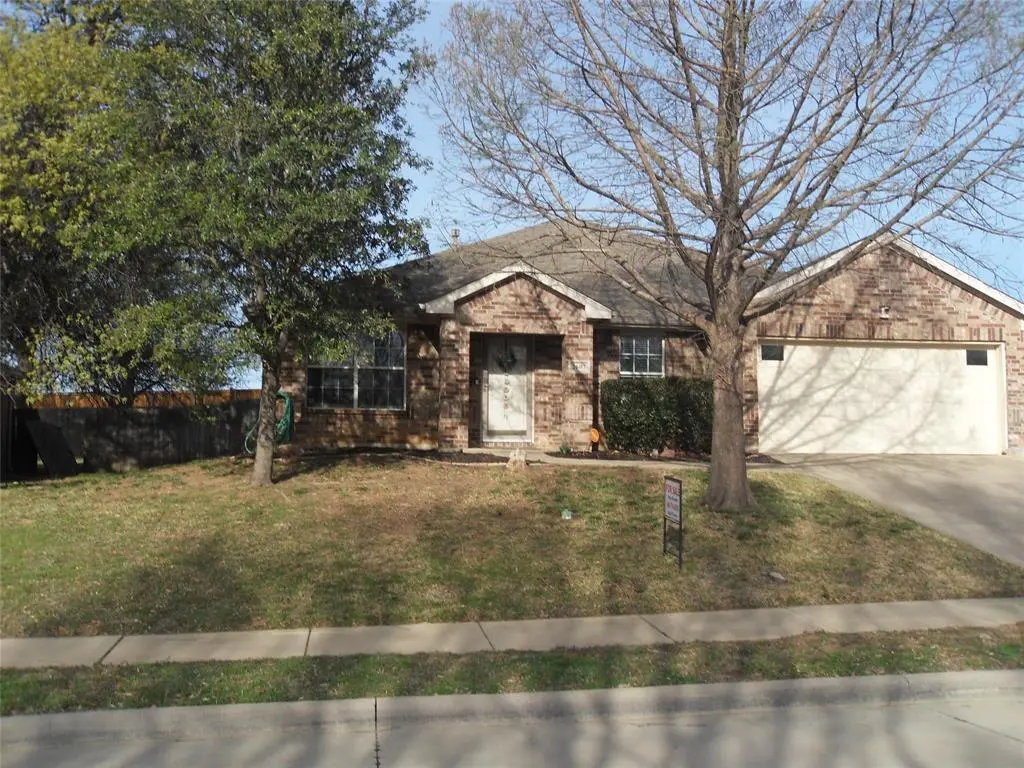
2607 Trinity Ter · Corinth, TX
Flood risk 1/10 · Minimal
- FEMA flood zone
- X (unshaded)
- Chance of flooding over 30 yrs
- 0.0%
- Est. flood insurance / yr
- $507 – $1,088
Fire risk 4/10 · Minor
- Est. fire insurance / yr
- $1,222 – $2,270
Heat risk 7/10 · Major
- Hot days now (above 109°F)
- 7 days/yr
- Hot days in 30 yrs
- 23 days/yr
Wind risk 6/10 · Moderate
- Chance of severe wind over 30 yrs
- 27.0%
Air-quality risk 4/10 · Minor
- Unhealthy air days now
- 4 days/yr
- Unhealthy air days in 30 yrs
- 5 days/yr
Risk factors via First Street. Map © Google.
Why this score? — see what drove the D- grade
The composite is a weighted blend of 9 inputs, each scored 0–100. Each bar is that input's sub-score; the figure is the points it added to the 100-point composite (weight × sub-score).
- ARV discount +15.0/15.0
- Cash flow +7.0/30.0
- Livability +4.0/5.0
- Schools +3.4/10.0
- Rent growth +2.7/5.0
- 1% rule +2.6/10.0
- Condition / age +2.5/5.0
- DSCR +1.2/10.0
- Appreciation +0.0/10.0
$335,000
🖨 Deal sheet 📄 Offer letter ✓ Due diligence
Listing remarks MLS
Well priced move in ready split bedroom single story 4 bedroom home. Spacious yet cozy Great Room with kitchen open to the living space which opens onto the covered deck overlooking the very private back yard. Kitchen features maple colored cabinets with granite countertops and newish stainless appliances. Hard surface flooring throughout except for carpet in the bedrooms. Master suite features a sitting area- great for a home office. En suite bath includes walk in closet, separate shower and soaking tub.
Key facts
- Covered deck
- Private back yard
- Granite countertops
Tags
Neighborhood map
What this means for you Summary
Snapshot
- This is a 3-bed/2.0-bath single-family listed at $335k.
Deal economics
- At list price, monthly cash flow is $-485 ($-6k/yr) — negative.
- To cash-flow at today's rent, offer at most $249k (25.6% below list).
- To meet the 1% rule (rent ≥ 1% of price), the offer needs to be $254k (24.2% below list).
- Recommended offer: $249k (25.6% below list) — sets the bar for cash-flow.
- Cap rate 4.6% vs local median 3.0% in Corinth — top-decile yield for the area; either an underpriced asset or a hidden risk that comps aren't pricing in. Stress-test before assuming the spread holds.
Location & tenants
- Location reads 79/100 on livability (#59 in TX, #2,235 nationally) — a middle-class / working-renter tenant base. Strengths: crime A+, employment A+, housing A+; Watch: amenities F, commute F.
- Lake Dallas ISD (suburban): math 34% / reading 39% proficiency, ranked #413 of 826 in TX (top 50%) — families likely to look elsewhere, expect single-tenant / working-renter base with shorter leases.
- Market conditions: Rents flat; 383 active listings in the ZIP; 40 comparable units currently listed for rent nearby; rentals leasing fast (median 13d on market — plan ~1-2 weeks tenant-placement turnaround); high-income renter base; 10,531 units permitted in Denton County in 2024 (2,713 in 5+ unit buildings).
Forward outlook
- Local home prices are declining (-3.0%/yr); year-one equity from $2k of loan paydown is wiped out by about $10k of value loss. Plan a longer hold.
- Denton County population projected at +66% by 2050 — long-run rental-demand tailwind backs the buy-and-hold thesis.
Negotiation context
- It's been on market 82 days — a 6% lower offer ($315k) is reasonable based on typical stale-listing flexibility.
- 6 sale attempts since 15y ago with the ask held roughly flat each time — persistent listings suggest the price (not the market) is what's stuck; bring a comps-based counter.
Risks & watch-outs
- Climate carrying-cost: major wind risk, 27% chance of damaging wind over 30y; extreme-heat days projected 7→23/yr by 2055 (HVAC capex compounding) — expect insurance premiums to compound above CPI over the hold.
Questions for the listing agent
- What do current leases actually rent for vs. the listed asking? Can we see a recent rent roll and the last 12 months of T-12 income?
- It's been on market 82 days. Have you received any prior offers? Is the seller open to a 26% concession, seller financing, or rate buy-down credit?
- Why hasn't it sold? Are there any deal-killer items the seller is aware of (foundation, flood, title, zoning, code violations)?
- Is there a deadline driving the sale (1031 exchange, divorce, estate, relocation)? That informs how much negotiation room exists.
- Schools are B-rated — typically a magnet for longer-tenancy family renters. What's the average tenant stay here, and is there a school-zone premium baked into asking?
- The area grade is low — what's the realistic commute time and amenity access for the typical tenant pool here? Any planned neighborhood developments (good or bad) we should know about?
- What's the average days-on-market for RENTAL listings here right now (not sales)? A rising rental-DOM trend means longer vacancies and softer asking-rent achievability than the comps imply.
- What's the recent tenant-quality profile in this submarket — average credit score on applications, eviction rate, late-payment / NSF rate, and stable-employment percentage? A property-management company in the area should have these aggregated.
- How much new for-sale + rental construction is in the pipeline within 1–3 miles? Heavy new supply typically softens prices + rents 12–24 months out; constrained supply supports both.
Investment metrics
- 1% rule
- 0.76% ✗
- Cap rate
- 4.56%
- Cash-on-cash
- -6.21%
- DSCR
- 0.72
- GRM
- 11.0
CMA / ARV
- ARV (median comp)
- $405,326
- List price
- $335,000
- Delta
- -17.35%
- Verdict
- UNDERPRICED
- Comps
- 20 within 1.0 mi
Show comp detail 12 sales within ~0.75 mi
| Address | Dist | Beds/Ba | Sqft | Sold | Price | $/sf | Match |
|---|---|---|---|---|---|---|---|
| 2840 Taylor Ln | 0.25mi | 4/2.0 (+1) | 2,016 (+0%) | 1mo | $469,890 | $233 | 82 |
| 2517 Amistad Ln | 0.33mi | 4/3.0 (+1) | 2,077 (+3%) | 2mo | $485,000 | $234 | 68 |
| 2776 Teton St | 0.32mi | 3/2.5 | 2,203 (+10%) | 1mo | $434,521 | $197 | 66 |
| 2621 Gateway Ave | 0.22mi | 3/2.5 | 2,240 (+11%) | 4mo | $385,000 | $172 | 66 |
| 2773 Kobuk Dr | 0.20mi | 3/2.5 | 2,309 (+15%) | 0mo | $439,117 | $190 | 64 |
| 3005 Mason Ave | 0.29mi | 3/2.0 | 1,736 (-14%) | 2mo | $350,000 | $202 | 62 |
| 3111 Brett Rd | 0.46mi | 3/2.0 | 1,827 (-9%) | 2mo | $364,000 | $199 | 62 |
| 2765 Kobuk Dr | 0.29mi | 3/2.5 | 2,309 (+15%) | 0mo | $418,597 | $181 | 59 |
| 2914 Custer Dr | 0.45mi | 3/2.0 | 1,789 (-11%) | 2mo | $359,900 | $201 | 59 |
| 2810 N Haven Dr | 0.61mi | 4/2.0 (+1) | 1,920 (-4%) | 1mo | $400,000 | $208 | 59 |
| 2516 Acadia Dr | 0.21mi | 4/3.0 (+1) | 2,293 (+14%) | 0mo | $450,000 | $196 | 57 |
| 2302 Chambray Dr | 0.73mi | 3/2.0 | 2,183 (+9%) | 1mo | $425,000 | $195 | 51 |
Match score weights: distance 35% · size 25% · config 20% · recency 20%. Top-matched comps best support the ARV.
Projected returns pro-forma
-3.0% appreciation · 0.82% rent growth · sell at horizon
- IRR
- -29.6%
- Equity multiple
- 0.04×
- Total profit
- $-90,490
- Equity at exit
- $49,950
- IRR
- -44.0%
- Equity multiple
- -0.49×
- Total profit
- $-139,410
- Equity at exit
- $28,965
Cash invested: $93,800 (down + closing). Projections, not guarantees.
Landlord ↔ Tenant lean methodology
- Overall (STATE)
- 87 Strongly Landlord-Friendly
- State Texas
- 87 Strongly Landlord-Friendly · R+5
- County
- — inherits STATE
- City
- — inherits STATE
ZIP-level market 76210
- Home prices YoY
- -14.4%
- Rents YoY
- 0.8%
- Active inventory
- 383
- Price-to-rent
- 11.0×
Monthly cashflow live
- Estimated rent
- $2,541 high interval (Pro) →
- Mortgage (P&I)
- −$1,757
- Tax from tax record
- −$596 /mo · $7,152/yr
- Insurance
- −$140
- HOA
- −$0
- Vacancy / Maint / Mgmt
- −$534
- Net cashflow
- $-485
Break-even live
UW: 25.0% down · 7.5% · 30yr · 1.5% tax · 5.0% vac · 8.0% maint · 8.0% mgmt
Financing live
Cash to close
- Down payment
- $83,750
- Closing costs
- $10,050
- Reserves months
- —
- Total cash needed
- —
Loan-product check · same deal, 3 products live
Conventional
25% down · 7.5% · 30yr
- Down + closing
- —
- Monthly P&I
- —
- Monthly cashflow
- —
- DSCR
- —
- Eligible?
- —
Personal DTI + credit; lowest rate.
DSCR
20% down · 8.5% · 30yr
- Down + closing
- —
- Monthly P&I
- —
- Monthly cashflow
- —
- DSCR
- —
- Eligible?
- —
No personal income docs; deal must DSCR.
Hard money
10% down · 12.0% · 12mo
- Down + closing
- —
- Monthly P&I
- —
- Monthly cashflow
- —
- DSCR
- —
- Eligible?
- —
Short-term bridge; refi at stabilization.
Rent comps 40 comps
| Address | Beds | Baths | Sqft | Rent | $/sqft | DOM | Units | Dist |
|---|---|---|---|---|---|---|---|---|
| 2653 Acadia Dr Denton, TX | 4.0 | 3.0 | 2464 | $2,799 | $1.14 | 43d | 1 | 0.11mi |
| 2653 Acadia Dr Denton, TX | 4.0 | 3.0 | 2919 | $2,650 | $0.91 | 3d | 1 | 0.11mi |
| 2653 Acadia Dr Denton, TX | 4.0 | 3.0 | 2464 | $2,650 | $1.08 | 2d | 1 | 0.11mi |
| 2612 Gateway Ave Denton, TX | 4.0 | 3.0 | 2464 | $2,995 | $1.22 | 20d | 1 | 0.17mi |
| 2653 Kings Canyon Mews Denton, TX | 4.0 | 3.0 | 2476 | $2,800 | $1.13 | 11d | 1 | 0.19mi |
| 2600 Brandi Ln Corinth, TX | 4.0 | 2.5 | 1889 | $2,700 | $1.43 | 43d | 1 | 0.26mi |
| 2701 Clark Dr Corinth, TX | 4.0 | 2.5 | 2837 | $2,495 | $0.88 | 43d | 1 | 0.29mi |
| 2817 Goodnight Trl Corinth, TX | 4.0 | 2.5 | 2348 | $2,450 | $1.04 | 7d | 1 | 0.34mi |
| 3004 Norwich Ln Corinth, TX | 3.0 | 2.0 | 1546 | $2,300 | $1.49 | 18d | 1 | 0.34mi |
| 2709 Cherokee Trl Corinth, TX | 3.0 | 2.0 | 1739 | $2,225 | $1.28 | 11d | 1 | 0.36mi |
| 2805 Whetstone Dr Corinth, TX | 3.0 | 2.0 | 1739 | $7,950 | $4.57 | 1d | 1 | 0.36mi |
| 2611 Boulder Dr Corinth, TX | 3.0 | 2.0 | 1575 | $2,495 | $1.58 | 43d | 1 | 0.41mi |
| 2106 Millwood Dr Corinth, TX | 4.0 | 3.0 | 2989 | $2,800 | $0.94 | 12d | 1 | 0.43mi |
| 2911 Custer Dr Corinth, TX | 4.0 | 2.0 | 1889 | $2,500 | $1.32 | 43d | 1 | 0.44mi |
| 2606 Whetstone Dr Corinth, TX | 4.0 | 2.0 | 1889 | $2,350 | $1.24 | 43d | 1 | 0.45mi |
| 2710 Stone Creek Ln Corinth, TX | 3.0 | 2.0 | 1574 | $2,525 | $1.60 | 3d | 1 | 0.47mi |
| 2710 Stone Creek Ln Corinth, TX | 3.0 | 2.0 | 1574 | $2,525 | $1.60 | 12d | 1 | 0.47mi |
| 2202 Barton Springs Dr Corinth, TX | 3.0 | 2.5 | 1882 | $2,250 | $1.20 | 18d | 1 | 0.50mi |
| 2201 Driskell Ln Denton, TX | 4.0 | 2.5 | 2331 | $2,650 | $1.14 | 18d | 1 | 0.53mi |
| 2417 Graystone Ln Corinth, TX | 3.0 | 2.0 | 1506 | $2,125 | $1.41 | 17d | 1 | 0.55mi |
| 3421 Buster Way Denton, TX | 3.0 | 2.0 | 1573 | $2,295 | $1.46 | 24d | 1 | 0.69mi |
| 3421 Buster Way Denton, TX | 3.0 | 2.0 | 1573 | $2,295 | $1.46 | 7d | 1 | 0.69mi |
| 3251 Lake Sharon Dr Corinth, TX | 3.0 | 1.0–2.5 | 1153 | $2,928 | $2.54 | 1d | 111 | 0.69mi |
| 2402 Blue Holly Dr Corinth, TX | 4.0 | 2.0 | 1984 | $9,750 | $4.91 | 22d | 1 | 0.79mi |
| 1703 Ash Ln Corinth, TX | 4.0 | 2.0 | 1678 | $2,199 | $1.31 | 43d | 1 | 0.86mi |
| 2614 Timberview Cir Corinth, TX | 3.0 | 2.0 | 1442 | $2,200 | $1.53 | 43d | 1 | 0.86mi |
| 1707 Falcon Dr Corinth, TX | 4.0 | 2.0 | 2188 | $2,495 | $1.14 | 43d | 1 | 0.88mi |
| 1709 Copper Leaf Dr Corinth, TX | 3.0 | 2.0 | 1893 | $2,400 | $1.27 | 6d | 1 | 0.92mi |
| 1630 Cedar Elm Dr Corinth, TX | 3.0 | 2.0 | 1558 | $2,400 | $1.54 | 7d | 1 | 0.98mi |
| 1502 Nightingale Ln Corinth, TX | 4.0 | 3.0 | 2714 | $2,495 | $0.92 | 43d | 1 | 1.07mi |
| 3351 Walton Dr Corinth, TX | 1.0–2.0 | 1.0–2.0 | 1103 | $2,195 | $1.99 | 3d | 28 | 1.09mi |
| 3451 Farm to Market Road 2181 Corinth, TX | 1.0–3.0 | 1.0–2.5 | 1045 | $2,690 | $2.57 | 7d | 44 | 1.10mi |
| 3103 Palos Verdes Dr Corinth, TX | 3.0 | 2.0 | 1770 | $2,100 | $1.19 | 12d | 1 | 1.14mi |
| 1549 Pirene Aly Denton, TX | 4.0 | 3.5 | 2957 | $3,298 | $1.12 | 1d | 1 | 1.17mi |
| 123 Derby Ln Lake Dallas, TX | 4.0 | 3.0 | 2535 | $2,900 | $1.14 | 7d | 1 | 1.21mi |
| 3512 Riverview Dr Corinth, TX | 3.0 | 2.0 | 1560 | $2,245 | $1.44 | 7d | 1 | 1.21mi |
| 3512 Riverview Dr Corinth, TX | 3.0 | 2.0 | 1560 | $2,245 | $1.44 | 24d | 1 | 1.21mi |
| 1537 Euclid Aly Denton, TX | 4.0 | 3.0 | 2495 | $2,900 | $1.16 | 2d | 1 | 1.21mi |
| 3500 FM 2181 Hickory Creek, TX | 1.0–3.0 | 1.0–2.0 | 1072 | $3,092 | $2.88 | 2d | 33 | 1.28mi |
| 3125 Bennett DR Corinth, TX | 3.0–4.0 | 2.5 | 1626 | $2,594 | $1.60 | 1d | 10 | 1.29mi |
Listing history 33 events
-
2026-06-18days on market $335,000 Active 82 DOM
-
2026-06-17days on market $335,000 Active 81 DOM
-
2026-06-16days on market $335,000 Active 80 DOM
-
2026-06-15days on market $335,000 Active 79 DOM
-
2026-06-13days on market $335,000 Active 77 DOM
-
2026-06-09days on market $335,000 Active 73 DOM
-
2026-06-08days on market $335,000 Active 72 DOM
-
2026-06-07days on market $335,000 Active 71 DOM
-
2026-06-04days on market $335,000 Active 68 DOM
-
2026-06-03days on market $335,000 Active 67 DOM
-
2026-06-02days on market $335,000 Active 66 DOM
-
2026-06-01days on market $335,000 Active 65 DOM
-
2026-05-31days on market $335,000 Active 64 DOM
-
2026-03-28$335,000 Active 515-char remark
Show marketing remark (515 chars)
Well priced move in ready split bedroom single story 4 bedroom home. Spacious yet cozy Great Room with kitchen open to the living space which opens onto the covered deck overlooking the very private back yard. Kitchen features maple colored cabinets with granite countertops and newish stainless appliances. Hard surface flooring throughout except for carpet in the bedrooms. Master suite features a sitting area- great for a home office. En suite bath includes walk in closet, separate shower and soaking tub.
-
2026-03-28historical
Show marketing remark (515 chars)
Well priced move in ready split bedroom single story 4 bedroom home. Spacious yet cozy Great Room with kitchen open to the living space which opens onto the covered deck overlooking the very private back yard. Kitchen features maple colored cabinets with granite countertops and newish stainless appliances. Hard surface flooring throughout except for carpet in the bedrooms. Master suite features a sitting area- great for a home office. En suite bath includes walk in closet, separate shower and soaking tub.
-
2026-03-17price $335,000
-
2026-01-22price $350,000
-
2025-12-16$361,000 Active
-
2019-10-25soldstatus
-
2019-10-24soldstatus Sold
-
2019-10-01status Pending
-
2019-09-25historical Active Option Contract
-
2019-09-20$254,900 Active
-
2013-08-02soldstatus Closed
-
2013-08-02soldstatus
-
2013-07-06status Pending
-
2013-07-01historical Active Option Contract
-
2013-06-24$170,000 Active
-
2012-02-02historical
-
2011-08-01$156,900 Active
-
2011-06-23historical
-
2011-06-05price $156,900
-
2011-03-01$159,900 Active
ⓘ Source: listings_history table (triggers on properties + properties_extension) + one-shot
backfill from property_details.listing_events for pre-trigger history.
Tax reassessment forecast TX · Resets to sale price
- Current annual tax
- $7,152 · $596/mo
- Projected year-2 tax
- $7,152 · $596/mo
- Expected delta
- $0/yr ($0/mo · -0.0%)
ⓘ Screening estimate from a state-policy table — verify with the county assessor before closing.
Climate risk First Street
- Flood 1/10 Low FEMA zone X (unshaded) · 0% chance over 30 yrs
- Wildfire 4/10 Moderate
- Heat 7/10 Severe 7 d/yr ≥109°F today · 23 d/yr by 30 yrs out
- Wind 6/10 Major 27% chance of damaging wind over 30 yrs
- Air quality 4/10 Moderate 4 unhealthy d/yr today · 5 by 30 yrs out
Nearby sold comps map
Loading sold comps map…
Walkable amenities ~0.75 mi
Loading nearby amenities…
Taxation est. · year 1
- Rental income
- $30,489
- − Mortgage interest
- −$18,765
- − Property taxes
- −$7,152
- − Insurance
- −$1,675
- − Repairs & maintenance
- −$2,439
- − Management
- −$2,439
- − Depreciation
- −$9,745
- Taxable loss
- −$11,726
- Est. tax savings @ 24.0%
- +$2,814
- After-tax cash flow
- $-3,007/yr
For passive investors: Depreciation is non-cash, so a rental often shows a tax loss while cash-flowing — sheltering income. Rental losses are passive: they offset passive income freely, and up to $25,000/yr can offset ordinary (W-2) income if you actively participate and your MAGI is under $100k (phasing out to $0 by $150k); unused losses carry forward. On sale, claimed depreciation is recaptured at up to 25%, and gains may owe capital-gains tax (a 1031 exchange can defer both). Figures are a year-1 estimate at your 24.0% rate — not tax advice; consult a CPA.
Schools (NCES district)
- District
- Lake Dallas ISD
- NCES district ID
- 4826430
- Math proficiency
- 34% ▼ -20.00%
- Reading proficiency
- 39% ▼ -10.00%
- Median HH income
- $76,645
- Composite
- 34.13/100
- National rank
- #5287
- State rank
- #413 of 826 in TX
Livability — Corinth
- Score
- 79/100
- State rank
- #59
- US rank
- #2235
Category grades
Schools grade is shown separately in the Schools card above.
Census & demographics
- Census place
- Corinth, TX
- County
- Denton County · 901,654 people
- City population
- 47,610
- Metro
- Dallas-Fort Worth-Arlington, TX
- Population (ZIP)
- 47,610
- Household income
- $113,980
- Rent vs Own
- Severe rent burden
- 991.0
Population outlook (Denton County) Hauer SSP2
- Today (2025)
- 1,053,010 people
- By 2030
- 1,192,269 · +13.2%
- By 2040
- 1,472,920 · +39.9%
- By 2050
- 1,746,506 · +65.9%
- By 2075
- 2,358,497 · +124.0%
- By 2100
- 2,779,183 · +163.9%
Race, ethnicity, and origin ACS 2023
- Neighborhood character
- Diverse neighborhood (Simpson 0.57)
- Race & ethnicity
- White 61% Hispanic / Latino 22% Two or more races 16% Black 9% Asian 4%
- Hispanic origin (detail)
- Mexican 16% Puerto Rican 1%
- Common ancestry
- Lithuanian 3% Italian 2% Slovak 2%
- Foreign-born
- 11% · Canada, China, South Korea
- Languages at home
- 79% English-only · Spanish 15% Chinese 1% Other Asian/Pacific 1%
Political lean MEDSL · Denton
- 2024 margin
- R (+13.2) · D 42.7% · R 55.8% · Other 1.5%
- 2008→2024 swing
- +11.0pp toward D · 2008: -24.2pp · 2024: -13.2pp
- All cycles
- 2024: R+13.2 2020: R+8.1 2016: R+20.2 2012: R+31.7 2008: R+24.2
Not yet ingested
- Civics
- —
Market trends
- HPI YoY
- ▼ -43.55%
- Current HPI
- 257.9844
- Rent YoY
- ▲ 0.82%
- Metro
- Dallas-Fort Worth-Arlington, TX
- State GDP YoY
- ▲ 3.95%
- F500 in state
- 110
Industry mix (Fortune 500 HQ in TX)
| Industry | F500 HQs | Revenue |
|---|---|---|
| Energy | 16 | $1,198B |
|
||
| Technology | 5 | $198B |
|
||
| Engineering / Construction | 4 | $72B |
|
||
| Energy Services | 3 | $60B |
|
||
| Utilities | 3 | $41B |
|
||
| Healthcare | 2 | $330B |
|
||
Price history
+109.5% since first listed20 events — show timeline
- 2026-03-28 Listing Removed — NTREIS
- 2026-03-28 Listed $335,000 NTREIS
- 2026-03-17 Price Changed $335,000 NTREIS
- 2026-01-22 Price Changed $350,000 NTREIS
- 2025-12-16 Listed $361,000 NTREIS
- 2019-10-25 Sold (Public Records) — Public Records
- 2019-10-24 Sold (MLS) — NTREIS
- 2019-10-01 Pending — NTREIS
- 2019-09-25 Contingent — NTREIS
- 2019-09-20 Listed $254,900 NTREIS
- 2013-08-02 Sold (Public Records) — Public Records
- 2013-08-02 Sold (MLS) — NTREIS
- 2013-07-06 Pending — NTREIS
- 2013-07-01 Contingent — NTREIS
- 2013-06-24 Listed $170,000 NTREIS
- 2012-02-02 Listing Removed — NTREIS
- 2011-08-01 Listed $156,900 NTREIS
- 2011-06-23 Listing Removed — NTREIS
- 2011-06-05 Price Changed $156,900 NTREIS
- 2011-03-01 Listed $159,900 NTREIS
Property tax history
+4.1%/yrLatest (2025): $7,152 · -1.1% YoY. Source: county tax records.
Cash-flow waterfall
monthlySold comps — $/sqft
last 12 mo · ≤1 miLoading sold comps…